
Need help finding what you are looking for?
Contact Us
PUBLISHER: Mordor Intelligence | PRODUCT CODE: 1692568

PUBLISHER: Mordor Intelligence | PRODUCT CODE: 1692568
Red Meat - Market Share Analysis, Industry Trends & Statistics, Growth Forecasts (2025 - 2030)
PUBLISHED:
PAGES: 466 Pages
DELIVERY TIME: 2-3 business days
SELECT AN OPTION
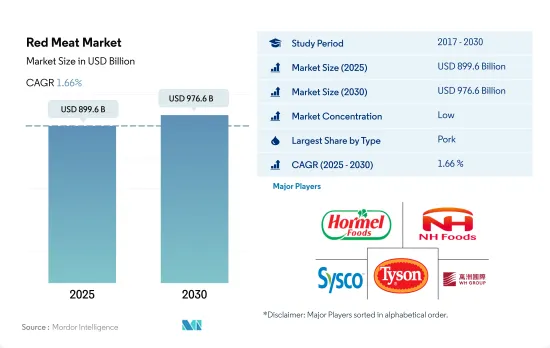
The Red Meat Market size is estimated at 899.6 billion USD in 2025, and is expected to reach 976.6 billion USD by 2030, growing at a CAGR of 1.66% during the forecast period (2025-2030).
Asia-Pacific dominates global consumption, with pork being the preferred choice
- The red meat market grew globally during the historical period, registering a CAGR of 2.64% from 2017 to 2022 by value. This growth was majorly due to the increasing acceptance of meat as a high-protein food globally. The overall growth in the volume of meat consumption is anticipated to be five times greater in developing nations.
- Among all the meat types, pork is expected to dominate worldwide throughout the study period, accounting for the largest share of red meat. Pork is highly consumed due to its lower price point. For instance, in 2022, pork was priced at USD 4,850/ton in China, while beef was priced at USD 10,359/ton. Asia-Pacific was observed to be the largest pork-consuming region, with a share of 65.65% in 2022. The consumption is expanding, mainly due to the popular usage of meat to prepare traditional pan-Asian dishes.
- Beef was the second largest type of red meat consumed globally. The growth rates have not been consistent and declined in value during the historical period, mainly attributed to its price, which was 25-30% higher than any other meat type. This trend impacted consumer meat preferences. For instance, among consumers in North America, 37% felt that price is the main factor impacting consumption rates.
- Mutton was the fastest-growing red meat type globally, registering a CAGR of 3.98% over the period of 2017-2022. Mutton is also traditionally regarded as a seasonal food for specific holidays in most regions, with large retail sales spikes during Easter and Christmas. Consumers spend more on in-store purchases and prefer healthier home-cooked items. Loin and leg were the most consumed cuts, accounting for 45% volume share, while another 21% was held by shoulder cuts in 2021.
Government initiatives will boost market growth
- With the rise in health consciousness, many consumers have shifted to consuming higher amounts of protein, and as a result, the demand for protein has spiked globally. The production of red meat increased by 2.87% by volume, with an increase in the population of 80 million in 2022, resulting in an increase in the consumption of red meat globally.
- Asia-Pacific occupied a significant market share both by volume and value in 2022. Though the vegetarian population accounts for 42% of the population in Asia-Pacific, red meat consumption is high due to high per capita consumption in China. Investments in red meat processing are increasing in Asia-Pacific due to increased production with government support. The shift in the consumption of more processed red meat products drives the sales of red meat in Asia. For instance, in 2021, NDRC in China announced that it would allocate up to USD 7.7 million to increase red meat processing.
- Europe occupies the second-largest share in the consumption of red meat. Pork is the most consumed red meat type in Europe. In 2021, the European pork meat market experienced rising output. EU market leaders continue to expand production in Spain, Denmark, and the Netherlands. As a result, pork consumption increased across Europe, particularly in the south.
- Africa is predicted to be the fastest-growing region in the global red meat market, with an anticipated CAGR of 3.88% by value during the forecast period. Sustained population growth, a rise in real per capita income, and urbanization drive the increase in red meat consumption. As Africa is a developing region with surplus agricultural produce, many companies and governments are establishing production centers.
Global Red Meat Market Trends
Production across regions is likely to boost a growth in demand
- Beef production grew by 6.90% between 2017 and 2022. Global beef production for 2023 is anticipated to increase by nearly 1% to 59.6 million tons, according to USDA's April 2022 forecast. The drought in Argentina has led to more herd break-ups and increased production by 6% compared to the previous year. Similarly, larger fattening stalls and higher slaughter of cows are expected to boost US production by 1% from April 2022. New Zealand production will increase by 3% as male dairy calves are now marketed for beef.
- Due to the high input costs, EU production is cut by 1% due to lower slaughter numbers and lower weights. Upward revisions in forecasts for New Zealand, Australia, Argentina, and Brazil offset declines in forecasts for Mexico, the United Kingdom, and the European Union. Strong demand from China is expected to attract supplies from Brazil and Argentina. Australia is likely to benefit from increasing demand from Japan and South Korea. Additionally, strong US demand for processed beef will boost supplies from Australia and New Zealand.
- Beef production is dominated by North America, which produced 32.13% in 2022. Beef production in North America was highly impacted by the increased production costs and increased feed expenses due to dry conditions. The drought also negatively affected locations in western North America. On January 1, 2022, in Canada, beef cow inventories were down by 1% for the fifth consecutive year, reaching 3.5 million heads. The total US cattle inventories were down by 2% compared to last year, reaching 91.9 million heads. South America also caters to global beef production, producing almost 20.12% of global beef production in 2022. The increased beef demand worldwide increased production and productivity gains.
Production uncertainties across regions are impacting the prices
- The average global price of beef increased by 9.15% between 2017 and 2022, with the United States accounting for the highest price at USD 6.93/kg. Beef has faced strong demand and high prices worldwide, with a visible change in international market dynamics. Local disruptions, such as droughts and increasing consumer demand in individual countries or regions, now exert a greater impact on global trade.
- Key drivers influencing prices in top beef-producing countries include a demand-driven surge in beef prices in the United States. The US beef sector has clearly been in a demand-driven market, witnessing a 40.75% price increase in 2022 compared to 2017. In Brazil, a delay in seasonal rains leads to the production of fewer cattle, forcing processors to raise cattle prices and maintain supply, particularly given demand in the Chinese market. The market faced a reduction in livestock supply across the European Union, resulting in poor profitability of the sector. In June 2023, the retail prices of different forms of beef in the United States were USD 5.028/lb for ground beef, USD 7.020/lb for uncooked beef roasts, and USD 10.359/lb for beef steaks.
- In China, slow growth in domestic beef production, which failed to keep up with local consumption growth prompted by pork-to-beef substitution during the African swine fever outbreak, led to rising beef imports in 2021 and 2022, which, in turn, led to a rise in prices in the country. Australia's supply also impacted the world market, as consecutive years of drought and large herd liquidations resulted in the country's lowest cattle population in 30 years. Australian young stock prices were up by almost 20% in February 2021 compared to the previous year.
Red Meat Industry Overview
The Red Meat Market is fragmented, with the top five companies occupying 9.80%. The major players in this market are Hormel Foods Corporation, NH Foods Ltd, Sysco Corporation, Tyson Foods Inc. and WH Group Limited (sorted alphabetically).
Additional Benefits:
- The market estimate (ME) sheet in Excel format
- 3 months of analyst support
Product Code: 92392
TABLE OF CONTENTS
1 EXECUTIVE SUMMARY & KEY FINDINGS
2 INTRODUCTION
- 2.1 Study Assumptions & Market Definition
- 2.2 Scope of the Study
- 2.3 Research Methodology
3 KEY INDUSTRY TRENDS
- 3.1 Price Trends
- 3.1.1 Beef
- 3.1.2 Mutton
- 3.1.3 Pork
- 3.2 Production Trends
- 3.2.1 Beef
- 3.2.2 Mutton
- 3.2.3 Pork
- 3.3 Regulatory Framework
- 3.3.1 Australia
- 3.3.2 Canada
- 3.3.3 China
- 3.3.4 India
- 3.3.5 Japan
- 3.3.6 Mexico
- 3.3.7 Saudi Arabia
- 3.3.8 United Arab Emirates
- 3.3.9 United States
- 3.4 Value Chain & Distribution Channel Analysis
4 MARKET SEGMENTATION (includes market size in Value in USD, Forecasts up to 2030 and analysis of growth prospects)
- 4.1 Type
- 4.1.1 Beef
- 4.1.2 Mutton
- 4.1.3 Pork
- 4.1.4 Other Meat
- 4.2 Form
- 4.2.1 Canned
- 4.2.2 Fresh / Chilled
- 4.2.3 Frozen
- 4.2.4 Processed
- 4.3 Distribution Channel
- 4.3.1 Off-Trade
- 4.3.1.1 Convenience Stores
- 4.3.1.2 Online Channel
- 4.3.1.3 Supermarkets and Hypermarkets
- 4.3.1.4 Others
- 4.3.2 On-Trade
- 4.3.1 Off-Trade
- 4.4 Region
- 4.4.1 Africa
- 4.4.1.1 By Type
- 4.4.1.2 By Form
- 4.4.1.3 By Distribution Channel
- 4.4.1.4 By Country
- 4.4.1.4.1 Egypt
- 4.4.1.4.2 Nigeria
- 4.4.1.4.3 South Africa
- 4.4.1.4.4 Rest of Africa
- 4.4.2 Asia-Pacific
- 4.4.2.1 By Type
- 4.4.2.2 By Form
- 4.4.2.3 By Distribution Channel
- 4.4.2.4 By Country
- 4.4.2.4.1 Australia
- 4.4.2.4.2 China
- 4.4.2.4.3 India
- 4.4.2.4.4 Indonesia
- 4.4.2.4.5 Japan
- 4.4.2.4.6 Malaysia
- 4.4.2.4.7 South Korea
- 4.4.2.4.8 Rest of Asia-Pacific
- 4.4.3 Europe
- 4.4.3.1 By Type
- 4.4.3.2 By Form
- 4.4.3.3 By Distribution Channel
- 4.4.3.4 By Country
- 4.4.3.4.1 France
- 4.4.3.4.2 Germany
- 4.4.3.4.3 Italy
- 4.4.3.4.4 Netherlands
- 4.4.3.4.5 Russia
- 4.4.3.4.6 Spain
- 4.4.3.4.7 United Kingdom
- 4.4.3.4.8 Rest of Europe
- 4.4.4 Middle East
- 4.4.4.1 By Type
- 4.4.4.2 By Form
- 4.4.4.3 By Distribution Channel
- 4.4.4.4 By Country
- 4.4.4.4.1 Bahrain
- 4.4.4.4.2 Kuwait
- 4.4.4.4.3 Oman
- 4.4.4.4.4 Qatar
- 4.4.4.4.5 Saudi Arabia
- 4.4.4.4.6 United Arab Emirates
- 4.4.4.4.7 Rest of Middle East
- 4.4.5 North America
- 4.4.5.1 By Type
- 4.4.5.2 By Form
- 4.4.5.3 By Distribution Channel
- 4.4.5.4 By Country
- 4.4.5.4.1 Canada
- 4.4.5.4.2 Mexico
- 4.4.5.4.3 United States
- 4.4.5.4.4 Rest of North America
- 4.4.6 South America
- 4.4.6.1 By Type
- 4.4.6.2 By Form
- 4.4.6.3 By Distribution Channel
- 4.4.6.4 By Country
- 4.4.6.4.1 Argentina
- 4.4.6.4.2 Brazil
- 4.4.6.4.3 Rest of South America
- 4.4.1 Africa
5 COMPETITIVE LANDSCAPE
- 5.1 Key Strategic Moves
- 5.2 Market Share Analysis
- 5.3 Company Landscape
- 5.4 Company Profiles (includes Global level Overview, Market level overview, Core Business Segments, Financials, Headcount, Key Information, Market Rank, Market Share, Products and Services, and analysis of Recent Developments)
- 5.4.1 Australian Agricultural Co. Ltd.
- 5.4.2 BRF S.A.
- 5.4.3 Cargill Inc.
- 5.4.4 Hormel Foods Corporation
- 5.4.5 Itoham Yonekyu Holdings, Inc.
- 5.4.6 JBS SA
- 5.4.7 Marfrig Global Foods S.A.
- 5.4.8 Minerva SA
- 5.4.9 NH Foods Ltd
- 5.4.10 OSI Group
- 5.4.11 Starzen Co., Ltd.
- 5.4.12 Sysco Corporation
- 5.4.13 Tyson Foods Inc.
- 5.4.14 Tonnies Holding ApS & Co. KG
- 5.4.15 WH Group Limited
6 KEY STRATEGIC QUESTIONS FOR MEAT INDUSTRY CEOS
7 APPENDIX
- 7.1 Global Overview
- 7.1.1 Overview
- 7.1.2 Porter's Five Forces Framework
- 7.1.3 Global Value Chain Analysis
- 7.1.4 Market Dynamics (DROs)
- 7.2 Sources & References
- 7.3 List of Tables & Figures
- 7.4 Primary Insights
- 7.5 Data Pack
- 7.6 Glossary of Terms
Have a question?


SELECT AN OPTION
Have a question?
Questions? Please give us a call or visit the contact form.