
Need help finding what you are looking for?
Contact Us
PUBLISHER: Mordor Intelligence | PRODUCT CODE: 1692047

PUBLISHER: Mordor Intelligence | PRODUCT CODE: 1692047
United States Red Meat - Market Share Analysis, Industry Trends & Statistics, Growth Forecasts (2025 - 2030)
PUBLISHED:
PAGES: 218 Pages
DELIVERY TIME: 2-3 business days
SELECT AN OPTION
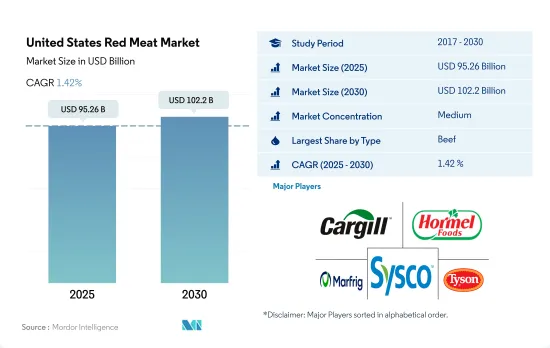
The United States Red Meat Market size is estimated at 95.26 billion USD in 2025, and is expected to reach 102.2 billion USD by 2030, growing at a CAGR of 1.42% during the forecast period (2025-2030).
High production and cultural tradition propels the beef preference in the American diet
- Beef is the most consumed red meat. In 2021, beef observed the highest growth rate by value from 2020, registering 10.34% in the market. Beef is a significant part of the traditional American diet. Popular dishes like hamburgers, steaks, and meatloaf often feature beef as the main ingredient. Texas ranchers breed their Longhorn cattle with Hereford and Angus to produce beef that is highly demanded in the Eastern states.
- Among California, Florida, New Jersey, New York, and Texas, Texans spent the most on beef products, accounting for a 26-28% share during 2019-2021. This was driven by higher beef production in the state. The cattle industry offers more than USD 13 billion annually to the Texan economy. Hamburger consumption in Nevada is higher than in most other states.
- Pork is the second-largest type of red meat, primarily due to the increasing consumption of processed pork, such as luncheon meat, sausage, ham, and bacon. Thus, processed pork is projected to record the fastest CAGR of 1.20% during the forecast period. The U.S. Department of Agriculture (USDA) invested more than USD 43 million in meat processing facilities, such as pork, for expansion throughout the country. As of March 2022, Iowa had an inventory of about 23 million pigs, making it the top producer of swine in the country.
- Over the years, the value share of mutton in the market has grown significantly. Approximately 300 million pounds of lamb are sold annually in the United States, with the majority of the product imported from Australia and New Zealand. The major reason for the decline of sheep production in the US is the decline in wool and lamb meat demand. There are 5.2 million heads of sheep and lamb in the US, with Texas and California leading in terms of production.
United States Red Meat Market Trends
Increased domestic production and rising exports from asian countries is driving the market growth
- Meat producers in the United States are technology-driven, which helps in strategically supplementing forage-based diets to fulfill animal requirements for protein, vitamins, or minerals. The US is one of the largest beef producers in the entire world, with a share of nearly 30% in 2022. The country produced 12.89 million metric tons of beef in 2022, up 0.15 million metric tons from 2021. The top beef-producing states in the US are Ohio, Texas, Oklahoma, and Missouri. Ohio is ranked among the top beef-producing states throughout the nation and had around 2.9 million cattle slaughtered in 2022. Ohio's beef production also increased by 2% in 2022 compared to 2021.
- The US primarily produces high-quality, grain-fed beef. Beef farms and ranches represent over 30% of US farms. The US beef industry is divided into two sectors, namely cow-calf operations and cattle feeding. The focus of the cow-calf operation is to maintain a herd of beef cattle to raise calves. The cattle feeding sector focuses on preparing cattle for various means of production. Beef cattle are raised in all the states of the United States. As of January 2023, there were around 28.9 million beef cattle in the United States, down 4% from last year.
- Beef production in the US is anticipated to grow in the coming years due to the growing demand for American beef from Asia. In 2021, for the first time in the last five years, the United States sent more edible meat to China than Australia, and it currently leads in important export markets like Japan and South Korea. The US frozen beef exports to Asia grew, registering a CAGR of 9.90% by value from 2017 to 2022. The US struggled with ongoing supply chain issues, transportation problems, and ample supplies of domestic products, especially on its West Coast.
Rise in feed cost and lower production of cattle lead to a rise in prices
- The price of beef witnessed a 40% growth from 2017 to 2022. Rising retail demand boosted the need for the wholesale demand for beef. The supply fell as slaughterhouses were shut, and overall slaughter declined, leading to higher beef prices. Therefore, there was a higher focus on fresh/chilled and frozen beef. However, livestock producers earned low prices for their animals despite the high price of meat. The number of cattle and calves at the end of 2022 was around 89.3 million, which was a decline of 3% from the previous year. Cattle prices are expected to receive support from packer demand due to the relatively stable demand for beef and limited supplies of steers and heifers in feedlots.
- In the United States, beef prices were predicted to rise by 15% from 2022 to 2023 and stay high until 2025. This projection is influenced by a severe drought that affected most of the cattle trade this summer and prompted many producers to sell their herds early for slaughter, which will impact the herd size for 2023. In November 2022, 59.3% of the lower 48 states and 49.59% of the US were in a drought, impacting feed production by raising the cost of feed. Feed expenses are the largest operating cost for cow-calf producers, comprising 75% of the operational costs.
- Intervention from authorities may be required in the future to stabilize beef prices and create a supply balance. Companies must increase their production in meat plants to higher volumes, provided the USDA relaxes certain regulatory requirements as it has done in the past. For instance, in April 2020, the USDA's Food Safety Inspection Service temporarily permitted beef processing plants to accelerate processing speeds to supplement the US meat supply as demand increased.
United States Red Meat Industry Overview
The United States Red Meat Market is moderately consolidated, with the top five companies occupying 47.97%. The major players in this market are Cargill Inc., Hormel Foods Corporation, Marfrig Global Foods S.A., Sysco Corporation and Tyson Foods Inc. (sorted alphabetically).
Additional Benefits:
- The market estimate (ME) sheet in Excel format
- 3 months of analyst support
Product Code: 90342
TABLE OF CONTENTS
1 EXECUTIVE SUMMARY & KEY FINDINGS
2 INTRODUCTION
- 2.1 Study Assumptions & Market Definition
- 2.2 Scope of the Study
- 2.3 Research Methodology
3 KEY INDUSTRY TRENDS
- 3.1 Price Trends
- 3.1.1 Beef
- 3.1.2 Mutton
- 3.1.3 Pork
- 3.2 Production Trends
- 3.2.1 Beef
- 3.2.2 Mutton
- 3.2.3 Pork
- 3.3 Regulatory Framework
- 3.3.1 United States
- 3.4 Value Chain & Distribution Channel Analysis
4 MARKET SEGMENTATION (includes market size in Value in USD, Forecasts up to 2030 and analysis of growth prospects)
- 4.1 Type
- 4.1.1 Beef
- 4.1.2 Mutton
- 4.1.3 Pork
- 4.1.4 Other Meat
- 4.2 Form
- 4.2.1 Canned
- 4.2.2 Fresh / Chilled
- 4.2.3 Frozen
- 4.2.4 Processed
- 4.3 Distribution Channel
- 4.3.1 Off-Trade
- 4.3.1.1 Convenience Stores
- 4.3.1.2 Online Channel
- 4.3.1.3 Supermarkets and Hypermarkets
- 4.3.1.4 Others
- 4.3.2 On-Trade
- 4.3.1 Off-Trade
5 COMPETITIVE LANDSCAPE
- 5.1 Key Strategic Moves
- 5.2 Market Share Analysis
- 5.3 Company Landscape
- 5.4 Company Profiles (includes Global level Overview, Market level overview, Core Business Segments, Financials, Headcount, Key Information, Market Rank, Market Share, Products and Services, and analysis of Recent Developments)
- 5.4.1 Cargill Inc.
- 5.4.2 Conagra Brands Inc.
- 5.4.3 Hormel Foods Corporation
- 5.4.4 JBS SA
- 5.4.5 Marfrig Global Foods S.A.
- 5.4.6 NH Foods Ltd
- 5.4.7 OSI Group
- 5.4.8 Sysco Corporation
- 5.4.9 The Clemens Family Corporation
- 5.4.10 The Kraft Heinz Company
- 5.4.11 Tyson Foods Inc.
- 5.4.12 Vion Group
- 5.4.13 WH Group Limited
6 KEY STRATEGIC QUESTIONS FOR MEAT INDUSTRY CEOS
7 APPENDIX
- 7.1 Global Overview
- 7.1.1 Overview
- 7.1.2 Porter's Five Forces Framework
- 7.1.3 Global Value Chain Analysis
- 7.1.4 Market Dynamics (DROs)
- 7.2 Sources & References
- 7.3 List of Tables & Figures
- 7.4 Primary Insights
- 7.5 Data Pack
- 7.6 Glossary of Terms
Have a question?


SELECT AN OPTION
Have a question?
Questions? Please give us a call or visit the contact form.