
Need help finding what you are looking for?
Contact Us
PUBLISHER: Mordor Intelligence | PRODUCT CODE: 1690970

PUBLISHER: Mordor Intelligence | PRODUCT CODE: 1690970
United States Wheat Protein - Market Share Analysis, Industry Trends & Statistics, Growth Forecasts (2025 - 2030)
PUBLISHED:
PAGES: 166 Pages
DELIVERY TIME: 2-3 business days
SELECT AN OPTION
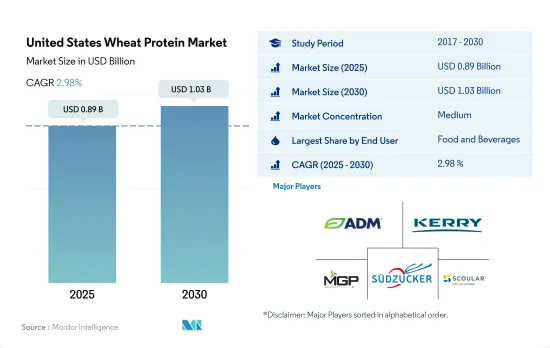
The United States Wheat Protein Market size is estimated at 0.89 billion USD in 2025, and is expected to reach 1.03 billion USD by 2030, growing at a CAGR of 2.98% during the forecast period (2025-2030).
Personal Care and cosmetics segment is expected to gain popularity in forecast period due to beneficial properties associated within skin care products
- The F&B sector witnessed the highest demand, followed by the animal feed sector in 2022. The growing demand for wheat protein in bakeries, breakfast cereals, and meat alternatives products is driving market growth. Thus, the F&B segment of the market is projected to register a CAGR of 1.99% from 2023-2029. Wheat protein is viewed as a more favorable source of plant-based protein by the vegetarian and vegan communities. A variety of traditional meat-based items are increasingly being replaced by substitutes made with wheat protein as part of the plant-based trend.
- The animal feed sector is projected to register the highest CAGR of 3.61% during the forecast period. The capabilities of vital wheat gluten, which works as an appropriate and highly functional alternative to fish- and animal-based feeds, have contributed to the enormous rise of the animal feed industry. In 2021, the 10% lower production of hard winter wheat in the US resulted in its higher price by the end of 2021, hindering its growth rate.
- The personal care and cosmetics segment is expected to grow the fastest, registering a CAGR of 4.97% during the forecast period. Currently, the utilization of wheat protein in cosmetics and skincare is very minimal. In recent years, hydrolysates have found their way into the sector as a natural ingredient in skincare and hair care products. Hydrolyzed wheat protein is known to increase the firmness of the skin and helps to form a film to retain moisture and provide luminosity. It also prevents the skin from drying out, diminishes the appearance of wrinkles, and nourishes and repairs hair. Only 0.01% of the hydrolysates used in the US go to the personal care sector, but this is anticipated to change in the coming years.
United States Wheat Protein Market Trends
Growth in plant protein consumption provides opportunities for key players in the ingredients market
- The per capita consumption rate of plant proteins is increasing at a considerable rate in the United States, supported by investments and innovations, resulting in a consumption rate of 40.28 grams per day, primarily due to a rising number of consumers turning vegan to promote animal welfare. This is because factory farming, where animals are maltreated, is a norm in the United States. Most Americans eat less meat and animal products, but they do not eliminate their consumption entirely. They also tend to be more flexitarian than vegan or vegetarian. Nearly 12% of consumers in the country prefer a plant-based diet, whereas 7% of consumers follow a flexitarian diet. Although consumers of all generations in the United States are interested in plant-based meals, individuals in their 20s and 30s are the keenest to adopt plant-based diets.
- There is a constant rise in the per capita consumption of pea protein due to its wide applications in different food products, like meat, poultry, and bakery products. Around 41% of consumers are interested in plant-based food derived from pea protein. Pea protein is mainly used in sports nutrition and meat alternatives. A typical serving of pea protein powder is 30 grams, with 25 grams of protein. Athletes usually use one serving per day but may take as many as three servings per day.
- Soy and whey proteins are used primarily in the food and beverage, supplement, and sports nutrition industries. In 2021, around 36% of consumers were familiar with soy protein and had consumed the same, whereas 31% of individuals consumed whey protein in the US. Similarly, the consumption of soy-based food and beverages favorably increased by 12.9% during 2014-2019, and it is likely to remain consistent throughout the forecast period.
Winter wheat accounts for 70-80% of total wheat production in the United States
- Wheat holds the third position among the US field crops in planted acreage and production, behind corn and soybeans. In the marketing year 2023/24, US farmers are estimated to have produced a total of 1.81 billion bushels of winter, spring, and durum wheat from a harvested area of 37.3 million acres. Although the United States typically produces only about 6-7% of the world's wheat, it is a major wheat exporter. While Russia and the European Union are the top world wheat exporters, the United States routinely ranks among the top five global wheat exporters.
- The three categories of wheat can be disaggregated into five major classes: Hard Red Winter, Hard Red Spring, Soft Red Winter, white, and durum. Hard red spring (HRS) wheat is one of the major classifications of wheat, accounting for 20% of the production. Hard Red Spring wheat is valued for its high protein levels, making it suitable for specialty bread and blending with lower-protein wheat. The major restraint for the wheat protein market is the rising consumer interest in gluten-free foods and the revived promotion of low carbohydrate diets, which may put downward pressure on per capita wheat consumption.
- Wheat is the principal food grain produced in the United States. The three primary varieties of the grain domestically sown are winter wheat, spring wheat, and durum wheat. In 2023/2024, winter wheat production represents nearly 70% of total US production, on average. Spring wheat typically constitutes about 25-30% of total US wheat production, or 340 million to more than 600 million bushels. Durum wheat is the smallest of the three major wheat categories and typically accounts for less than 75 million bushels or 2-5% of total US wheat production.
United States Wheat Protein Industry Overview
The United States Wheat Protein Market is moderately consolidated, with the top five companies occupying 53.67%. The major players in this market are Archer Daniels Midland Company, Kerry Group PLC, MGP Ingredients Inc., Sudzucker Group and The Scoular Company (sorted alphabetically).
Additional Benefits:
- The market estimate (ME) sheet in Excel format
- 3 months of analyst support
Product Code: 90064
TABLE OF CONTENTS
1 EXECUTIVE SUMMARY & KEY FINDINGS
2 INTRODUCTION
- 2.1 Study Assumptions & Market Definition
- 2.2 Scope of the Study
- 2.3 Research Methodology
3 KEY INDUSTRY TRENDS
- 3.1 End User Market Volume
- 3.1.1 Baby Food and Infant Formula
- 3.1.2 Bakery
- 3.1.3 Beverages
- 3.1.4 Breakfast Cereals
- 3.1.5 Condiments/Sauces
- 3.1.6 Confectionery
- 3.1.7 Dairy and Dairy Alternative Products
- 3.1.8 Elderly Nutrition and Medical Nutrition
- 3.1.9 Meat/Poultry/Seafood and Meat Alternative Products
- 3.1.10 RTE/RTC Food Products
- 3.1.11 Snacks
- 3.1.12 Sport/Performance Nutrition
- 3.1.13 Animal Feed
- 3.1.14 Personal Care and Cosmetics
- 3.2 Protein Consumption Trends
- 3.2.1 Plant
- 3.3 Production Trends
- 3.3.1 Plant
- 3.4 Regulatory Framework
- 3.4.1 United States
- 3.5 Value Chain & Distribution Channel Analysis
4 MARKET SEGMENTATION (includes market size in Value in USD and Volume, Forecasts up to 2030 and analysis of growth prospects)
- 4.1 Form
- 4.1.1 Concentrates
- 4.1.2 Isolates
- 4.1.3 Textured/Hydrolyzed
- 4.2 End User
- 4.2.1 Animal Feed
- 4.2.2 Food and Beverages
- 4.2.2.1 By Sub End User
- 4.2.2.1.1 Bakery
- 4.2.2.1.2 Breakfast Cereals
- 4.2.2.1.3 Condiments/Sauces
- 4.2.2.1.4 Meat/Poultry/Seafood and Meat Alternative Products
- 4.2.2.1.5 RTE/RTC Food Products
- 4.2.2.1.6 Snacks
- 4.2.3 Supplements
- 4.2.3.1 By Sub End User
5 COMPETITIVE LANDSCAPE
- 5.1 Key Strategic Moves
- 5.2 Market Share Analysis
- 5.3 Company Landscape
- 5.4 Company Profiles (includes Global Level Overview, Market Level Overview, Core Business Segments, Financials, Headcount, Key Information, Market Rank, Market Share, Products and Services, and Analysis of Recent Developments).
- 5.4.1 A. Costantino & C. SpA
- 5.4.2 AMCO Proteins
- 5.4.3 Archer Daniels Midland Company
- 5.4.4 Kerry Group PLC
- 5.4.5 MGP Ingredients Inc.
- 5.4.6 Roquette Freres
- 5.4.7 Sudzucker Group
- 5.4.8 The Scoular Company
6 KEY STRATEGIC QUESTIONS FOR PROTEIN INGREDIENTS INDUSTRY CEOS
7 APPENDIX
- 7.1 Global Overview
- 7.1.1 Overview
- 7.1.2 Porter's Five Forces Framework
- 7.1.3 Global Value Chain Analysis
- 7.1.4 Market Dynamics (DROs)
- 7.2 Sources & References
- 7.3 List of Tables & Figures
- 7.4 Primary Insights
- 7.5 Data Pack
- 7.6 Glossary of Terms
Have a question?


SELECT AN OPTION
Have a question?
Questions? Please give us a call or visit the contact form.