
Need help finding what you are looking for?
Contact Us
PUBLISHER: Mordor Intelligence | PRODUCT CODE: 1685890

PUBLISHER: Mordor Intelligence | PRODUCT CODE: 1685890
Africa Biostimulants - Market Share Analysis, Industry Trends & Statistics, Growth Forecasts (2025 - 2030)
PUBLISHED:
PAGES: 153 Pages
DELIVERY TIME: 2-3 business days
SELECT AN OPTION
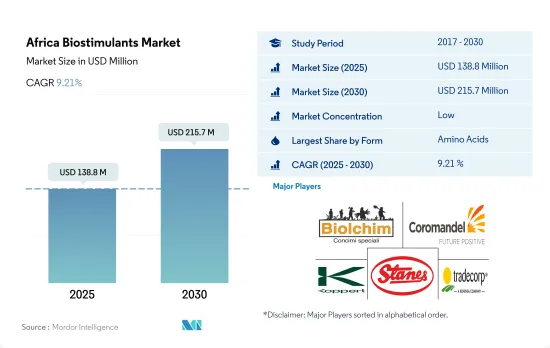
The Africa Biostimulants Market size is estimated at 138.8 million USD in 2025, and is expected to reach 215.7 million USD by 2030, growing at a CAGR of 9.21% during the forecast period (2025-2030).
- Amino acid-based biostimulants dominate the African market, valued at USD 35.3 million in 2022. Amino acid-based biostimulants are widely used because of their ability to enhance seed germination and seedling growth, improve crop resilience to various biotic and abiotic stresses, boost nutrient uptake and utilization, especially with regard to nitrogen and phosphorus, and amplify the efficiency of other agricultural inputs such as pesticides and fertilizers.
- The benefits of humic acid-based biostimulants, such as increased stress tolerance, increased nutrient uptake, and an overall reduction in chemical inputs, as well as their ease of application via fertigation or soil application methods, may drive the market, with the market value expected to grow by about 78.5% to USD 49.6 million by 2029.
- Humic acid-based biostimulants, which are a type of organic soil amendment derived from humic substances found in soil, peat, coal, and other fossil deposits, are known to enhance soil health and plant growth. They are rich in humic acids. These biostimulants account for the second-largest market share, representing 23.4% of the African biostimulant market by value in 2022.
- Seaweed extract-based biostimulants can potentially improve their market share in the African region due to their abundant availability in many coastal areas and their ability to decrease the need for chemical fertilizers in agriculture. These factors may drive the demand for seaweed-based biostimulants during the forecast period. Seaweed extract-based biostimulants accounted for about USD 23.1 million in 2022.
- Humic and fulvic acid-based biostimulants are anticipated to grow faster than other biostimulants between 2023 and 2029.
- Africa is known for its diverse agricultural systems, with a wide range of crops grown across the region. Agriculture plays a vital role in the African economy, and organic farming gained traction, with approximately 120 thousand hectares of organic crop area in 2021. Cereal crops, such as maize, wheat, and corn, are among the most widely grown crops in the region.
- One area of growth in African agriculture is the biostimulants market, which saw a significant increase in value, rising by approximately 18.7% from 2017 to 2021. This growth is expected to continue, with the market value projected to increase by 67.8%.
- The majority of the African biostimulants market is dominated by the Rest of African region, accounting for about 81.1% of the market value in 2022. Tunisia is the top organic producer in terms of area, and Ethiopia has the highest number of organic producers, with approximately 220,000 in 2020. However, the lack of legislation for organic farming in most African countries has hampered the establishment of a well-established biostimulant market in some areas.
- Seaweed-based biostimulants make up 43.8% of the market value, valued at about USD 3.4 million in 2022. The use of seaweed extract-based biostimulants is prevalent in Nigeria.
- The demand for biostimulants in Africa is expected to rise in the coming years, driven by increasing consumer interest in organic products, both domestically and internationally. Farmers are becoming more informed about the drawbacks of heavy reliance on chemical inputs and the economic benefits of using biostimulants. With these factors in play, the biostimulants market in Africa is poised for significant growth, providing opportunities for both farmers and businesses in the region.
Africa Biostimulants Market Trends
8,34,000 organic producers are in the region's organic sector with Tunisia is having more organic land
- In 2022, the area of organic agricultural land in the African region amounted to over 1.2 million hectares, representing 9.0% of the global organic agricultural area.
- In 2020, Africa reported 149,000 hectares more in organic cultivation land than in 2019, recording a 7.7% increase Y-o-Y in line with the presence of nearly 834,000 producers. Tunisia had the largest amount of organic land (more than 290,000 hectares in 2020), whereas Ethiopia had the highest number of organic producers (almost 220,000). The island states of Sao Tome and Principe have the most significant amount of land committed to organic farming in the region, with 20.7% of their agricultural area dedicated to organic crops.
- In the African region, cash crops account for a significant share of organic agricultural land, amounting to 63.2% of the total organic acreage with 817.4 thousand hectares. Row crops hold the second-largest share of organic acreage in Africa, which amounts to about 25.6% of the total organic acreage, totaling 331.2 thousand hectares. Horticultural crops account for 11.2% of the total organic acreage in Africa, with 144.9 thousand hectares in 2022.
- The African countries with significant organic agricultural acreage include the Rest of Africa regional segment, Egypt, and South Africa. In 2022, the Rest of Africa segment accounted for 95.0% of the total organic agricultural acreage in Africa, with 1.2 million hectares, Egypt accounted for a 3.5% share with 45.1 thousand hectares, and South Africa accounted for a 1.0% share with 12.6 thousand hectares.
- Organic agricultural acreage rose by 6.9% between 2017 and 2022 in Africa. It is anticipated to increase by about 52.2% and reach USD 2.0 million by 2029.
Per capita spending on organic product predominant in Egypt, South Africa, and Nigeria countries
- Africa's per capita income has consistently increased throughout the years, encouraging people to spend more money on nutritious food. Organic foods and beverages are gaining more shelf space in the African region. Since the domestic consumption of certified organic produce is relatively small, most organic goods are produced for export.
- In Africa, consumption of organic products has increased significantly, especially in Egypt, South Africa, and Nigeria. In 2021, the per capita consumption of organic products was USD 55.5 in Egypt, followed by South Africa with USD 7.1. The countries with the highest number of organic producers were Ethiopia (almost 222,000), Tanzania (nearly 149,000), and Uganda (over 139,000).
- In the African region, commonly consumed organic products include fresh vegetables and fruits. In Africa, significant efforts have been made to mainstream organic agriculture into policy, national extension systems, marketing, and value chain development. All these factors have gained the attention of consumers.
- With the increasing per capita consumption of beverages, primarily fruit juices, growing health awareness, and consumers shifting toward organic drinks and food that do not contain chemical ingredients, the demand for the African organic food market is expected to grow between 2023 and 2029.
- However, low-income levels and a lack of organic standards and other infrastructure for local market certification are the major restraining factors for the growth of the organic market in the region.
Africa Biostimulants Industry Overview
The Africa Biostimulants Market is fragmented, with the top five companies occupying 18.64%. The major players in this market are Biolchim SPA, Coromandel International Ltd, Koppert Biological Systems Inc., T. Stanes and Company Limited and Trade Corporation International (sorted alphabetically).
Additional Benefits:
- The market estimate (ME) sheet in Excel format
- 3 months of analyst support
Product Code: 49013
TABLE OF CONTENTS
1 EXECUTIVE SUMMARY & KEY FINDINGS
2 REPORT OFFERS
3 INTRODUCTION
- 3.1 Study Assumptions & Market Definition
- 3.2 Scope of the Study
- 3.3 Research Methodology
4 KEY INDUSTRY TRENDS
- 4.1 Area Under Organic Cultivation
- 4.2 Per Capita Spending On Organic Products
- 4.3 Regulatory Framework
- 4.3.1 Egypt
- 4.3.2 Nigeria
- 4.3.3 South Africa
- 4.4 Value Chain & Distribution Channel Analysis
5 MARKET SEGMENTATION (includes market size in Value in USD and Volume, Forecasts up to 2030 and analysis of growth prospects)
- 5.1 Form
- 5.1.1 Amino Acids
- 5.1.2 Fulvic Acid
- 5.1.3 Humic Acid
- 5.1.4 Protein Hydrolysates
- 5.1.5 Seaweed Extracts
- 5.1.6 Other Biostimulants
- 5.2 Crop Type
- 5.2.1 Cash Crops
- 5.2.2 Horticultural Crops
- 5.2.3 Row Crops
- 5.3 Country
- 5.3.1 Egypt
- 5.3.2 Nigeria
- 5.3.3 South Africa
- 5.3.4 Rest of Africa
6 COMPETITIVE LANDSCAPE
- 6.1 Key Strategic Moves
- 6.2 Market Share Analysis
- 6.3 Company Landscape
- 6.4 Company Profiles (includes Global Level Overview, Market Level Overview, Core Business Segments, Financials, Headcount, Key Information, Market Rank, Market Share, Products and Services, and Analysis of Recent Developments).
- 6.4.1 Atlantica Agricola
- 6.4.2 Biolchim SPA
- 6.4.3 Coromandel International Ltd
- 6.4.4 Haifa Group
- 6.4.5 Humic Growth Solutions Inc.
- 6.4.6 Koppert Biological Systems Inc.
- 6.4.7 Microbial Biological Fertilizers International
- 6.4.8 T. Stanes and Company Limited
- 6.4.9 Trade Corporation International
- 6.4.10 UPL
7 KEY STRATEGIC QUESTIONS FOR AGRICULTURAL BIOLOGICALS CEOS
8 APPENDIX
- 8.1 Global Overview
- 8.1.1 Overview
- 8.1.2 Porter's Five Forces Framework
- 8.1.3 Global Value Chain Analysis
- 8.1.4 Market Dynamics (DROs)
- 8.2 Sources & References
- 8.3 List of Tables & Figures
- 8.4 Primary Insights
- 8.5 Data Pack
- 8.6 Glossary of Terms
Have a question?


SELECT AN OPTION
Have a question?
Questions? Please give us a call or visit the contact form.