
Need help finding what you are looking for?
Contact Us
PUBLISHER: Mordor Intelligence | PRODUCT CODE: 1685711

PUBLISHER: Mordor Intelligence | PRODUCT CODE: 1685711
North America Biostimulants - Market Share Analysis, Industry Trends & Statistics, Growth Forecasts (2025 - 2030)
PUBLISHED:
PAGES: 154 Pages
DELIVERY TIME: 2-3 business days
SELECT AN OPTION
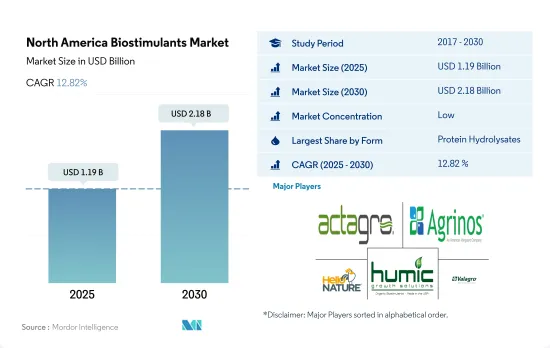
The North America Biostimulants Market size is estimated at 1.19 billion USD in 2025, and is expected to reach 2.18 billion USD by 2030, growing at a CAGR of 12.82% during the forecast period (2025-2030).
- The North American biostimulants market is anticipated to grow over the coming years, driven by several key factors. With a value of USD 840.2 million and volume consumption of 88.2 thousand metric tons in 2022, protein hydrolysates are the most consumed biostimulant type in the region, accounting for a market share of 40.9%. These products are known to improve crop performance, even under abiotic stress conditions, by ensuring the synthesis of essential plant amino acids and nutrients.
- During 2017-2022, the market for protein hydrolysates saw an upward trend and is expected to register a CAGR of 12.8%. This is due to a growing need for increased crop productivity and quality of produce, which can be achieved through biostimulants.
- Humic acid is another biostimulant that has shown promising results in improving crop yield. The application of humic acid in greenhouses and growth chambers has been known to significantly improve crop yield, while foliar application at the rate of 20.0 ml/lit in pepper fields has recorded the highest chlorophyll content. Amino acids, such as L-proline, L-Glycine, L-Glutamic acid, and L-Methionine, are commonly used biostimulants in agriculture. These products can improve various plant processes, including germination, fruit set, pollination, and resistance, to environmental stresses.
- Biostimulants offer a promising solution for improving crop productivity and quality while reducing the use of chemical fertilizers and pesticides. As the demand for organic and sustainable farming practices continues to rise, biostimulants are likely to play an increasingly important role in agriculture.
- The United States, with its highly evolved agricultural sector, has been adapting natural and organic ways of farming. The region is witnessing high consumption of biostimulants, with more farmers preferring to use them due to their ability to enhance crop performance.
- The market in the United States was valued at USD 416.8 million in 2022. The United States accounted for a maximum share of 49.6% of North America in biostimulant consumption, further aided by the increasing organic acreages.
- Canada is the second-largest market, with a share of 35.2% in 2022. The Canadian government's support for safe agriculture practices and the growing demand for organic food in the country are driving the market's growth.
- Organic food sales in the country reached a value of USD 8.10 billion in 2020, as per the data reported by the Organic Federation of Canada. It is reported that Canada is the 6th largest market in the world for organic products, with the supply of organic products failing to keep up with the demand in the country. These factors act as potential drivers for biostimulants in the country.
- Mexico is one of the emerging agricultural countries in North America. It accounted for around 13.3% of the overall agricultural biostimulants market in the region in 2022. There is an immense potential for biostimulants in the country due to its well-established organic farming. The organic area in Mexico is estimated to grow by 16.4% between 2023 and 2029, which is expected to boost the demand for biostimulants.
- The biostimulant market in North America is poised for further growth, driven by the increasing adoption of sustainable agriculture practices and the growing demand for organic food in the region.
North America Biostimulants Market Trends
Organic produce demand grows in major countries like the United States, increasing cultivation area with government support
- The area under organic cultivation of crops in North America was recorded at 1.5 million hectares in 2021, according to the data provided by FibL statistics. The organic area in the region increased by 13.5% between 2017 and 2022. Among the North American countries, the United States is dominant, with 623.0 thousand hectares of agricultural land under organic farming, with California, Maine, and New York being the major states practicing agriculture.
- The United States is followed by Mexico, with 531.1 thousand hectares of area under organic farming in 2021. Mexico is among the top 20 organic food producers in the world. Mexico is the largest exporter of organic coffee in the world, according to the Global Coffee Masters data. The country has the largest area under organic coffee production and even in terms of the number of organic coffee producers.
- The major organic food-producing states in the country include Chiapas, Oaxaca, Michoacan, Chihuahua, and Guerrero, which account for 80.0% of the total organic area in the country. Organizations, such as National Association for Organic Agriculture, promote organic agriculture in the country, which is expected to motivate more farmers to take up organic agriculture. The Mexican government, in addition to financial assistance, is supporting research and development activities to help organic agriculture.
- Canada's area under organic crop cultivation increased from 0.4 million hectares in 2017 to 0.45 million hectares in 2021. Row crops occupied the maximum area with 0.42 million hectares in 2021. The Canadian government announced a sum of USD 297,330 in 2021 as Organic Development Fund to support organic farmers. These initiatives are expected to increase the organic area in the region.
Growing demand for organic produce in domestic and international markets, rise in per capita spending on organic food
- The average per capita spending on organic food products in North America was recorded as USD 109.7 in 2021. The per capita spending in the United States is the highest among the North American countries, with average spending of USD 186.7 in 2021. According to the Organic Tarde Association, the sales of organic products in the United States crossed USD 63.00 billion in 2021, with a 2.0% increase over the previous year, with organic food sales standing at USD 57.5 billion in 2021. Organic fruits and vegetables accounted for 15.0% of the total organic product sales, with a value of USD 21.0 billion in 2021.
- Organic food sales in Canada reached a value of USD 8.10 billion in 2020, as per the data reported by the Organic Federation of Canada. It is reported that Canada is the 6th largest market in the world for organic products, with the supply of organic products failing to keep up with the demand in the country. The average spending on organic food per person was USD 142.6 in 2021. Increasing government support to retailers is expected to increase the availability, accessibility, and affordability of organic products in the country. Organic Tarde Association estimated that the Canadian organic products market is expected to register a CAGR of 6.3% between 2021 and 2026.
- In 2021, Mexico registered a market size of USD 63.0 million for organic products with a global rank of 35, and it is estimated to register a CAGR of 7.2% between 2021 and 2026. However, the per capita spending on organic products in the country is less compared to other countries in the region, with a value of USD 0.49 in 2021. More players entering the market in Mexico are expected to increase the demand for organic products in the country.
North America Biostimulants Industry Overview
The North America Biostimulants Market is fragmented, with the top five companies occupying 3.23%. The major players in this market are Actagro LLC, Agrinos, Hello Nature USA Inc., Humic Growth Solutions Inc. and Valagro USA (sorted alphabetically).
Additional Benefits:
- The market estimate (ME) sheet in Excel format
- 3 months of analyst support
Product Code: 46580
TABLE OF CONTENTS
1 EXECUTIVE SUMMARY & KEY FINDINGS
2 REPORT OFFERS
3 INTRODUCTION
- 3.1 Study Assumptions & Market Definition
- 3.2 Scope of the Study
- 3.3 Research Methodology
4 KEY INDUSTRY TRENDS
- 4.1 Area Under Organic Cultivation
- 4.2 Per Capita Spending On Organic Products
- 4.3 Regulatory Framework
- 4.3.1 Canada
- 4.3.2 Mexico
- 4.3.3 United States
- 4.4 Value Chain & Distribution Channel Analysis
5 MARKET SEGMENTATION (includes market size in Value in USD and Volume, Forecasts up to 2030 and analysis of growth prospects)
- 5.1 Form
- 5.1.1 Amino Acids
- 5.1.2 Fulvic Acid
- 5.1.3 Humic Acid
- 5.1.4 Protein Hydrolysates
- 5.1.5 Seaweed Extracts
- 5.1.6 Other Biostimulants
- 5.2 Crop Type
- 5.2.1 Cash Crops
- 5.2.2 Horticultural Crops
- 5.2.3 Row Crops
- 5.3 Country
- 5.3.1 Canada
- 5.3.2 Mexico
- 5.3.3 United States
- 5.3.4 Rest of North America
6 COMPETITIVE LANDSCAPE
- 6.1 Key Strategic Moves
- 6.2 Market Share Analysis
- 6.3 Company Landscape
- 6.4 Company Profiles (includes Global Level Overview, Market Level Overview, Core Business Segments, Financials, Headcount, Key Information, Market Rank, Market Share, Products and Services, and Analysis of Recent Developments).
- 6.4.1 Actagro LLC
- 6.4.2 Agriculture Solutions Inc.
- 6.4.3 Agrinos
- 6.4.4 Agrocare Canada Inc.
- 6.4.5 Hello Nature USA Inc.
- 6.4.6 Humic Growth Solutions Inc.
- 6.4.7 Koppert Biological Systems Inc.
- 6.4.8 Plant Response Biotech Inc.
- 6.4.9 Sigma Agriscience LLC
- 6.4.10 Valagro USA
7 KEY STRATEGIC QUESTIONS FOR AGRICULTURAL BIOLOGICALS CEOS
8 APPENDIX
- 8.1 Global Overview
- 8.1.1 Overview
- 8.1.2 Porter's Five Forces Framework
- 8.1.3 Global Value Chain Analysis
- 8.1.4 Market Dynamics (DROs)
- 8.2 Sources & References
- 8.3 List of Tables & Figures
- 8.4 Primary Insights
- 8.5 Data Pack
- 8.6 Glossary of Terms
Have a question?


SELECT AN OPTION
Have a question?
Questions? Please give us a call or visit the contact form.