
Need help finding what you are looking for?
Contact Us
PUBLISHER: Mordor Intelligence | PRODUCT CODE: 1693535

PUBLISHER: Mordor Intelligence | PRODUCT CODE: 1693535
Asia-Pacific Controlled Release Fertilizer - Market Share Analysis, Industry Trends & Statistics, Growth Forecasts (2025 - 2030)
PUBLISHED:
PAGES: 190 Pages
DELIVERY TIME: 2-3 business days
SELECT AN OPTION
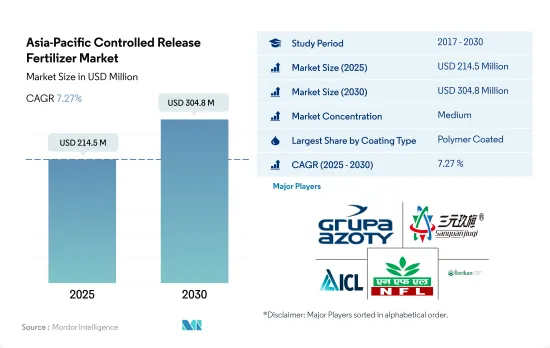
The Asia-Pacific Controlled Release Fertilizer Market size is estimated at 214.5 million USD in 2025, and is expected to reach 304.8 million USD by 2030, growing at a CAGR of 7.27% during the forecast period (2025-2030).
China and India dominate the Asia-Pacific controlled-release fertilizers market
- During the study period, the market for polymer-coated controlled-release fertilizers experienced notable growth. By 2022, these fertilizers held a significant share of 76.0% in the overall controlled-release fertilizer (CRF) market in Asia-Pacific. The region's increasing emphasis on ecologically safe fertilizers is a key driver behind the surge in demand for new controlled-release options.
- The cultivation expansion of cereal and oilseeds, including corn, soybeans, and rapeseed, is propelling the market for poly-sulfur-coated urea. Moreover, excessive urea accumulation in soils has led to depletion, fueling the demand for poly-sulfur-coated controlled-release fertilizers. In addition, the market for poly-sulfur-coated CRFs is poised for growth, driven by factors like the rising demand for highly efficient and eco-friendly products. It is projected to achieve a value CAGR of 6.8% in the region between 2023-2030.
- In 2022, China dominated the market for other types of coated controlled-release fertilizers, commanding a 42.3% value share in the CRF market. Of these fertilizers, approximately 69.6% were utilized in field crops, with horticultural crops following suit.
- The use of chemical fertilizers has detrimental effects, including soil pH alteration, inhibition of microbial growth, and the release of greenhouse gases from excessive nitrogen application. These environmental concerns, coupled with escalating nutrient losses, are fueling the demand for alternative fertilizers. As a result, the market is projected to witness a CAGR of 6.2% in value during the period spanning from 2023 to 2030.
China dominates the APAC controlled-release fertilizer market
- Approximately 70.0% of the population in the Asia-Pacific region depends directly on agriculture as the primary source of their livelihood. However, the region's agriculture sector is facing many issues in terms of low productivity.
- China dominates the APAC controlled-release fertilizer market, accounting for 43.8% of the market value share in 2022. Polymer-coated fertilizers accounted for the largest share of the controlled-release fertilizer market, followed by polymer sulfur-coated fertilizers. The polymer-coated fertilizer segment was valued at USD 17.9 million in 2017, and it is anticipated to reach USD 58.0 million by 2030, mainly due to increasing NUE by reducing fertilizer consumption by adopting CRFs.
- India is the region's second-largest market for controlled-release fertilizers, accounting for 16.6% in 2022. Controlled-release urea is the most commonly used form of CRF in India. Nitrogen loss is one of the main problems faced by rice farmers, and the efficiency of nitrogen utilization in rice is often inadequate. This is due to the large loss of nitrogen due to volatilization, leaching, and denitrification. One way to improve nitrogen efficiency is to use controlled-release urea. Controlled-release urea generally outperforms granular urea fertilizers in reducing nitrogen loss, stimulating plant growth, and increasing nitrogen concentration.
- In 2017, the International Plant Nutrition Institute of China conducted a controlled-release urea fertilizer Application Program in Hubei province. It was proven that the consistent use of CRU fertilizer helps improve the yield and profitability of major crops, such as rice and eggplant. Hence, the market is expected to grow in the future.
Asia-Pacific Controlled Release Fertilizer Market Trends
The significant expansion of cultivation of major growing crops is anticipated to boost the growth of the market
- Field crop cultivation dominates the region, accounting for more than 95% of the total crop area. Rice, wheat, and corn are the major field crops produced in the region, together accounting for about 38% of the total crop area in 2022. The rising area under cultivation is expected to increase the demand for fertilizer usage in the country.
- The Asia-Pacific region, which includes China, India, Pakistan, and Australia, is among the world's largest wheat producers. China and India are also the world's largest wheat producers and consumers. The increase in demand and consumption of wheat is due to wheat being one of the major staple foods of this region, and the area increased by a percentage point during the study period. In 2022, China accounted for the production of 138 million metric tons of wheat, making it the largest wheat producer in the world, and India had a wheat production of 103 million metric tons.
- Rice is the largest cultivated field crop in the region. Its cultivation alone accounted for about 16.44% of the total agricultural land in 2022. Rice is the staple food of Asia and most parts of the Pacific region. China was projected to produce 147 million tons of rice, and India was expected to harvest 124 million tons of rice in 2022. India was expected to consume 109 million tons while exporting a world-leading 19.5 million tons.
- The surge in both domestic and international demand for field crops has prompted an expansion in the cultivation area dedicated to these crops. This significant increase in cultivated land is expected to have a direct and positive impact on the Asia-Pacific CRF market from 2023 to 2030.
About 28% of nitrous oxide emissions from croplands in the world are from China's agricultural lands
- In field crops, the average primary nutrient (nitrogen, potassium, and phosphorus) application rate in the country was 129.1 kg/ha in 2022. Nitrogen accounted for 58.5%, potassium for 25.3%, and phosphorus for 16.1% of the average primary nutrient application for field crops. Most primary nutrients were applied through the soil application method. Conventional soil-based primary macronutrient fertilizers accounted for 69.2% of the total primary macronutrient fertilizer market in 2022.
- In Asia, the primary nutrient input is high, particularly for nitrogenous and potassic fertilizers, because most soils in the region are deficient in nitrogen and potassic nutrients. However, Asia-Pacific, which is the largest region in the world in terms of land area and population, is also the largest producer and consumer of agrochemicals among all the regions worldwide. About 28% of nitrous oxide emissions from croplands worldwide are from China's agricultural lands.
- In field crops, wheat had an average primary nutrient application rate of 214.9 kg/ha, the highest among field crops in 2022. In primary nutrients, nitrogen occupies the first place with an average application rate of 448.5 kg/ha, as nitrogen is required in large amounts for plant metabolism. It is also a major component of chlorophyll and amino acids.
- The contamination of surface and groundwater with nitrogen and phosphorus has been considered a result of inadequate advice given to farmers regarding fertilizer application rates and a possible larger crop. However, the trend is shifting toward highly efficient fertilizers.
Asia-Pacific Controlled Release Fertilizer Industry Overview
The Asia-Pacific Controlled Release Fertilizer Market is moderately consolidated, with the top five companies occupying 61.40%. The major players in this market are Grupa Azoty S.A. (Compo Expert), Hebei Sanyuanjiuqi Fertilizer Co., Ltd., ICL Group Ltd, National Fertilizers Ltd and New Mountain Capital (Florikan) (sorted alphabetically).
Additional Benefits:
- The market estimate (ME) sheet in Excel format
- 3 months of analyst support
Product Code: 92600
TABLE OF CONTENTS
1 EXECUTIVE SUMMARY & KEY FINDINGS
2 REPORT OFFERS
3 INTRODUCTION
- 3.1 Study Assumptions & Market Definition
- 3.2 Scope of the Study
- 3.3 Research Methodology
4 KEY INDUSTRY TRENDS
- 4.1 Acreage Of Major Crop Types
- 4.1.1 Field Crops
- 4.1.2 Horticultural Crops
- 4.2 Average Nutrient Application Rates
- 4.2.1 Primary Nutrients
- 4.2.1.1 Field Crops
- 4.2.1.2 Horticultural Crops
- 4.2.1 Primary Nutrients
- 4.3 Regulatory Framework
- 4.4 Value Chain & Distribution Channel Analysis
5 MARKET SEGMENTATION (includes market size in Value in USD and Volume, Forecasts up to 2030 and analysis of growth prospects)
- 5.1 Coating Type
- 5.1.1 Polymer Coated
- 5.1.2 Polymer-Sulfur Coated
- 5.1.3 Others
- 5.2 Crop Type
- 5.2.1 Field Crops
- 5.2.2 Horticultural Crops
- 5.2.3 Turf & Ornamental
- 5.3 Country
- 5.3.1 Australia
- 5.3.2 Bangladesh
- 5.3.3 China
- 5.3.4 India
- 5.3.5 Indonesia
- 5.3.6 Japan
- 5.3.7 Pakistan
- 5.3.8 Philippines
- 5.3.9 Thailand
- 5.3.10 Vietnam
- 5.3.11 Rest of Asia-Pacific
6 COMPETITIVE LANDSCAPE
- 6.1 Key Strategic Moves
- 6.2 Market Share Analysis
- 6.3 Company Landscape
- 6.4 Company Profiles
- 6.4.1 Grupa Azoty S.A. (Compo Expert)
- 6.4.2 Haifa Group
- 6.4.3 Hebei Sanyuanjiuqi Fertilizer Co., Ltd.
- 6.4.4 Hebei Woze Wufeng Biological Technology Co., Ltd
- 6.4.5 ICL Group Ltd
- 6.4.6 National Fertilizers Ltd
- 6.4.7 New Mountain Capital (Florikan)
- 6.4.8 Zhongchuang xingyuan chemical technology co.ltd
7 KEY STRATEGIC QUESTIONS FOR FERTILIZER CEOS
8 APPENDIX
- 8.1 Global Overview
- 8.1.1 Overview
- 8.1.2 Porter's Five Forces Framework
- 8.1.3 Global Value Chain Analysis
- 8.1.4 Market Dynamics (DROs)
- 8.2 Sources & References
- 8.3 List of Tables & Figures
- 8.4 Primary Insights
- 8.5 Data Pack
- 8.6 Glossary of Terms
Have a question?


SELECT AN OPTION
Have a question?
Questions? Please give us a call or visit the contact form.