
Need help finding what you are looking for?
Contact Us
PUBLISHER: Mordor Intelligence | PRODUCT CODE: 1693430

PUBLISHER: Mordor Intelligence | PRODUCT CODE: 1693430
Textured Vegetable Protein - Market Share Analysis, Industry Trends & Statistics, Growth Forecasts (2025 - 2030)
PUBLISHED:
PAGES: 367 Pages
DELIVERY TIME: 2-3 business days
SELECT AN OPTION
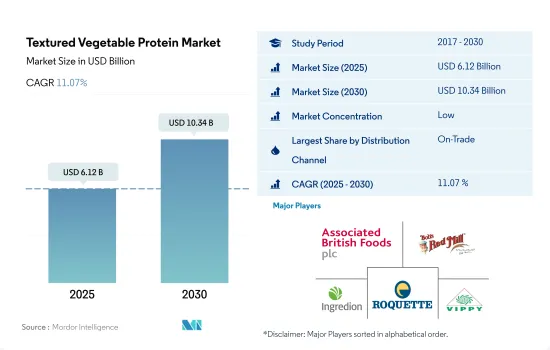
The Textured Vegetable Protein Market size is estimated at 6.12 billion USD in 2025, and is expected to reach 10.34 billion USD by 2030, growing at a CAGR of 11.07% during the forecast period (2025-2030).
The veganism trend is driving the penetration of textured plant protein on the menu
- The on-trade channel is the largest distribution segment for the global sales of textured vegetable protein. Nearly 65% of the total value of TVP consumption is met through this channel, and it is expected to become more prominent and register a CAGR of 10.8% by value during the forecast period. In 2021, there were around 79 million vegans around the world. While the trend of veganism is growing, it still covers only 1% of the global population. The number of vegans is estimated to reach a much higher level. This trend will support the TVP market as more restaurants and hotels look forward to offering TVP-based meat substitutes to cater to vegan diets.
- The off-trade channel registered a growth of 28.35% by value during 2017-2022, which was majorly attributable to the development of the supermarkets/hypermarkets channel. The fastest-growing channel for the sales of textured vegetable protein worldwide is the online channel, which is projected to register a CAGR of 15.83% by value during the forecast period. Online retailers are more popular among consumers because they offer various TVP-based products in raw, frozen, and processed forms.
- The growth of the ready-to-cook (RTC) and ready-to-eat (RTE) categories is a major driving force for the online TVP channel, as consumers demand such products due to their busy lifestyles. Only 9.10% by value of the total TVP sold was through the online channel in 2022. This situation is expected to change as the online channel is projected to garner nearly 13.79% of the total market share by 2029. The online channel is a much easier trade channel for companies as it is less capital-intensive, and launching a product is much simpler than in the offline retail segment.
Increased vegan and vegetarian populations propelling the market growth
- Europe was the leading market for TVP in the world in 2022. With the growing market penetration of vegan food and the increasing number of vegans and flexitarians among the European population, the market for meat alternatives boomed in the region. There are approximately 2.6 million vegans in Germany as of 2022, and around 3.2% of the German population is vegan. Also, the number of vegans doubled from 2017 to 2022. German flexitarians prefer to consume TVP in the forms of patties/burgers, sausages, and ground meat because these products replicate the taste and texture of animal meat. The flexitarian population is limiting meat consumption due to concerns over animal welfare.
- The Middle East is anticipated to be the fastest-growing region in terms of consuming textured vegetable protein. It is projected to register a CAGR of 11.45% in terms of value during the forecast period. As a huge part of the global population is going to Arabic countries for tourism purposes, there is an increase in the demand for meat alternatives in countries like Saudi Arabia and the United Arab Emirates. There has been a growing perception of healthy vegetarian food options among people in the Middle East.
- North America holds the second-highest share of the global textured vegetable protein market. The United States is one of the key markets for textured vegetable protein. The higher demand for meat alternatives is backed by an ever-increasing number of Americans adopting veganism or turning to flexitarian diets. In order to meet the demand for soybeans in the country, around 4.44 billion bushels of soybeans were produced in the United States in 2022, planted in an area of 87.2 million acres (35.3 million hectares).
Global Textured Vegetable Protein Market Trends
TVP prices are anticipated to grow at a minimum rate owing to its improved market structure
- The average global price of textured vegetable protein (TVP) grew by 0.43% from 2017 to 2022. As TVP is mostly bought by large corporations as a texturant to produce their branded meat and meat substitute products, steep price variations have not been witnessed in the market. Unlike tofu and tempeh, the prices of TVP are not completely dependent on a single raw material. The prices of soybean, wheat, and peas also play key roles in determining the price of TVP.
- The demand for TVP will only continue to increase as it has become a commoditized product manufactured by many companies. The rising grain and legume prices play a huge role in the market equilibrium of TVP. For instance, on average, at the global level, wheat prices rose from USD 4.62 per kg in March 2019 to as high as USD 11.78 per kg in May 2022. One of the major reasons for the rise in prices was the abrupt suspension of exports from Ukraine, one of the major wheat exporters, due to the war with Russia. This situation further exacerbated global supply concerns. Soybean prices also witnessed a similar trend, rising from USD 8.32 in April 2020 to USD 17.32 in May 2022.
- Competition from the very established, conventional meat industry has made costs a challenge for plant-based innovators. For example, in 2019, vegetarian chicken cuts were USD 0.83 more expensive per 100 g in the Netherlands than their animal counterparts. In 2022, meatless chicken cuts were only USD 0.13 more expensive per 100 g. The price differential for ground beef decreased from USD 0.26 to USD 0.06 over the same period. Apart from price positioning, consumers are highly influenced by the product's taste and local flavors, making it essential for product manufacturers to thrive in this market.
Textured Vegetable Protein Industry Overview
The Textured Vegetable Protein Market is fragmented, with the top five companies occupying 4.27%. The major players in this market are Associated British Foods PLC, Bob's Red Mill Natural Foods, Ingredion Inc., Roquette Freres and Vippy Industries Ltd (sorted alphabetically).
Additional Benefits:
- The market estimate (ME) sheet in Excel format
- 3 months of analyst support
Product Code: 92489
TABLE OF CONTENTS
1 EXECUTIVE SUMMARY & KEY FINDINGS
2 INTRODUCTION
- 2.1 Study Assumptions & Market Definition
- 2.2 Scope of the Study
- 2.3 Research Methodology
3 KEY INDUSTRY TRENDS
- 3.1 Price Trends
- 3.1.1 Textured Vegetable Protein
- 3.2 Regulatory Framework
- 3.2.1 Canada
- 3.2.2 France
- 3.2.3 Germany
- 3.2.4 Italy
- 3.2.5 Mexico
- 3.2.6 United Kingdom
- 3.2.7 United States
- 3.3 Value Chain & Distribution Channel Analysis
4 MARKET SEGMENTATION (includes market size in Value in USD, Forecasts up to 2030 and analysis of growth prospects)
- 4.1 Distribution Channel
- 4.1.1 Off-Trade
- 4.1.1.1 Convenience Stores
- 4.1.1.2 Online Channel
- 4.1.1.3 Supermarkets and Hypermarkets
- 4.1.1.4 Others
- 4.1.2 On-Trade
- 4.1.1 Off-Trade
- 4.2 Region
- 4.2.1 Africa
- 4.2.1.1 By Distribution Channel
- 4.2.1.2 By Country
- 4.2.1.2.1 Egypt
- 4.2.1.2.2 Nigeria
- 4.2.1.2.3 South Africa
- 4.2.1.2.4 Rest of Africa
- 4.2.2 Asia-Pacific
- 4.2.2.1 By Distribution Channel
- 4.2.2.2 By Country
- 4.2.2.2.1 Australia
- 4.2.2.2.2 China
- 4.2.2.2.3 India
- 4.2.2.2.4 Indonesia
- 4.2.2.2.5 Japan
- 4.2.2.2.6 Malaysia
- 4.2.2.2.7 South Korea
- 4.2.2.2.8 Rest of Asia-Pacific
- 4.2.3 Europe
- 4.2.3.1 By Distribution Channel
- 4.2.3.2 By Country
- 4.2.3.2.1 France
- 4.2.3.2.2 Germany
- 4.2.3.2.3 Italy
- 4.2.3.2.4 Netherlands
- 4.2.3.2.5 Russia
- 4.2.3.2.6 Spain
- 4.2.3.2.7 United Kingdom
- 4.2.3.2.8 Rest of Europe
- 4.2.4 Middle East
- 4.2.4.1 By Distribution Channel
- 4.2.4.2 By Country
- 4.2.4.2.1 Bahrain
- 4.2.4.2.2 Kuwait
- 4.2.4.2.3 Oman
- 4.2.4.2.4 Qatar
- 4.2.4.2.5 Saudi Arabia
- 4.2.4.2.6 United Arab Emirates
- 4.2.4.2.7 Rest of Middle East
- 4.2.5 North America
- 4.2.5.1 By Distribution Channel
- 4.2.5.2 By Country
- 4.2.5.2.1 Canada
- 4.2.5.2.2 Mexico
- 4.2.5.2.3 United States
- 4.2.5.2.4 Rest of North America
- 4.2.6 South America
- 4.2.6.1 By Distribution Channel
- 4.2.6.2 By Country
- 4.2.6.2.1 Argentina
- 4.2.6.2.2 Brazil
- 4.2.6.2.3 Rest of South America
- 4.2.1 Africa
5 COMPETITIVE LANDSCAPE
- 5.1 Key Strategic Moves
- 5.2 Market Share Analysis
- 5.3 Company Landscape
- 5.4 Company Profiles (includes Global level Overview, Market level overview, Core Business Segments, Financials, Headcount, Key Information, Market Rank, Market Share, Products and Services, and analysis of Recent Developments)
- 5.4.1 AGT Food & Ingredients Inc.
- 5.4.2 Associated British Foods PLC
- 5.4.3 Bob's Red Mill Natural Foods
- 5.4.4 Bunge Limited
- 5.4.5 Cargill Inc.
- 5.4.6 China Foodstuff & Protein Group Co. Ltd
- 5.4.7 CHS Inc.
- 5.4.8 Dixie Foods
- 5.4.9 Do It Organic
- 5.4.10 Ingredion Inc.
- 5.4.11 International Flavors & Fragrances Inc.
- 5.4.12 MGP Ingredients Inc.
- 5.4.13 NOW Health Group, Inc.
- 5.4.14 Roquette Freres
- 5.4.15 Univar Solutions Inc.
- 5.4.16 Vippy Industries Ltd
- 5.4.17 Wholesome Provisions Inc.
6 KEY STRATEGIC QUESTIONS FOR MEAT SUBSTITUTES INDUSTRY CEOS
7 APPENDIX
- 7.1 Global Overview
- 7.1.1 Overview
- 7.1.2 Porter's Five Forces Framework
- 7.1.3 Global Value Chain Analysis
- 7.1.4 Market Dynamics (DROs)
- 7.2 Sources & References
- 7.3 List of Tables & Figures
- 7.4 Primary Insights
- 7.5 Data Pack
- 7.6 Glossary of Terms
Have a question?


SELECT AN OPTION
Have a question?
Questions? Please give us a call or visit the contact form.