
Need help finding what you are looking for?
Contact Us
PUBLISHER: Mordor Intelligence | PRODUCT CODE: 1690773

PUBLISHER: Mordor Intelligence | PRODUCT CODE: 1690773
India E-bike - Market Share Analysis, Industry Trends & Statistics, Growth Forecasts (2025 - 2030)
PUBLISHED:
PAGES: 188 Pages
DELIVERY TIME: 2-3 business days
SELECT AN OPTION
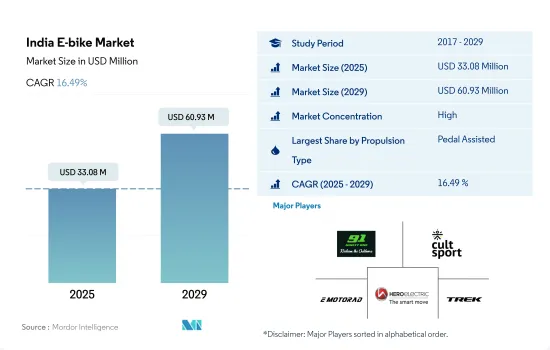
The India E-bike Market size is estimated at 33.08 million USD in 2025, and is expected to reach 60.93 million USD by 2029, growing at a CAGR of 16.49% during the forecast period (2025-2029).
PROPULSION SEGMENT MARKET OVERVIEW
- E-bikes have the potential to become India's best means of mobility. They are also an excellent means of transportation since they mix the convenience of a car with the excitement of riding, making them especially useful for recreational activities. Speed pedelec is expected to soon become the most practical pedal-assist bicycle alternative for shorter distances. As India's power and speed capabilities develop over the next years, people may gravitate toward the speed pedelec category. Similarly, the increasing popularity of throttle-assisted e-bikes, which transmit power directly to the motor without the need for manual pedaling, could be attributed to the segment's expansion.
- E-bikes are an eco-friendly option than traditional two-wheelers because they emit less carbon into the atmosphere. Many initiatives taken by the Indian government to decrease automotive pollution are boosting the growth of the market. The rising popularity of e-bikes is benefiting the sector due to lower ownership and maintenance costs. Advancements in charging infrastructure and India's expanding car sector provide end customers with attractive development opportunities.
- The increased availability of e-bikes through online and offline outlets is driving e-bike sales across the country. Key market organizations operating in India are investing extensively in R&D projects to increase product quality. They also focus on refining battery technology, combining lightweight materials, and investing in advertising campaigns to increase overall sales. As a result of these initiatives, the market is projected to expand, which may fuel the growth of electric bicycles in India in the next few years.
India E-bike Market Trends
India's E-Bike adoption rates, though starting from a low base, show a consistent increase, indicating a growing market potential.
- The use of e-bikes has become increasingly popular in India over the past few years. Additionally, growing public awareness of the health benefits of cycling, increasing traffic congestion in India during rush hours, and expanding government initiatives to support e-bike adoption are all contributing to the country's e-bike adoption. Also, fuel expenditures and lower maintenance costs sped up the adoption rate of e-bikes among Indians to 0.10% in 2019 over 2018.
- The spreading of COVID cases and growth in the wave affected the bicycle business positively. Factors such as not using public or rented transportation to maintain social distancing have changed the commuting methods of the consumer, further encouraging people to invest in e-bikes, as it is one of the convenient and price-friendly options over other modes of commuting daily to offices and nearby places. Such factors accelerated the adoption rate by 0.60% in 2022 over 2021 across the country.
- E-bike adoption has increased with the return of commercial operations and the lifting of trade barriers of lockdown. The country's import and export activities have improved as a result of the removal of trade restrictions. The adoption rate for e-bikes is anticipated to increase to 5.00% in 2029 from 0.60% in 2022 as a result of customer attraction to e-bikes due to their features and advantages, such as fuel saving and time-saving.
India shows a steady increase in the percentage of population commuting 5-15 km daily, indicating evolving travel distances.
- People in various cities have embraced the bicycle culture, and the demand for bicycles in India has increased over the past few years. However, commuter travel of 5-15 kilometers is still relatively low compared to other modes of transportation, as most people prefer to travel via various modes such as two-wheelers and public transportation. Less than 5% of the population chose to commute via bicycles to nearby places within 5-15 kilometers in 2019. However, in 2020, traveling between 5 and 15 kilometers increased as many people started exercising and using bicycles to travel to nearby marketplaces for buying essentials during the lockdown. Such factors increased the demand for bicycles in India in 2020 over 2019.
- The pandemic had a significant and beneficial impact on the Indian bicycle market. More Indians walked or cycled instead of using public transportation to nearby places. The introduction of e-bikes with advanced features and longer battery lives also encouraged people to choose bicycles for exercising and recreational weekend activities, which further increased the number of commuters traveling 5-15 kilometers in India in 2021 over 2020.
- People developed the habit of using bicycles to commute to nearby places. Currently, many people travel daily by bicycle within a radius of 5-15 kilometers to get to various places such as local markets. Due to the increased health advantages, carbon-free commutes, and time savings from avoiding traffic bottlenecks, more people are choosing to commute by bicycle. These factors are expected to increase commuter travel between 5 and 15 kilometers in India during the forecast period.
India E-bike Industry Overview
The India E-bike Market is fairly consolidated, with the top five companies occupying 82.78%. The major players in this market are Alphavector (India) Pvt Ltd, Cultsport, EMotorad, Hero Cycles Limited and TREK BICYCLE INDIA PRIVATE LIMITED (sorted alphabetically).
Additional Benefits:
- The market estimate (ME) sheet in Excel format
- 3 months of analyst support
Product Code: 71555
TABLE OF CONTENTS
1 EXECUTIVE SUMMARY & KEY FINDINGS
2 REPORT OFFERS
3 INTRODUCTION
- 3.1 Study Assumptions & Market Definition
- 3.2 Scope of the Study
- 3.3 Research Methodology
4 KEY INDUSTRY TRENDS
- 4.1 Bicycle Sales
- 4.2 GDP Per Capita
- 4.3 Inflation Rate
- 4.4 Adoption Rate Of E-bikes
- 4.5 Percent Population/commuters With 5-15 Km Daily Travel Distance
- 4.6 Bicycle Rental
- 4.7 E-bike Battery Price
- 4.8 Price Chart Of Different Battery Chemistry
- 4.9 Hyper-local Delivery
- 4.10 Dedicated Bicycle Lanes
- 4.11 Number Of Trekkers
- 4.12 Battery Charging Capacity
- 4.13 Traffic Congestion Index
- 4.14 Regulatory Framework
- 4.15 Value Chain & Distribution Channel Analysis
5 MARKET SEGMENTATION (includes market size in Value in USD and Volume, Forecasts up to 2029 and analysis of growth prospects)
- 5.1 Propulsion Type
- 5.1.1 Pedal Assisted
- 5.1.2 Speed Pedelec
- 5.1.3 Throttle Assisted
- 5.2 Application Type
- 5.2.1 Cargo/Utility
- 5.2.2 City/Urban
- 5.2.3 Trekking
- 5.3 Battery Type
- 5.3.1 Lead Acid Battery
- 5.3.2 Lithium-ion Battery
- 5.3.3 Others
6 COMPETITIVE LANDSCAPE
- 6.1 Key Strategic Moves
- 6.2 Market Share Analysis
- 6.3 Company Landscape
- 6.4 Company Profiles
- 6.4.1 Alphavector (India) Pvt Ltd
- 6.4.2 Being Human
- 6.4.3 Cultsport
- 6.4.4 EMotorad
- 6.4.5 Hero Cycles Limited
- 6.4.6 Motovolt
- 6.4.7 Nibe E-motor Limited
- 6.4.8 SJ Electric Vehicles Pvt. Ltd (Polarity Smart Bikes)
- 6.4.9 Stryder
- 6.4.10 TREK BICYCLE INDIA PRIVATE LIMITED
- 6.4.11 Tru E Bikes Pvt. Ltd
7 KEY STRATEGIC QUESTIONS FOR E BIKES CEOS
8 APPENDIX
- 8.1 Global Overview
- 8.1.1 Overview
- 8.1.2 Porter's Five Forces Framework
- 8.1.3 Global Value Chain Analysis
- 8.1.4 Market Dynamics (DROs)
- 8.2 Sources & References
- 8.3 List of Tables & Figures
- 8.4 Primary Insights
- 8.5 Data Pack
- 8.6 Glossary of Terms
Have a question?


SELECT AN OPTION
Have a question?
Questions? Please give us a call or visit the contact form.