
Need help finding what you are looking for?
Contact Us
PUBLISHER: Mordor Intelligence | PRODUCT CODE: 1683791

PUBLISHER: Mordor Intelligence | PRODUCT CODE: 1683791
Asia-Pacific E-bike - Market Share Analysis, Industry Trends & Statistics, Growth Forecasts (2025 - 2029)
PUBLISHED:
PAGES: 220 Pages
DELIVERY TIME: 2-3 business days
SELECT AN OPTION
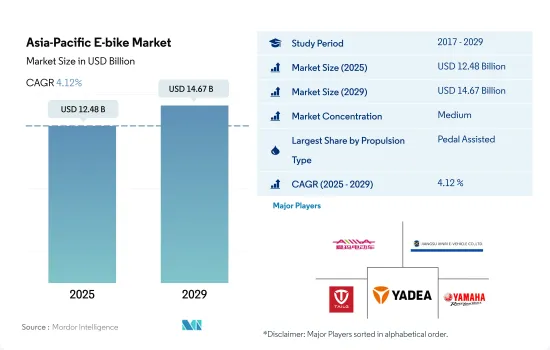
The Asia-Pacific E-bike Market size is estimated at 12.48 billion USD in 2025, and is expected to reach 14.67 billion USD by 2029, growing at a CAGR of 4.12% during the forecast period (2025-2029).
PROPULSION SEGMENT MARKET OVERVIEW
- Individuals' improved fitness consciousness, greater environmental concern, increased traffic congestion, and government attempts to promote cycling are the key growth factors in this industry. China and Japan are two of the most prominent countries where e-bikes have gained popularity. Some key reasons for consumers adopting and riding e-bikes in Asia-Pacific are health benefits, traffic congestion avoidance, environmental benefits, and rising demand for e-bikes as sports equipment.
- During the COVID-19 pandemic, bicycle demand increased in South Korea. Bicycles are used for transportation and other activities such as sports, exercise, and trekking. The increased public awareness of the health benefits of pedaling is driving demand. Consumers want safer, more comfortable, and ecologically responsible vehicles, which may inspire the associated businesses to develop a range of innovative cycle pedal items. The rise of shared mobility companies has increased the demand for such vehicles for daily travel.
- Rising youth interest in sports like uphill cycling and increased knowledge of the benefits of a healthy and active lifestyle are projected to drive market demand over the coming years. A pedal-assisted bicycle is useful for short distances, but the speed pedelec is expected to be the most convenient option in the future as its power and speed capabilities improve.
ASIA-PACIFIC COUNTRY LEVEL MARKET OVERVIEW
- A growing number of cycling events, as well as favorable government and employer initiatives, are likely to drive the industry under consideration. Numerous governing bodies in Asia-Pacific promote road racing, touring and leisure cycling, track racing, off-road racing events, and mountain cycling events, such as The Cycling Federation of India and The Chinese Cycling Association.
- Bicycle sales first fell owing to the nationwide shutdown of offline retailers due to COVID-19 pandemic regulations. However, demand for bicycles has recently grown, with consumers preferring to shun public transit due to fear of getting the virus. As consumers become more health-conscious, bicycles are increasingly viewed as a more trustworthy and healthful method of transportation, which encourages sales. E-bikes, on the other hand, are progressively gaining market share as battery prices fall and client preferences shift. Sales are also expanding at a faster rate, with over 50 companies offering a diverse selection of models. Such variables are expected to have an impact on market growth.
- China and Japan are two of the most prominent countries where e-bikes have gained popularity. Some of the key reasons for adopting and driving e-bikes in Asia-Pacific are health benefits, traffic congestion avoidance, environmental benefits, and rising demand for e-bikes as sports equipment. In recent years, health and environmental quality, as well as the concept of smart cities, have arisen as drivers of bicycles increased. Nonetheless, expansion driven by these factors has been hampered by the cycle-unfriendly environment and infrastructure in most cities.
Asia-Pacific E-bike Market Trends
China's massive adoption rate showcases the vast market potential and cultural integration of e-bikes.
- The Asia-Pacific region is dominating the global e-bike sales, mainly due to the two-wheeler culture in the region, growing government support in the form of tax incentives for EVs, hefty taxes on conventional, fuel-based vehicles, expansion of the e-commerce and food delivery systems, and rapid urbanization. E-bikes also offer a good user experience with additional benefits, such as the non-requirement of driving licenses, insurance, inspections, and parking permits.
- In Asia-Pacific, bike commuting has long been the primary transportation mode in China, Japan, India, and several Southeast Asian countries. The electrification in China and Japan led to the total number of e-bikes reaching 150 million in the region, which is expected to rise in the near future. The pedal-assisted e-bike segment is dominating in the Asia-Pacific region as many countries limit e-bikes in terms of speed and power. Most of these are limited to 250 W motor power and a speed of 25 kmph. The governments in some countries have set regulations for power limits in throttle-assisted electric bikes, resulting in them accounting for a low market share in unit sales.
- The e-bike market, especially for pedal-assist e-bikes in China and Japan, is reaching a saturation point as unit sales growth becomes stagnant. However, Indonesia, India, Singapore, and South Korea are expected to witness significant growth in the near future, driven by many strategic measures taken by domestic two-wheeler and low-speed electric vehicle producers and the government's plans for rapid electrification of two-wheelers. The growth in shared e-bike systems in India, Singapore, and Thailand is further supporting the growth of the e-bike market in the region.
Varied trends with Japan stable and high, and China and India growing, indicating diverse commuting patterns and infrastructure evolution.
- Asia-Pacific is made up of several countries with a decent bicycle population, including China, India, and Japan. The demand for bicycles has grown recently among the countries in the region. People in Asia-Pacific are using bicycles for short commutes (up to 15 km) or trips to neighboring locations like businesses and workplaces. With 5 to 15 kilometers of travel per day, China has the highest percentage of daily commuters in the Asia-Pacific region.
- Numerous people discovered bicycles to be a secure, isolating means of transportation after the COVID-19 outbreak, which forced the closing of gyms and public transportation in various Asia-Pacific countries. People also decided to exercise during the pandemic by bicycling or going on weekend runs to nearby places, which increased the number of commuters with a daily travel distance of 5 to 15 kilometers in 2021 over 2020 across the region. Consumers who commuted 5 to 15 kilometers were also attracted to the introduction of e-bikes with cutting-edge battery packs that offered an increased range of up to 40 to 45 kilometers.
- The removal of COVID restrictions and the opening of offices and businesses across Asia-Pacific contributed to the growth of bicycle users. Many people regularly commute by bicycle to their workplaces and enterprises within 5 to 15 kilometers. Bicycle commuting is becoming more and more common, largely because it is healthy, carbon-free, fuel-efficient, and saves traffic time in countries like China and Japan. During the forecast period, these factors are anticipated to promote cyclists journeying 5 to 15 km across Asia-Pacific.
Asia-Pacific E-bike Industry Overview
The Asia-Pacific E-bike Market is moderately consolidated, with the top five companies occupying 44.33%. The major players in this market are Aima Technology Group Co. Ltd, Jiangsu Xinri E-Vehicle Co. Ltd, Shenzhen TAILG Technology Group Co., LTD., Yadea Group Holdings Ltd. and Yamaha Bicycles (sorted alphabetically).
Additional Benefits:
- The market estimate (ME) sheet in Excel format
- 3 months of analyst support
Product Code: 93672
TABLE OF CONTENTS
1 EXECUTIVE SUMMARY & KEY FINDINGS
2 REPORT OFFERS
3 INTRODUCTION
- 3.1 Study Assumptions & Market Definition
- 3.2 Scope of the Study
- 3.3 Research Methodology
4 KEY INDUSTRY TRENDS
- 4.1 Bicycle Sales
- 4.2 GDP Per Capita
- 4.3 Inflation Rate
- 4.4 Adoption Rate Of E-bikes
- 4.5 Percent Population/commuters With 5-15 Km Daily Travel Distance
- 4.6 Bicycle Rental
- 4.7 E-bike Battery Price
- 4.8 Price Chart Of Different Battery Chemistry
- 4.9 Hyper-local Delivery
- 4.10 Dedicated Bicycle Lanes
- 4.11 Number Of Trekkers
- 4.12 Battery Charging Capacity
- 4.13 Traffic Congestion Index
- 4.14 Regulatory Framework
- 4.15 Value Chain & Distribution Channel Analysis
5 MARKET SEGMENTATION (includes market size in Value in USD and Volume, Forecasts up to 2029 and analysis of growth prospects)
- 5.1 Propulsion Type
- 5.1.1 Pedal Assisted
- 5.1.2 Speed Pedelec
- 5.1.3 Throttle Assisted
- 5.2 Application Type
- 5.2.1 Cargo/Utility
- 5.2.2 City/Urban
- 5.2.3 Trekking
- 5.3 Battery Type
- 5.3.1 Lead Acid Battery
- 5.3.2 Lithium-ion Battery
- 5.3.3 Others
- 5.4 Country
- 5.4.1 Australia
- 5.4.2 China
- 5.4.3 India
- 5.4.4 Japan
- 5.4.5 New Zealand
- 5.4.6 South Korea
- 5.4.7 Rest-of-APAC
6 COMPETITIVE LANDSCAPE
- 6.1 Key Strategic Moves
- 6.2 Market Share Analysis
- 6.3 Company Landscape
- 6.4 Company Profiles
- 6.4.1 Aima Technology Group Co. Ltd
- 6.4.2 Cycling Sports Group, Inc.
- 6.4.3 Giant Manufacturing Co.
- 6.4.4 Hero Cycles Limited
- 6.4.5 Jiangsu Xinri E-Vehicle Co. Ltd
- 6.4.6 Merida Industry Co Ltd
- 6.4.7 Riese & Muller
- 6.4.8 Shenzhen TAILG Technology Group Co., LTD.
- 6.4.9 Tianjin Fuji-Ta Bicycle Co. Ltd.
- 6.4.10 Trek Bicycle Corporation
- 6.4.11 Yadea Group Holdings Ltd.
- 6.4.12 Yamaha Bicycles
7 KEY STRATEGIC QUESTIONS FOR E BIKES CEOS
8 APPENDIX
- 8.1 Global Overview
- 8.1.1 Overview
- 8.1.2 Porter's Five Forces Framework
- 8.1.3 Global Value Chain Analysis
- 8.1.4 Market Dynamics (DROs)
- 8.2 Sources & References
- 8.3 List of Tables & Figures
- 8.4 Primary Insights
- 8.5 Data Pack
- 8.6 Glossary of Terms
Have a question?


SELECT AN OPTION
Have a question?
Questions? Please give us a call or visit the contact form.