
Need help finding what you are looking for?
Contact Us
PUBLISHER: Mordor Intelligence | PRODUCT CODE: 1683204

PUBLISHER: Mordor Intelligence | PRODUCT CODE: 1683204
United States Biofertilizer - Market Share Analysis, Industry Trends & Statistics, Growth Forecasts (2025 - 2030)
PUBLISHED:
PAGES: 138 Pages
DELIVERY TIME: 2-3 business days
SELECT AN OPTION
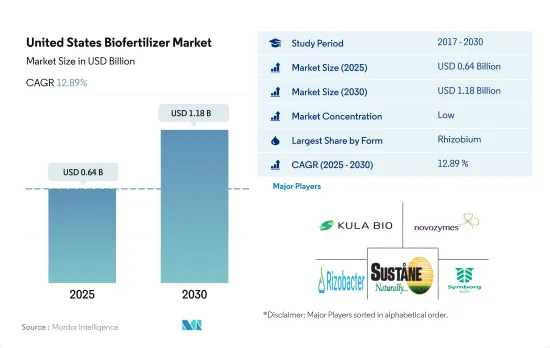
The United States Biofertilizer Market size is estimated at 0.64 billion USD in 2025, and is expected to reach 1.18 billion USD by 2030, growing at a CAGR of 12.89% during the forecast period (2025-2030).
- Biofertilizers are organic substances with living microorganisms that promote plant growth. The biofertilizer market value increased by about 49.1% between 2017 and 2022, which was attributed to various reasons like increasing awareness among farmers, increasing the overall registered organic farms in the United States, and a shift in demand for organically or sustainably grown commodities.
- An overall increasing trend is observed in the biofertilizer market both in terms of value and volume due to increasing demand for biofertilizers in the country.
- Rhizobium biofertilizer has the largest market share compared to other biofertilizers. It is anticipated to increase its market share further between 2023 and 2029.
- Mycorrhiza occupied the second-largest market share in the biofertilizer market, followed by Rhizobium, and accounted for about 26.4% of the total market value in 2022. It was followed by Azospirillum, which accounted for 24.4% of the total biofertilizer market value in 2022.
- Continuous research is being conducted to develop strains that are biotic/abiotic stress tolerant. For instance, under salinity stress, Rhizobium trifolii inoculated with Trifoliumalexandrinum showed increased biomass and nodulation. Positive research findings and the presence of active companies in this segment are likely to drive the biofertilizer market to a large extent between 2023 and 2029.
- The increasing awareness about the overuse of fertilizers among farmers and the government initiatives to support sustainable agricultural practices and organic farming resulted in a growing demand for biofertilizers. Therefore, the US biofertilizer market is anticipated to increase between 2023 and 2029.
United States Biofertilizer Market Trends
Increase in organic area, particularly in row crops, due to country's laws and regulations
- In 2021, the area under organic agricultural farming in the United States was 623 thousand hectares. Organic agriculture in the United States has increased significantly in the previous 20 years, mostly due to the introduction of particular laws and regulations. The number of organic farms and ranches in California was 3,061 in 2021, the largest number of certified organic farms in the United States. There were over 1,125 certified organic farms in Pennsylvania. Nearly 15,548 thousand certified organic farms in operation used cropland in 2019, while 7,139 thousand farms operated pastureland and rangeland. The sales value of crops, including those from nurseries and greenhouses, amounted to nearly USD 5.8 billion.
- Row crops dominated organic farming in the nation. In 2021, they accounted for about 71.8% of all organic cropland. The production of cereal crops predominates the country's agricultural sector. The main cereals include maize, wheat, rice, and millet. The consumption of organic products has become popular among US consumers who increasingly choose to eat organic foods because of their various health benefits.
- There is an increasing trend in the overall organic horticultural crop cultivation area, from 112.9 thousand hectares in 2017 to 156.1 thousand hectares in 2021. Regarding domestic production in 2021, the top five fruits and vegetables were apples (31.1%), strawberries (9.5%), oranges (6.9%), romaine lettuce (6.7%), and potatoes (6.2%). In the case of trade, the most imported produce was bananas (53.1%), avocados (7.7%), mangoes (5.8%), blueberries (5.0%), and squashes (4.3%), while the most exported were apples (80.0%), pears (14.4%), cherries (4.0%), dried onions (1.5%), and potatoes (0.2%).
Growing demand for organic produce especially in the fruits and vegetables sector, rise in per capita spending on organic food
- The United States is one of the largest organic product consumers in the world. As of 2020, the total sales of organic food products in the country accounted for USD 51.6 billion, according to the Nutrition Business Journal (NBJ, 2021). The United States had the largest per capita spending on organic products in the North American region, worth USD 186.7 in 2021.
- Organic fresh fruits and vegetables have been the leading category of organic food since the establishment of the organic food retail industry. In 2020, retail sales for these organic products were valued at USD 20.0 billion, showing a growing demand for organic produce. The demand for organic fresh fruits and vegetables has steadily risen over the past two decades. Organic food sales are rising due to growing consumer awareness, especially among high-income consumers. The most in-demand organic categories include basic foods like eggs, dairy, fruits, and vegetables.
- Organic food preferences vary by demographic and region. Younger people aged between 18 and 29 are more likely to seek organic products (over 50%) compared to older people aged 65 and above. Income and region also play a role, with 42% of those with under USD 30,000 income and 49% of those with over USD 75.0 thousand seeking organic products.
- The per capita spending on organic products is increasing in the country, recording a CAGR of 5.2% between 2017 and 2021. The growing demand for organic products is creating opportunities for US organic producers to tap into high-value markets both domestically and abroad. The price premium associated with organic products is one of the major limiting factors for organic food consumption for low-income consumers.
United States Biofertilizer Industry Overview
The United States Biofertilizer Market is fragmented, with the top five companies occupying 22.98%. The major players in this market are Kula Bio Inc., Novozymes, Rizobacter, Sustane Natural Fertilizer Inc. and Symborg Inc. (sorted alphabetically).
Additional Benefits:
- The market estimate (ME) sheet in Excel format
- 3 months of analyst support
Product Code: 64273
TABLE OF CONTENTS
1 EXECUTIVE SUMMARY & KEY FINDINGS
2 REPORT OFFERS
3 INTRODUCTION
- 3.1 Study Assumptions & Market Definition
- 3.2 Scope of the Study
- 3.3 Research Methodology
4 KEY INDUSTRY TRENDS
- 4.1 Area Under Organic Cultivation
- 4.2 Per Capita Spending On Organic Products
- 4.3 Regulatory Framework
- 4.3.1 United States
- 4.4 Value Chain & Distribution Channel Analysis
5 MARKET SEGMENTATION (includes market size in Value in USD and Volume, Forecasts up to 2030 and analysis of growth prospects)
- 5.1 Form
- 5.1.1 Azospirillum
- 5.1.2 Azotobacter
- 5.1.3 Mycorrhiza
- 5.1.4 Phosphate Solubilizing Bacteria
- 5.1.5 Rhizobium
- 5.1.6 Other Biofertilizer
- 5.2 Crop Type
- 5.2.1 Cash Crops
- 5.2.2 Horticultural Crops
- 5.2.3 Row Crops
6 COMPETITIVE LANDSCAPE
- 6.1 Key Strategic Moves
- 6.2 Market Share Analysis
- 6.3 Company Landscape
- 6.4 Company Profiles (includes Global Level Overview, Market Level Overview, Core Business Segments, Financials, Headcount, Key Information, Market Rank, Market Share, Products and Services, and Analysis of Recent Developments).
- 6.4.1 AgroLiquid
- 6.4.2 Indogulf BioAg LLC (Biotech Division of Indogulf Company)
- 6.4.3 Koppert Biological Systems Inc.
- 6.4.4 Kula Bio Inc.
- 6.4.5 Lallemand Inc.
- 6.4.6 Novozymes
- 6.4.7 Rizobacter
- 6.4.8 Sustane Natural Fertilizer Inc.
- 6.4.9 Symborg Inc.
- 6.4.10 The Andersons Inc.
7 KEY STRATEGIC QUESTIONS FOR AGRICULTURAL BIOLOGICALS CEOS
8 APPENDIX
- 8.1 Global Overview
- 8.1.1 Overview
- 8.1.2 Porter's Five Forces Framework
- 8.1.3 Global Value Chain Analysis
- 8.1.4 Market Dynamics (DROs)
- 8.2 Sources & References
- 8.3 List of Tables & Figures
- 8.4 Primary Insights
- 8.5 Data Pack
- 8.6 Glossary of Terms
Have a question?


SELECT AN OPTION
Have a question?
Questions? Please give us a call or visit the contact form.