
Need help finding what you are looking for?
Contact Us
PUBLISHER: Mordor Intelligence | PRODUCT CODE: 1687729

PUBLISHER: Mordor Intelligence | PRODUCT CODE: 1687729
Africa Biofertilizer - Market Share Analysis, Industry Trends & Statistics, Growth Forecasts (2025 - 2030)
PUBLISHED:
PAGES: 151 Pages
DELIVERY TIME: 2-3 business days
SELECT AN OPTION
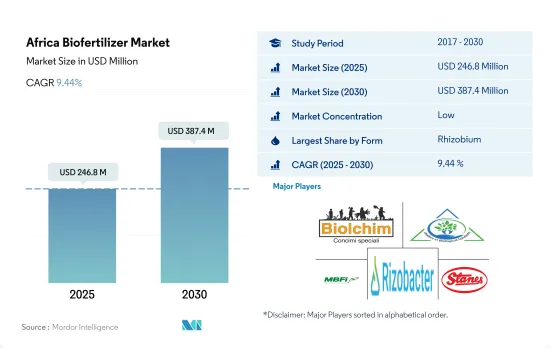
The Africa Biofertilizer Market size is estimated at 246.8 million USD in 2025, and is expected to reach 387.4 million USD by 2030, growing at a CAGR of 9.44% during the forecast period (2025-2030).
- Biofertilizers are living microorganisms that improve plant nutrition by mobilizing or increasing nutrient availability in soils. Mycorrhiza, Azospirillum, Azotobacter, Rhizobium, and phosphate-solubilizing bacteria are the most frequent microorganisms used as biofertilizers in agriculture.
- Among these biofertilizers, Rhizobium is most widely used in Africa, accounting for 45.6% of the market in 2022 and valued at USD 87.5 million. Rhizobium is the most prominent nitrogen-fixing bacteria that live in the root nodules of leguminous plants and has a symbiotic relationship with plants.
- Azospirillum accounted for the second-largest market share, valued at USD 43.8 million in 2022. Azospirillum-based biofertilizers promote plant vegetative growth by substituting 25-30% of plant nitrogen requirements.
- Row crops dominated the biofertilizer market, valued at about USD 146.8 million and accounting for 76.5% of the consumption share in 2022, followed by horticultural crops, valued at USD 30.5 million. The market value of biofertilizers in row crops is constantly expanding. It increased by about 17.8% between 2017 and 2021. It is anticipated to increase by about 69.6% by the end of the forecast period, reaching USD 270.0 million.
- The application of biofertilizers can reduce the use of chemical nitrogen fertilizers and the overall cost of cultivation. The demand for organic products in domestic and international markets is increasing, thus driving the demand for biofertilizers in the region.
- As the demand for organically cultivated food grows in many African countries such as Egypt, Nigeria, and South Africa, Africa is a significant market for biofertilizers. During the historical period (2017-2022), the region's organically cultivated area expanded slightly, from 1.1 million hectares in 2017 to 1.3 million hectares in 2022. During the same period, the African biofertilizer market grew by 6.9%. Major cereal crops are produced in the region, like maize, wheat, and corn.
- Rhizobium is the most often used biofertilizer in African countries, accounting for 45.6% of the market in 2022 and worth USD 87.6 million. Rhizobium is the most prominent nitrogen-fixing bacterium that resides in the root nodules of leguminous plants and has a symbiotic connection with plants.
- In the Rest of Africa, in terms of area, Tunisia was the region's largest organic producer in 2021. Around 60 of the 250 organic product categories cultivated in Tunisia are exported, mostly olive oil, but also dates, aromatic and medicinal herbs, and certain vegetables and fruits. Tunisia ranks 30th in the world and first in Africa in terms of organic farming area certification, despite its small size.
- The major countries with organic agricultural acreage include Egypt and South Africa accounting for 5.0% together, with 45.1 thousand hectares and 12.6 thousand hectares, respectively. However, the Rest of Africa accounted for 95.0% of total organic agricultural acreage in Africa, with 1.2 million hectares.
- The demand for biofertilizers is expected to rise during the forecast period owing to rising consumer interest in organic products. Farmers are becoming more aware of the disadvantages of relying on chemical inputs in agriculture and increasing organic acreage, which may also drive the market.
Africa Biofertilizer Market Trends
8,34,000 organic producers are in the region's organic sector with Tunisia is having more organic land
- Organic farming takes two forms in Africa: certified and uncertified. Only 0.2% of organic agricultural land may be certified in Africa. However, most organic farmers are not certified. Many certified farmers aim to export their products, with the majority being exported to the European Union, Africa's largest agricultural market. In contrast, non-certified organic farmers aim to sell their produce from home. In 2022, the area of organic agricultural land in Africa was over 1.2 million ha, representing 9.0% of the total organic agricultural area worldwide.
- In the African region, key organic crops include nuts, olives, coffee, cocoa, oilseeds, and cotton. Cash crops occupied a major share of organic agricultural land, accounting for 63.2% in 2022, with 817.4 thousand hectares. Row crops held the second-largest share of organic acreage, i.e., about 25.6%, accounting for 331.2 thousand hectares in the same year. Horticultural crops accounted for 11.2% of the organic acreage, with 144.9 thousand ha in 2022.
- In 2020, there were nearly 834,000 organic producers in Africa. The countries with the highest number of organic producers were Ethiopia (almost 220,000), Tanzania (nearly 149,000), and Uganda (over 139,000).
- In terms of area, Tunisia has the largest organic area under cultivation (more than 290,000 ha in 2020). The island state of Sao Tome and Principe has the region's highest percentage of land devoted to organic farming, i.e., 20.7%.
Per capita spending on organic product predominant in Egypt, South Africa, and Nigeria countries
- Africa's per capita income is consistently increasing, encouraging people to spend more on nutritious food. Organic foods and beverages are gaining more shelf space in the region.
- In Africa, consumption of organic products increased significantly, especially in Egypt, South Africa, and Nigeria. In 2021, the per capita consumption of organic products accounted for USD 55.5 in Egypt, followed by South Africa with USD 7.1. Within Africa, Uganda was an early adopter of organic farming and successfully established itself as a significant producer and exporter of organic products.
- In the African region, the commonly consumed organic products include fresh vegetables and fruits. Significant efforts have been made to mainstream organic agriculture into policy, national extension systems, marketing, and value chain development, thus gaining consumer attention.
- With the increasing per capita consumption of beverages, primarily fruit juices, growing health awareness, and consumers shifting toward organic food and drinks that do not contain chemical ingredients, the demand for organic food is expected to increase between 2023 and 2029.
- Though organic foods currently account for a small portion of the food industry, they are gaining popularity among African consumers. However, low income levels, lack of organic standards, and other infrastructure for local market certification may restrain the growth of the organic food market in the region.
Africa Biofertilizer Industry Overview
The Africa Biofertilizer Market is fragmented, with the top five companies occupying 2.49%. The major players in this market are Biolchim SPA, IPL Biologicals Limited, Microbial Biological Fertilizers International, Rizobacter and T. Stanes and Company Limited (sorted alphabetically).
Additional Benefits:
- The market estimate (ME) sheet in Excel format
- 3 months of analyst support
Product Code: 64721
TABLE OF CONTENTS
1 EXECUTIVE SUMMARY & KEY FINDINGS
2 REPORT OFFERS
3 INTRODUCTION
- 3.1 Study Assumptions & Market Definition
- 3.2 Scope of the Study
- 3.3 Research Methodology
4 KEY INDUSTRY TRENDS
- 4.1 Area Under Organic Cultivation
- 4.2 Per Capita Spending On Organic Products
- 4.3 Regulatory Framework
- 4.3.1 Egypt
- 4.3.2 Iran
- 4.3.3 Nigeria
- 4.3.4 South Africa
- 4.4 Value Chain & Distribution Channel Analysis
5 MARKET SEGMENTATION (includes market size in Value in USD and Volume, Forecasts up to 2030 and analysis of growth prospects)
- 5.1 Form
- 5.1.1 Azospirillum
- 5.1.2 Azotobacter
- 5.1.3 Mycorrhiza
- 5.1.4 Phosphate Solubilizing Bacteria
- 5.1.5 Rhizobium
- 5.1.6 Other Biofertilizers
- 5.2 Crop Type
- 5.2.1 Cash Crops
- 5.2.2 Horticultural Crops
- 5.2.3 Row Crops
- 5.3 Country
- 5.3.1 Egypt
- 5.3.2 Nigeria
- 5.3.3 South Africa
- 5.3.4 Rest of Africa
6 COMPETITIVE LANDSCAPE
- 6.1 Key Strategic Moves
- 6.2 Market Share Analysis
- 6.3 Company Landscape
- 6.4 Company Profiles (includes Global Level Overview, Market Level Overview, Core Business Segments, Financials, Headcount, Key Information, Market Rank, Market Share, Products and Services, and Analysis of Recent Developments).
- 6.4.1 Atlantica Agricola
- 6.4.2 Biolchim SPA
- 6.4.3 IPL Biologicals Limited
- 6.4.4 Mapleton Agri Biotec Pt. Ltd
- 6.4.5 Microbial Biological Fertilizers International
- 6.4.6 Rizobacter
- 6.4.7 T. Stanes and Company Limited
- 6.4.8 Valent Biosciences LLC
- 6.4.9 Vegalab SA
7 KEY STRATEGIC QUESTIONS FOR AGRICULTURAL BIOLOGICALS CEOS
8 APPENDIX
- 8.1 Global Overview
- 8.1.1 Overview
- 8.1.2 Porter's Five Forces Framework
- 8.1.3 Global Value Chain Analysis
- 8.1.4 Market Dynamics (DROs)
- 8.2 Sources & References
- 8.3 List of Tables & Figures
- 8.4 Primary Insights
- 8.5 Data Pack
- 8.6 Glossary of Terms
Have a question?


SELECT AN OPTION
Have a question?
Questions? Please give us a call or visit the contact form.