
Need help finding what you are looking for?
Contact Us
PUBLISHER: Mordor Intelligence | PRODUCT CODE: 1687724

PUBLISHER: Mordor Intelligence | PRODUCT CODE: 1687724
Rhizobium - Market Share Analysis, Industry Trends & Statistics, Growth Forecasts (2025 - 2030)
PUBLISHED:
PAGES: 280 Pages
DELIVERY TIME: 2-3 business days
SELECT AN OPTION
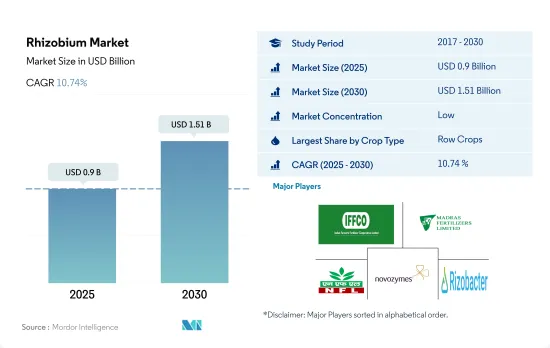
The Rhizobium Market size is estimated at 0.9 billion USD in 2025, and is expected to reach 1.51 billion USD by 2030, growing at a CAGR of 10.74% during the forecast period (2025-2030).
- The specific interaction between rhizobia and legume roots results in the formation of a highly regulated process termed modulation, which converts atmospheric nitrogen into an assimilable plant nutrient. This ability provides the basis for the use of bacterial inoculants in field crop production. Row crops dominated the mycorrhiza market in 2022, accounting for around 69.7% of market value. Globally, the most important row crops are barley, maize, wheat, rapeseed, rye, sunflower, soybean, and rice.
- The market for rhizobium-based biofertilizers in horticultural crops is expected to be worth USD 137.2 million, with 4.9 thousand metric tons used in 2022. Rhizobium strains colonize the roots of tomato and pepper plants to encourage growth at various stages of production, increasing seedling and fruit yield and quality. It is also utilized in greenhouse culture, such as tomato and capsicum farming, as well as other horticultural fruit growing.
- Coffee, tea, cocoa, cotton, sugarcane, rapeseed, sunflower, and tobacco are some of the major cash crops grown globally. Cash crops accounted for USD 68.7 million in the market value of rhizobium-based biofertilizers in 2022. North America dominated the market for cash crops and accounted for about USD 52.2 million in 2022.
- Rhizobium inoculation can provide plant nitrogen requirements while decreasing the demand for inorganic nitrogen fertilizer. Effective rhizobium inoculation can deliver up to 50-70% of the total nitrogen required to boost yields. Rhizobium also generates vitamins, amino acids, siderophores, auxins, and nitrogen fixation.
- Owing to the above-mentioned characteristics and the increase in the application of rhizobium-based fertilizers, the market is anticipated to grow between 2023 and 2029.
- Rhizobium is the most important nitrogen-fixing bacterium that exists in a symbiotic relationship with plants and lives in the root nodules of leguminous plants. Rhizobium is the second most consumed among biofertilizers globally and accounted for a share of 25.4% in the year 2022.
- It has been estimated that 40-250 kg of nitrogen per hectare per year is fixed by different legume crops by the microbial activities of rhizobium. The European Union is planning to make the transition toward sustainable plant protein production through the expansion of the area under leguminous crop cultivation.
- North America dominated the global rhizobium market with a market share of 52.7% in 2022. Row crops dominate the rhizobium biofertilizer market in North America, and they accounted for about 62.4% of the market value in 2022. The dominance of row crops is due to rhizobium's symbiotic association with leguminous crops, which come under row crops. Due to the large cultivation of row crops in the region, their market value is anticipated to increase, registering a CAGR of 13.0% between 2023 and 2029.
- The requirement for additional application of nitrogen in non-leguminous crops is high in order to enhance the yield potential of the crops. The usage of biological nitrogen-fixing bacteria can increase the production of non-leguminous crops like cereals, fruits, and vegetables. Row crops dominate the rhizobium biofertilizer market and accounted for about 69.8% of the market value in 2022, owing to the large area under the cultivation of field crops. The application of rhizobium biofertilizers in fruit and vegetable crops is known to increase nutrient availability and produce required plant hormones.
Global Rhizobium Market Trends
Organic production is at an all-time high in North America and Europe, due to the increasing awareness and Government initiatives.
- Organic agriculture has emerged as a significant contributor to sustainable food systems, with 187 countries practicing it globally. As of 2021, there was 72.3 million ha of organic agricultural land worldwide, with an average increase of 2.9% across all regions from 2018 to 2021. Organic arable land accounted for 14.4 million ha, representing 19.9% of the total organic agricultural land.
- The strongest markets for organic farming are North America and Europe, accounting for 41.0% of the global organic arable land. In 2022, Europe had 6.5 million ha of organic arable land, equivalent to 44.1% of the overall organic arable agricultural area. The most significant crops grown organically in North America and Europe are apples, strawberries, cereals, and olives.
- Developing countries in Asia-Pacific are also joining the organic agriculture movement and becoming self-sufficient in producing and providing fresh organic produce to meet their domestic demand. The trend of organic farming is gaining momentum in Asia-Pacific, with the region recording an 18.8% increase in organic arable land from 2017 to 2022. The major initiatives by governments in the region also play a vital role in the growing trend of organic farming. For example, Japan's Basic Plan for Food, Agriculture, and Rural Areas aims to triple the number of organic farmers and lands by 2030.
- The growth of organic agriculture is driven by the rising awareness of the benefits of organic farming, such as promoting soil health, reducing environmental impacts, and producing healthier food.
Per capita spending of organic food majorly observed in United States and Germany, attributed to the consumer demand for healthier and sustainable food
- The organic food market experienced significant growth in the past few years, with global sales reaching USD 120.6 billion in 2020, up from USD 70.8 billion in 2012. The trend toward organic food is being driven by several factors, such as increasing consumer demand for healthier, more sustainable food options and a growing awareness of the environmental impact of conventional agriculture. The global organic food market is expected to continue its growth trend over the coming years.
- According to a survey conducted by the Organic Trade Association in 2021, sales of organic fruits and vegetables increased by around 4.5% in the same year, accounting for 15% of the overall organic sales. North America dominates the market in terms of average spending on organic products, with per capita spending in the United States reaching USD 186.7 in 2021, the highest among all North American countries. Europe is also expected to experience significant growth in the organic food market, with Germany accounting for the highest per capita spending of USD 75.6 in 2021.
- While the organic food market is still dominated by developed countries with high consumer disposable incomes, it is also expected to grow in developing nations. For example, the increasing number of working-class people in the Asia-Pacific region may contribute to the market's expansion due to the growing availability and affordability of organic food products.
Rhizobium Industry Overview
The Rhizobium Market is fragmented, with the top five companies occupying 28.14%. The major players in this market are Indian Farmers Fertiliser Cooperative Limited, Madras Fertilizers Limited, National Fertilizers Limited, Novozymes and Rizobacter (sorted alphabetically).
Additional Benefits:
- The market estimate (ME) sheet in Excel format
- 3 months of analyst support
Product Code: 64662
TABLE OF CONTENTS
1 EXECUTIVE SUMMARY & KEY FINDINGS
2 REPORT OFFERS
3 INTRODUCTION
- 3.1 Study Assumptions & Market Definition
- 3.2 Scope of the Study
- 3.3 Research Methodology
4 KEY INDUSTRY TRENDS
- 4.1 Area Under Organic Cultivation
- 4.2 Per Capita Spending On Organic Products
- 4.3 Regulatory Framework
- 4.3.1 Argentina
- 4.3.2 Australia
- 4.3.3 Brazil
- 4.3.4 Canada
- 4.3.5 China
- 4.3.6 Egypt
- 4.3.7 France
- 4.3.8 Germany
- 4.3.9 India
- 4.3.10 Indonesia
- 4.3.11 Italy
- 4.3.12 Japan
- 4.3.13 Mexico
- 4.3.14 Netherlands
- 4.3.15 Nigeria
- 4.3.16 Philippines
- 4.3.17 Russia
- 4.3.18 South Africa
- 4.3.19 Spain
- 4.3.20 Thailand
- 4.3.21 Turkey
- 4.3.22 United Kingdom
- 4.3.23 United States
- 4.3.24 Vietnam
- 4.4 Value Chain & Distribution Channel Analysis
5 MARKET SEGMENTATION (includes market size in Value in USD and Volume, Forecasts up to 2030 and analysis of growth prospects)
- 5.1 Crop Type
- 5.1.1 Cash Crops
- 5.1.2 Horticultural Crops
- 5.1.3 Row Crops
- 5.2 Region
- 5.2.1 Africa
- 5.2.1.1 By Country
- 5.2.1.1.1 Egypt
- 5.2.1.1.2 Nigeria
- 5.2.1.1.3 South Africa
- 5.2.1.1.4 Rest of Africa
- 5.2.2 Asia-Pacific
- 5.2.2.1 By Country
- 5.2.2.1.1 Australia
- 5.2.2.1.2 China
- 5.2.2.1.3 India
- 5.2.2.1.4 Indonesia
- 5.2.2.1.5 Japan
- 5.2.2.1.6 Philippines
- 5.2.2.1.7 Thailand
- 5.2.2.1.8 Vietnam
- 5.2.2.1.9 Rest of Asia-Pacific
- 5.2.3 Europe
- 5.2.3.1 By Country
- 5.2.3.1.1 France
- 5.2.3.1.2 Germany
- 5.2.3.1.3 Italy
- 5.2.3.1.4 Netherlands
- 5.2.3.1.5 Russia
- 5.2.3.1.6 Spain
- 5.2.3.1.7 Turkey
- 5.2.3.1.8 United Kingdom
- 5.2.3.1.9 Rest of Europe
- 5.2.4 Middle East
- 5.2.4.1 By Country
- 5.2.4.1.1 Iran
- 5.2.4.1.2 Saudi Arabia
- 5.2.4.1.3 Rest of Middle East
- 5.2.5 North America
- 5.2.5.1 By Country
- 5.2.5.1.1 Canada
- 5.2.5.1.2 Mexico
- 5.2.5.1.3 United States
- 5.2.5.1.4 Rest of North America
- 5.2.6 South America
- 5.2.6.1 By Country
- 5.2.6.1.1 Argentina
- 5.2.6.1.2 Brazil
- 5.2.6.1.3 Rest of South America
- 5.2.1 Africa
6 COMPETITIVE LANDSCAPE
- 6.1 Key Strategic Moves
- 6.2 Market Share Analysis
- 6.3 Company Landscape
- 6.4 Company Profiles (includes Global Level Overview, Market Level Overview, Core Business Segments, Financials, Headcount, Key Information, Market Rank, Market Share, Products and Services, and Analysis of Recent Developments).
- 6.4.1 Indian Farmers Fertiliser Cooperative Limited
- 6.4.2 Indogulf BioAg LLC (Biotech Division of Indogulf Company)
- 6.4.3 IPL Biologicals Limited
- 6.4.4 Lallemand Inc.
- 6.4.5 Madras Fertilizers Limited
- 6.4.6 National Fertilizers Limited
- 6.4.7 Novozymes
- 6.4.8 Rizobacter
- 6.4.9 T Stanes and Company Limited
- 6.4.10 Vittia Group
7 KEY STRATEGIC QUESTIONS FOR AGRICULTURAL BIOLOGICALS CEOS
8 APPENDIX
- 8.1 Global Overview
- 8.1.1 Overview
- 8.1.2 Porter's Five Forces Framework
- 8.1.3 Global Value Chain Analysis
- 8.1.4 Market Dynamics (DROs)
- 8.2 Sources & References
- 8.3 List of Tables & Figures
- 8.4 Primary Insights
- 8.5 Data Pack
- 8.6 Glossary of Terms
Have a question?


SELECT AN OPTION
Have a question?
Questions? Please give us a call or visit the contact form.