
Need help finding what you are looking for?
Contact Us
PUBLISHER: Allied Market Research | PRODUCT CODE: 1513355

PUBLISHER: Allied Market Research | PRODUCT CODE: 1513355
Sweetener Market By Type, By Application, By Distribution Channel : Global Opportunity Analysis and Industry Forecast, 2024-2035
PUBLISHED:
PAGES: 445 Pages
DELIVERY TIME: 2-3 business days
SELECT AN OPTION
The global sweetener market was valued at $88.1 billion in 2023, and is projected to reach $154.6 billion by 2035, growing at a CAGR of 4.9% from 2024 to 2035. Sweeteners are a type of food additives that are used to enhance the taste of sweetness in food and drinks. These can be natural or artificial compounds that add a sweet flavor to various types of food. Sweeteners are used for various purposes, such as preserving food, aiding in fermentation (such as in brewing and winemaking), baking (to provide texture, tenderization, and leavening), and helping with food browning and caramelization. Low-calorie sweeteners are commonly used in meals and beverages to reduce the risk of dental caries and to lower the calorie count, as they help prevent an increase in blood sugar levels. The sweetener market is experiencing significant growth driven by evolving consumer preferences, technological advancements, and increasing health consciousness. Consumers are increasingly opting for low-calorie and sugar-free alternatives, prompting food and beverage manufacturers to incorporate sweeteners into their products. This trend is particularly prominent in the processed food segment, where convenience and health considerations play crucial roles. Additionally, the rising prevalence of lifestyle-related diseases such as obesity and diabetes is further fueling the demand for healthier sweetening options, driving market expansion. 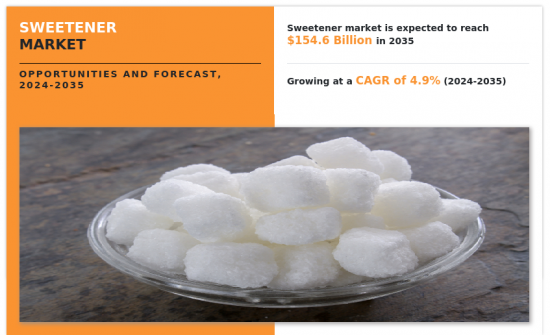 Industry trends indicate a growing preference for natural sweeteners derived from sources like stevia and monk fruit, as consumers seek cleaner label products. This shift towards natural sweeteners is also propelled by concerns over the safety and long-term health effects of artificial sweeteners. Consequently, companies are investing in research and development to innovate new formulations and improve the taste profiles of natural sweeteners, capitalizing on this emerging market trend. The sweetener industry faces multiple challenges, even with changing consumer preferences. Stringent standards and regulatory hurdles surrounding the use of sweeteners in food products create difficulties for market expansion and entry. Furthermore, the unstable prices of raw materials and disruptions in supply chains can affect production costs and profit margins, which pose a threat to the sustainability of sweetener businesses. Additionally, competition among key players is fierce as companies strive to differentiate their products and gain a larger market share through branding and marketing strategies. Despite the challenges, the sweetener market provides great business opportunities for companies that are willing to innovate and adapt to the dynamic market conditions. Expanding into emerging markets with increasing disposable incomes and shifting dietary preferences is a promising avenue for growth. Additionally, strategic collaborations with food ingredient suppliers or research institutions can help gain access to new technologies and markets, creating a competitive advantage. Overall, the sweetener industry is constantly evolving in response to changing consumer demands and regulatory environments, offering both challenges and opportunities for stakeholders throughout the value chain. The sweetener market is segmented into type, application, distribution channel, and region. Based on type, the market is segmented into sucrose, starch sweeteners & sugar alcohol, and high-intensity sweeteners. Based on application, it is segmented into bakery & cereal, beverages, dairy, processed food confectionery, and tabletop sweeteners. By distribution channels, it is segmented into supermarkets & hypermarkets, departmental stores, convenience stores, online stores, and others. Region wise, it is analyzed across North America (the U.S., Canada, and Mexico), Europe (Germany, UK, France, Italy, Spain, and the rest of Europe), Asia-Pacific (China, Japan, India, Australia, Malaysia, Thailand, Indonesia, and rest of Asia-Pacific), and LA (Brazil, Argentina, rest of LA), MEA (UAE, South Africa, and rest of MEA). Major players such as Ajinomoto Co, Inc., Archer Daniels Midland Company, Associated British Foods Plc, and Cargill Incorporated have adopted product approval, partnership, agreement, and acquisition as key developmental strategies to improve the product portfolio of the sweetener market.
Key Benefits For Stakeholders
- This report provides a quantitative analysis of the market segments, current trends, estimations, and dynamics of the sweetener market analysis from 2023 to 2035 to identify the prevailing sweetener market opportunities.
- The market research is offered along with information related to key drivers, restraints, and opportunities.
- Porter's five forces analysis highlights the potency of buyers and suppliers to enable stakeholders make profit-oriented business decisions and strengthen their supplier-buyer network.
- In-depth analysis of the sweetener market segmentation assists to determine the prevailing market opportunities.
- Major countries in each region are mapped according to their revenue contribution to the global market.
- Market player positioning facilitates benchmarking and provides a clear understanding of the present position of the market players.
- The report includes the analysis of the regional as well as global sweetener market trends, key players, market segments, application areas, and market growth strategies.
Additional benefits you will get with this purchase are:
- Quarterly Update and* (only available with a corporate license, on listed price)
- 5 additional Company Profile of client Choice pre- or Post-purchase, as a free update.
- Free Upcoming Version on the Purchase of Five and Enterprise User License.
- 16 analyst hours of support* (post-purchase, if you find additional data requirements upon review of the report, you may receive support amounting to 16 analyst hours to solve questions, and post-sale queries)
- 15% Free Customization* (in case the scope or segment of the report does not match your requirements, 15% is equivalent to 3 working days of free work, applicable once)
- Free data Pack on the Five and Enterprise User License. (Excel version of the report)
- Free Updated report if the report is 6-12 months old or older.
- 24-hour priority response*
- Free Industry updates and white papers.Possible Customization with this report (with additional cost and timeline, please talk to the sales executive to know more)
- Consumer Buying Behavior Analysis
- End user preferences and pain points
- Upcoming/New Entrant by Regions
- Regulatory Guidelines
- Strategic Recommendations
- Additional company profiles with specific to client's interest
- Additional country or region analysis- market size and forecast
- Average Selling Price Analysis / Price Point Analysis
- Historic market data
- Key player details (including location, contact details, supplier/vendor network etc. in excel format)
Key Market Segments
By Type
- Sucrose
- Starch Sweeteners and Sugar Alcohol
- High Intensity Sweeteners
By Application
- Confectionery
- Table Top Sweetener
- Bakery and Cereal
- Beverages
- Dairy
- Processed food
By Distribution Channel
- Supermarket and Hypermarkets
- Departmental Stores
- Convenience Stores
- Online Store
- Others
By Region
- North America
- U.S.
- Canada
- Mexico
- Europe
- Germany
- UK
- France
- Italy
- Spain
- Rest of Europe
- Asia-Pacific
- China
- Japan
- India
- Australia
- Malaysia
- Thailand
- Indonesia
- Rest of Asia-Pacific
- Latin America
- Brazil
- Argentina
- Rest of Latin America
- Middle East and Africa
- UAE
- South Africa
- Rest Of MEA
Key Market Players:
- Ajinomoto Co, Inc.
- Archer Daniels Midland Company
- Associated British Foods Plc
- Cargill, Incorporated
- Celanese Corporation
- DuPont de Nemours, Inc.
- Ingredion Incorporated
- Kerry Group
- Roquette Freres
- Sudzucker Group
- Tate and Lyle Plc
Product Code: A07467
TABLE OF CONTENTS
CHAPTER 1: INTRODUCTION
- 1.1. Report description
- 1.2. Key market segments
- 1.3. Key benefits to the stakeholders
- 1.4. Research methodology
- 1.4.1. Primary research
- 1.4.2. Secondary research
- 1.4.3. Analyst tools and models
CHAPTER 2: EXECUTIVE SUMMARY
- 2.1. CXO perspective
CHAPTER 3: MARKET OVERVIEW
- 3.1. Market definition and scope
- 3.2. Key findings
- 3.2.1. Top impacting factors
- 3.2.2. Top investment pockets
- 3.3. Porter's five forces analysis
- 3.4. Market dynamics
- 3.4.1. Drivers
- 3.4.2. Restraints
- 3.4.3. Opportunities
- 3.5. Brand Share Analysis
- 3.6. Value Chain Analysis
- 3.7. Key Players Details
- 3.8. Pricing Analysis
- 3.9. Key Regulation Analysis
- 3.10. Regulatory Guidelines
CHAPTER 4: SWEETENER MARKET, BY TYPE
- 4.1. Overview
- 4.1.1. Market size and forecast
- 4.2. Sucrose
- 4.2.1. Key market trends, growth factors and opportunities
- 4.2.2. Market size and forecast, by region
- 4.2.3. Market share analysis by country
- 4.3. Starch Sweeteners and Sugar Alcohol
- 4.3.1. Key market trends, growth factors and opportunities
- 4.3.2. Market size and forecast, by region
- 4.3.3. Market share analysis by country
- 4.4. High Intensity Sweeteners
- 4.4.1. Key market trends, growth factors and opportunities
- 4.4.2. Market size and forecast, by region
- 4.4.3. Market share analysis by country
CHAPTER 5: SWEETENER MARKET, BY APPLICATION
- 5.1. Overview
- 5.1.1. Market size and forecast
- 5.2. Bakery and Cereal
- 5.2.1. Key market trends, growth factors and opportunities
- 5.2.2. Market size and forecast, by region
- 5.2.3. Market share analysis by country
- 5.3. Beverages
- 5.3.1. Key market trends, growth factors and opportunities
- 5.3.2. Market size and forecast, by region
- 5.3.3. Market share analysis by country
- 5.4. Dairy
- 5.4.1. Key market trends, growth factors and opportunities
- 5.4.2. Market size and forecast, by region
- 5.4.3. Market share analysis by country
- 5.5. Processed food
- 5.5.1. Key market trends, growth factors and opportunities
- 5.5.2. Market size and forecast, by region
- 5.5.3. Market share analysis by country
- 5.6. Confectionery
- 5.6.1. Key market trends, growth factors and opportunities
- 5.6.2. Market size and forecast, by region
- 5.6.3. Market share analysis by country
- 5.7. Table Top Sweetener
- 5.7.1. Key market trends, growth factors and opportunities
- 5.7.2. Market size and forecast, by region
- 5.7.3. Market share analysis by country
CHAPTER 6: SWEETENER MARKET, BY DISTRIBUTION CHANNEL
- 6.1. Overview
- 6.1.1. Market size and forecast
- 6.2. Supermarket and Hypermarkets
- 6.2.1. Key market trends, growth factors and opportunities
- 6.2.2. Market size and forecast, by region
- 6.2.3. Market share analysis by country
- 6.3. Departmental Stores
- 6.3.1. Key market trends, growth factors and opportunities
- 6.3.2. Market size and forecast, by region
- 6.3.3. Market share analysis by country
- 6.4. Convenience Stores
- 6.4.1. Key market trends, growth factors and opportunities
- 6.4.2. Market size and forecast, by region
- 6.4.3. Market share analysis by country
- 6.5. Online Store
- 6.5.1. Key market trends, growth factors and opportunities
- 6.5.2. Market size and forecast, by region
- 6.5.3. Market share analysis by country
- 6.6. Others
- 6.6.1. Key market trends, growth factors and opportunities
- 6.6.2. Market size and forecast, by region
- 6.6.3. Market share analysis by country
CHAPTER 7: SWEETENER MARKET, BY REGION
- 7.1. Overview
- 7.1.1. Market size and forecast By Region
- 7.2. North America
- 7.2.1. Key market trends, growth factors and opportunities
- 7.2.2. Market size and forecast, by Type
- 7.2.3. Market size and forecast, by Application
- 7.2.4. Market size and forecast, by Distribution Channel
- 7.2.5. Market size and forecast, by country
- 7.2.5.1. U.S.
- 7.2.5.1.1. Market size and forecast, by Type
- 7.2.5.1.2. Market size and forecast, by Application
- 7.2.5.1.3. Market size and forecast, by Distribution Channel
- 7.2.5.2. Canada
- 7.2.5.2.1. Market size and forecast, by Type
- 7.2.5.2.2. Market size and forecast, by Application
- 7.2.5.2.3. Market size and forecast, by Distribution Channel
- 7.2.5.3. Mexico
- 7.2.5.3.1. Market size and forecast, by Type
- 7.2.5.3.2. Market size and forecast, by Application
- 7.2.5.3.3. Market size and forecast, by Distribution Channel
- 7.3. Europe
- 7.3.1. Key market trends, growth factors and opportunities
- 7.3.2. Market size and forecast, by Type
- 7.3.3. Market size and forecast, by Application
- 7.3.4. Market size and forecast, by Distribution Channel
- 7.3.5. Market size and forecast, by country
- 7.3.5.1. Germany
- 7.3.5.1.1. Market size and forecast, by Type
- 7.3.5.1.2. Market size and forecast, by Application
- 7.3.5.1.3. Market size and forecast, by Distribution Channel
- 7.3.5.2. UK
- 7.3.5.2.1. Market size and forecast, by Type
- 7.3.5.2.2. Market size and forecast, by Application
- 7.3.5.2.3. Market size and forecast, by Distribution Channel
- 7.3.5.3. France
- 7.3.5.3.1. Market size and forecast, by Type
- 7.3.5.3.2. Market size and forecast, by Application
- 7.3.5.3.3. Market size and forecast, by Distribution Channel
- 7.3.5.4. Italy
- 7.3.5.4.1. Market size and forecast, by Type
- 7.3.5.4.2. Market size and forecast, by Application
- 7.3.5.4.3. Market size and forecast, by Distribution Channel
- 7.3.5.5. Spain
- 7.3.5.5.1. Market size and forecast, by Type
- 7.3.5.5.2. Market size and forecast, by Application
- 7.3.5.5.3. Market size and forecast, by Distribution Channel
- 7.3.5.6. Rest of Europe
- 7.3.5.6.1. Market size and forecast, by Type
- 7.3.5.6.2. Market size and forecast, by Application
- 7.3.5.6.3. Market size and forecast, by Distribution Channel
- 7.4. Asia-Pacific
- 7.4.1. Key market trends, growth factors and opportunities
- 7.4.2. Market size and forecast, by Type
- 7.4.3. Market size and forecast, by Application
- 7.4.4. Market size and forecast, by Distribution Channel
- 7.4.5. Market size and forecast, by country
- 7.4.5.1. China
- 7.4.5.1.1. Market size and forecast, by Type
- 7.4.5.1.2. Market size and forecast, by Application
- 7.4.5.1.3. Market size and forecast, by Distribution Channel
- 7.4.5.2. Japan
- 7.4.5.2.1. Market size and forecast, by Type
- 7.4.5.2.2. Market size and forecast, by Application
- 7.4.5.2.3. Market size and forecast, by Distribution Channel
- 7.4.5.3. India
- 7.4.5.3.1. Market size and forecast, by Type
- 7.4.5.3.2. Market size and forecast, by Application
- 7.4.5.3.3. Market size and forecast, by Distribution Channel
- 7.4.5.4. Australia
- 7.4.5.4.1. Market size and forecast, by Type
- 7.4.5.4.2. Market size and forecast, by Application
- 7.4.5.4.3. Market size and forecast, by Distribution Channel
- 7.4.5.5. Malaysia
- 7.4.5.5.1. Market size and forecast, by Type
- 7.4.5.5.2. Market size and forecast, by Application
- 7.4.5.5.3. Market size and forecast, by Distribution Channel
- 7.4.5.6. Thailand
- 7.4.5.6.1. Market size and forecast, by Type
- 7.4.5.6.2. Market size and forecast, by Application
- 7.4.5.6.3. Market size and forecast, by Distribution Channel
- 7.4.5.7. Indonesia
- 7.4.5.7.1. Market size and forecast, by Type
- 7.4.5.7.2. Market size and forecast, by Application
- 7.4.5.7.3. Market size and forecast, by Distribution Channel
- 7.4.5.8. Rest of Asia-Pacific
- 7.4.5.8.1. Market size and forecast, by Type
- 7.4.5.8.2. Market size and forecast, by Application
- 7.4.5.8.3. Market size and forecast, by Distribution Channel
- 7.5. Latin America
- 7.5.1. Key market trends, growth factors and opportunities
- 7.5.2. Market size and forecast, by Type
- 7.5.3. Market size and forecast, by Application
- 7.5.4. Market size and forecast, by Distribution Channel
- 7.5.5. Market size and forecast, by country
- 7.5.5.1. Brazil
- 7.5.5.1.1. Market size and forecast, by Type
- 7.5.5.1.2. Market size and forecast, by Application
- 7.5.5.1.3. Market size and forecast, by Distribution Channel
- 7.5.5.2. Argentina
- 7.5.5.2.1. Market size and forecast, by Type
- 7.5.5.2.2. Market size and forecast, by Application
- 7.5.5.2.3. Market size and forecast, by Distribution Channel
- 7.5.5.3. Rest of Latin America
- 7.5.5.3.1. Market size and forecast, by Type
- 7.5.5.3.2. Market size and forecast, by Application
- 7.5.5.3.3. Market size and forecast, by Distribution Channel
- 7.6. Middle East and Africa
- 7.6.1. Key market trends, growth factors and opportunities
- 7.6.2. Market size and forecast, by Type
- 7.6.3. Market size and forecast, by Application
- 7.6.4. Market size and forecast, by Distribution Channel
- 7.6.5. Market size and forecast, by country
- 7.6.5.1. UAE
- 7.6.5.1.1. Market size and forecast, by Type
- 7.6.5.1.2. Market size and forecast, by Application
- 7.6.5.1.3. Market size and forecast, by Distribution Channel
- 7.6.5.2. South Africa
- 7.6.5.2.1. Market size and forecast, by Type
- 7.6.5.2.2. Market size and forecast, by Application
- 7.6.5.2.3. Market size and forecast, by Distribution Channel
- 7.6.5.3. Rest Of MEA
- 7.6.5.3.1. Market size and forecast, by Type
- 7.6.5.3.2. Market size and forecast, by Application
- 7.6.5.3.3. Market size and forecast, by Distribution Channel
CHAPTER 8: COMPETITIVE LANDSCAPE
- 8.1. Introduction
- 8.2. Top winning strategies
- 8.3. Product mapping of top 10 player
- 8.4. Competitive dashboard
- 8.5. Competitive heatmap
- 8.6. Top player positioning, 2023
CHAPTER 9: COMPANY PROFILES
- 9.1. Ajinomoto Co, Inc.
- 9.1.1. Company overview
- 9.1.2. Key executives
- 9.1.3. Company snapshot
- 9.1.4. Operating business segments
- 9.1.5. Product portfolio
- 9.1.6. Business performance
- 9.1.7. Key strategic moves and developments
- 9.2. Archer Daniels Midland Company
- 9.2.1. Company overview
- 9.2.2. Key executives
- 9.2.3. Company snapshot
- 9.2.4. Operating business segments
- 9.2.5. Product portfolio
- 9.2.6. Business performance
- 9.2.7. Key strategic moves and developments
- 9.3. Associated British Foods Plc
- 9.3.1. Company overview
- 9.3.2. Key executives
- 9.3.3. Company snapshot
- 9.3.4. Operating business segments
- 9.3.5. Product portfolio
- 9.3.6. Business performance
- 9.3.7. Key strategic moves and developments
- 9.4. Cargill, Incorporated
- 9.4.1. Company overview
- 9.4.2. Key executives
- 9.4.3. Company snapshot
- 9.4.4. Operating business segments
- 9.4.5. Product portfolio
- 9.4.6. Business performance
- 9.4.7. Key strategic moves and developments
- 9.5. Celanese Corporation
- 9.5.1. Company overview
- 9.5.2. Key executives
- 9.5.3. Company snapshot
- 9.5.4. Operating business segments
- 9.5.5. Product portfolio
- 9.5.6. Business performance
- 9.5.7. Key strategic moves and developments
- 9.6. DuPont de Nemours, Inc.
- 9.6.1. Company overview
- 9.6.2. Key executives
- 9.6.3. Company snapshot
- 9.6.4. Operating business segments
- 9.6.5. Product portfolio
- 9.6.6. Business performance
- 9.6.7. Key strategic moves and developments
- 9.7. Ingredion Incorporated
- 9.7.1. Company overview
- 9.7.2. Key executives
- 9.7.3. Company snapshot
- 9.7.4. Operating business segments
- 9.7.5. Product portfolio
- 9.7.6. Business performance
- 9.7.7. Key strategic moves and developments
- 9.8. Kerry Group
- 9.8.1. Company overview
- 9.8.2. Key executives
- 9.8.3. Company snapshot
- 9.8.4. Operating business segments
- 9.8.5. Product portfolio
- 9.8.6. Business performance
- 9.8.7. Key strategic moves and developments
- 9.9. Roquette Freres
- 9.9.1. Company overview
- 9.9.2. Key executives
- 9.9.3. Company snapshot
- 9.9.4. Operating business segments
- 9.9.5. Product portfolio
- 9.9.6. Business performance
- 9.9.7. Key strategic moves and developments
- 9.10. Sudzucker Group
- 9.10.1. Company overview
- 9.10.2. Key executives
- 9.10.3. Company snapshot
- 9.10.4. Operating business segments
- 9.10.5. Product portfolio
- 9.10.6. Business performance
- 9.10.7. Key strategic moves and developments
- 9.11. Tate and Lyle Plc
- 9.11.1. Company overview
- 9.11.2. Key executives
- 9.11.3. Company snapshot
- 9.11.4. Operating business segments
- 9.11.5. Product portfolio
- 9.11.6. Business performance
- 9.11.7. Key strategic moves and developments
Product Code: A07467
LIST OF TABLES
- TABLE 01. GLOBAL SWEETENER MARKET, BY TYPE, 2023-2035 ($MILLION)
- TABLE 02. SWEETENER MARKET FOR SUCROSE, BY REGION, 2023-2035 ($MILLION)
- TABLE 03. SWEETENER MARKET FOR STARCH SWEETENERS AND SUGAR ALCOHOL, BY REGION, 2023-2035 ($MILLION)
- TABLE 04. SWEETENER MARKET FOR HIGH INTENSITY SWEETENERS, BY REGION, 2023-2035 ($MILLION)
- TABLE 05. GLOBAL SWEETENER MARKET, BY APPLICATION, 2023-2035 ($MILLION)
- TABLE 06. SWEETENER MARKET FOR BAKERY AND CEREAL, BY REGION, 2023-2035 ($MILLION)
- TABLE 07. SWEETENER MARKET FOR BEVERAGES, BY REGION, 2023-2035 ($MILLION)
- TABLE 08. SWEETENER MARKET FOR DAIRY, BY REGION, 2023-2035 ($MILLION)
- TABLE 09. SWEETENER MARKET FOR PROCESSED FOOD, BY REGION, 2023-2035 ($MILLION)
- TABLE 10. SWEETENER MARKET FOR CONFECTIONERY, BY REGION, 2023-2035 ($MILLION)
- TABLE 11. SWEETENER MARKET FOR TABLE TOP SWEETENER, BY REGION, 2023-2035 ($MILLION)
- TABLE 12. GLOBAL SWEETENER MARKET, BY DISTRIBUTION CHANNEL, 2023-2035 ($MILLION)
- TABLE 13. SWEETENER MARKET FOR SUPERMARKET AND HYPERMARKETS, BY REGION, 2023-2035 ($MILLION)
- TABLE 14. SWEETENER MARKET FOR DEPARTMENTAL STORES, BY REGION, 2023-2035 ($MILLION)
- TABLE 15. SWEETENER MARKET FOR CONVENIENCE STORES, BY REGION, 2023-2035 ($MILLION)
- TABLE 16. SWEETENER MARKET FOR ONLINE STORE, BY REGION, 2023-2035 ($MILLION)
- TABLE 17. SWEETENER MARKET FOR OTHERS, BY REGION, 2023-2035 ($MILLION)
- TABLE 18. SWEETENER MARKET, BY REGION, 2023-2035 ($MILLION)
- TABLE 19. NORTH AMERICA SWEETENER MARKET, BY TYPE, 2023-2035 ($MILLION)
- TABLE 20. NORTH AMERICA SWEETENER MARKET, BY APPLICATION, 2023-2035 ($MILLION)
- TABLE 21. NORTH AMERICA SWEETENER MARKET, BY DISTRIBUTION CHANNEL, 2023-2035 ($MILLION)
- TABLE 22. NORTH AMERICA SWEETENER MARKET, BY COUNTRY, 2023-2035 ($MILLION)
- TABLE 23. U.S. SWEETENER MARKET, BY TYPE, 2023-2035 ($MILLION)
- TABLE 24. U.S. SWEETENER MARKET, BY APPLICATION, 2023-2035 ($MILLION)
- TABLE 25. U.S. SWEETENER MARKET, BY DISTRIBUTION CHANNEL, 2023-2035 ($MILLION)
- TABLE 26. CANADA SWEETENER MARKET, BY TYPE, 2023-2035 ($MILLION)
- TABLE 27. CANADA SWEETENER MARKET, BY APPLICATION, 2023-2035 ($MILLION)
- TABLE 28. CANADA SWEETENER MARKET, BY DISTRIBUTION CHANNEL, 2023-2035 ($MILLION)
- TABLE 29. MEXICO SWEETENER MARKET, BY TYPE, 2023-2035 ($MILLION)
- TABLE 30. MEXICO SWEETENER MARKET, BY APPLICATION, 2023-2035 ($MILLION)
- TABLE 31. MEXICO SWEETENER MARKET, BY DISTRIBUTION CHANNEL, 2023-2035 ($MILLION)
- TABLE 32. EUROPE SWEETENER MARKET, BY TYPE, 2023-2035 ($MILLION)
- TABLE 33. EUROPE SWEETENER MARKET, BY APPLICATION, 2023-2035 ($MILLION)
- TABLE 34. EUROPE SWEETENER MARKET, BY DISTRIBUTION CHANNEL, 2023-2035 ($MILLION)
- TABLE 35. EUROPE SWEETENER MARKET, BY COUNTRY, 2023-2035 ($MILLION)
- TABLE 36. GERMANY SWEETENER MARKET, BY TYPE, 2023-2035 ($MILLION)
- TABLE 37. GERMANY SWEETENER MARKET, BY APPLICATION, 2023-2035 ($MILLION)
- TABLE 38. GERMANY SWEETENER MARKET, BY DISTRIBUTION CHANNEL, 2023-2035 ($MILLION)
- TABLE 39. UK SWEETENER MARKET, BY TYPE, 2023-2035 ($MILLION)
- TABLE 40. UK SWEETENER MARKET, BY APPLICATION, 2023-2035 ($MILLION)
- TABLE 41. UK SWEETENER MARKET, BY DISTRIBUTION CHANNEL, 2023-2035 ($MILLION)
- TABLE 42. FRANCE SWEETENER MARKET, BY TYPE, 2023-2035 ($MILLION)
- TABLE 43. FRANCE SWEETENER MARKET, BY APPLICATION, 2023-2035 ($MILLION)
- TABLE 44. FRANCE SWEETENER MARKET, BY DISTRIBUTION CHANNEL, 2023-2035 ($MILLION)
- TABLE 45. ITALY SWEETENER MARKET, BY TYPE, 2023-2035 ($MILLION)
- TABLE 46. ITALY SWEETENER MARKET, BY APPLICATION, 2023-2035 ($MILLION)
- TABLE 47. ITALY SWEETENER MARKET, BY DISTRIBUTION CHANNEL, 2023-2035 ($MILLION)
- TABLE 48. SPAIN SWEETENER MARKET, BY TYPE, 2023-2035 ($MILLION)
- TABLE 49. SPAIN SWEETENER MARKET, BY APPLICATION, 2023-2035 ($MILLION)
- TABLE 50. SPAIN SWEETENER MARKET, BY DISTRIBUTION CHANNEL, 2023-2035 ($MILLION)
- TABLE 51. REST OF EUROPE SWEETENER MARKET, BY TYPE, 2023-2035 ($MILLION)
- TABLE 52. REST OF EUROPE SWEETENER MARKET, BY APPLICATION, 2023-2035 ($MILLION)
- TABLE 53. REST OF EUROPE SWEETENER MARKET, BY DISTRIBUTION CHANNEL, 2023-2035 ($MILLION)
- TABLE 54. ASIA-PACIFIC SWEETENER MARKET, BY TYPE, 2023-2035 ($MILLION)
- TABLE 55. ASIA-PACIFIC SWEETENER MARKET, BY APPLICATION, 2023-2035 ($MILLION)
- TABLE 56. ASIA-PACIFIC SWEETENER MARKET, BY DISTRIBUTION CHANNEL, 2023-2035 ($MILLION)
- TABLE 57. ASIA-PACIFIC SWEETENER MARKET, BY COUNTRY, 2023-2035 ($MILLION)
- TABLE 58. CHINA SWEETENER MARKET, BY TYPE, 2023-2035 ($MILLION)
- TABLE 59. CHINA SWEETENER MARKET, BY APPLICATION, 2023-2035 ($MILLION)
- TABLE 60. CHINA SWEETENER MARKET, BY DISTRIBUTION CHANNEL, 2023-2035 ($MILLION)
- TABLE 61. JAPAN SWEETENER MARKET, BY TYPE, 2023-2035 ($MILLION)
- TABLE 62. JAPAN SWEETENER MARKET, BY APPLICATION, 2023-2035 ($MILLION)
- TABLE 63. JAPAN SWEETENER MARKET, BY DISTRIBUTION CHANNEL, 2023-2035 ($MILLION)
- TABLE 64. INDIA SWEETENER MARKET, BY TYPE, 2023-2035 ($MILLION)
- TABLE 65. INDIA SWEETENER MARKET, BY APPLICATION, 2023-2035 ($MILLION)
- TABLE 66. INDIA SWEETENER MARKET, BY DISTRIBUTION CHANNEL, 2023-2035 ($MILLION)
- TABLE 67. AUSTRALIA SWEETENER MARKET, BY TYPE, 2023-2035 ($MILLION)
- TABLE 68. AUSTRALIA SWEETENER MARKET, BY APPLICATION, 2023-2035 ($MILLION)
- TABLE 69. AUSTRALIA SWEETENER MARKET, BY DISTRIBUTION CHANNEL, 2023-2035 ($MILLION)
- TABLE 70. MALAYSIA SWEETENER MARKET, BY TYPE, 2023-2035 ($MILLION)
- TABLE 71. MALAYSIA SWEETENER MARKET, BY APPLICATION, 2023-2035 ($MILLION)
- TABLE 72. MALAYSIA SWEETENER MARKET, BY DISTRIBUTION CHANNEL, 2023-2035 ($MILLION)
- TABLE 73. THAILAND SWEETENER MARKET, BY TYPE, 2023-2035 ($MILLION)
- TABLE 74. THAILAND SWEETENER MARKET, BY APPLICATION, 2023-2035 ($MILLION)
- TABLE 75. THAILAND SWEETENER MARKET, BY DISTRIBUTION CHANNEL, 2023-2035 ($MILLION)
- TABLE 76. INDONESIA SWEETENER MARKET, BY TYPE, 2023-2035 ($MILLION)
- TABLE 77. INDONESIA SWEETENER MARKET, BY APPLICATION, 2023-2035 ($MILLION)
- TABLE 78. INDONESIA SWEETENER MARKET, BY DISTRIBUTION CHANNEL, 2023-2035 ($MILLION)
- TABLE 79. REST OF ASIA-PACIFIC SWEETENER MARKET, BY TYPE, 2023-2035 ($MILLION)
- TABLE 80. REST OF ASIA-PACIFIC SWEETENER MARKET, BY APPLICATION, 2023-2035 ($MILLION)
- TABLE 81. REST OF ASIA-PACIFIC SWEETENER MARKET, BY DISTRIBUTION CHANNEL, 2023-2035 ($MILLION)
- TABLE 82. LATIN AMERICA SWEETENER MARKET, BY TYPE, 2023-2035 ($MILLION)
- TABLE 83. LATIN AMERICA SWEETENER MARKET, BY APPLICATION, 2023-2035 ($MILLION)
- TABLE 84. LATIN AMERICA SWEETENER MARKET, BY DISTRIBUTION CHANNEL, 2023-2035 ($MILLION)
- TABLE 85. LATIN AMERICA SWEETENER MARKET, BY COUNTRY, 2023-2035 ($MILLION)
- TABLE 86. BRAZIL SWEETENER MARKET, BY TYPE, 2023-2035 ($MILLION)
- TABLE 87. BRAZIL SWEETENER MARKET, BY APPLICATION, 2023-2035 ($MILLION)
- TABLE 88. BRAZIL SWEETENER MARKET, BY DISTRIBUTION CHANNEL, 2023-2035 ($MILLION)
- TABLE 89. ARGENTINA SWEETENER MARKET, BY TYPE, 2023-2035 ($MILLION)
- TABLE 90. ARGENTINA SWEETENER MARKET, BY APPLICATION, 2023-2035 ($MILLION)
- TABLE 91. ARGENTINA SWEETENER MARKET, BY DISTRIBUTION CHANNEL, 2023-2035 ($MILLION)
- TABLE 92. REST OF LATIN AMERICA SWEETENER MARKET, BY TYPE, 2023-2035 ($MILLION)
- TABLE 93. REST OF LATIN AMERICA SWEETENER MARKET, BY APPLICATION, 2023-2035 ($MILLION)
- TABLE 94. REST OF LATIN AMERICA SWEETENER MARKET, BY DISTRIBUTION CHANNEL, 2023-2035 ($MILLION)
- TABLE 95. MIDDLE EAST AND AFRICA SWEETENER MARKET, BY TYPE, 2023-2035 ($MILLION)
- TABLE 96. MIDDLE EAST AND AFRICA SWEETENER MARKET, BY APPLICATION, 2023-2035 ($MILLION)
- TABLE 97. MIDDLE EAST AND AFRICA SWEETENER MARKET, BY DISTRIBUTION CHANNEL, 2023-2035 ($MILLION)
- TABLE 98. MIDDLE EAST AND AFRICA SWEETENER MARKET, BY COUNTRY, 2023-2035 ($MILLION)
- TABLE 99. UAE SWEETENER MARKET, BY TYPE, 2023-2035 ($MILLION)
- TABLE 100. UAE SWEETENER MARKET, BY APPLICATION, 2023-2035 ($MILLION)
- TABLE 101. UAE SWEETENER MARKET, BY DISTRIBUTION CHANNEL, 2023-2035 ($MILLION)
- TABLE 102. SOUTH AFRICA SWEETENER MARKET, BY TYPE, 2023-2035 ($MILLION)
- TABLE 103. SOUTH AFRICA SWEETENER MARKET, BY APPLICATION, 2023-2035 ($MILLION)
- TABLE 104. SOUTH AFRICA SWEETENER MARKET, BY DISTRIBUTION CHANNEL, 2023-2035 ($MILLION)
- TABLE 105. REST OF MEA SWEETENER MARKET, BY TYPE, 2023-2035 ($MILLION)
- TABLE 106. REST OF MEA SWEETENER MARKET, BY APPLICATION, 2023-2035 ($MILLION)
- TABLE 107. REST OF MEA SWEETENER MARKET, BY DISTRIBUTION CHANNEL, 2023-2035 ($MILLION)
- TABLE 108. AJINOMOTO CO, INC.: KEY EXECUTIVES
- TABLE 109. AJINOMOTO CO, INC.: COMPANY SNAPSHOT
- TABLE 110. AJINOMOTO CO, INC.: PRODUCT SEGMENTS
- TABLE 111. AJINOMOTO CO, INC.: SERVICE SEGMENTS
- TABLE 112. AJINOMOTO CO, INC.: PRODUCT PORTFOLIO
- TABLE 113. AJINOMOTO CO, INC.: KEY STRATEGIES
- TABLE 114. ARCHER DANIELS MIDLAND COMPANY: KEY EXECUTIVES
- TABLE 115. ARCHER DANIELS MIDLAND COMPANY: COMPANY SNAPSHOT
- TABLE 116. ARCHER DANIELS MIDLAND COMPANY: PRODUCT SEGMENTS
- TABLE 117. ARCHER DANIELS MIDLAND COMPANY: SERVICE SEGMENTS
- TABLE 118. ARCHER DANIELS MIDLAND COMPANY: PRODUCT PORTFOLIO
- TABLE 119. ARCHER DANIELS MIDLAND COMPANY: KEY STRATEGIES
- TABLE 120. ASSOCIATED BRITISH FOODS PLC: KEY EXECUTIVES
- TABLE 121. ASSOCIATED BRITISH FOODS PLC: COMPANY SNAPSHOT
- TABLE 122. ASSOCIATED BRITISH FOODS PLC: PRODUCT SEGMENTS
- TABLE 123. ASSOCIATED BRITISH FOODS PLC: SERVICE SEGMENTS
- TABLE 124. ASSOCIATED BRITISH FOODS PLC: PRODUCT PORTFOLIO
- TABLE 125. ASSOCIATED BRITISH FOODS PLC: KEY STRATEGIES
- TABLE 126. CARGILL, INCORPORATED: KEY EXECUTIVES
- TABLE 127. CARGILL, INCORPORATED: COMPANY SNAPSHOT
- TABLE 128. CARGILL, INCORPORATED: PRODUCT SEGMENTS
- TABLE 129. CARGILL, INCORPORATED: SERVICE SEGMENTS
- TABLE 130. CARGILL, INCORPORATED: PRODUCT PORTFOLIO
- TABLE 131. CARGILL, INCORPORATED: KEY STRATEGIES
- TABLE 132. CELANESE CORPORATION: KEY EXECUTIVES
- TABLE 133. CELANESE CORPORATION: COMPANY SNAPSHOT
- TABLE 134. CELANESE CORPORATION: PRODUCT SEGMENTS
- TABLE 135. CELANESE CORPORATION: SERVICE SEGMENTS
- TABLE 136. CELANESE CORPORATION: PRODUCT PORTFOLIO
- TABLE 137. CELANESE CORPORATION: KEY STRATEGIES
- TABLE 138. DUPONT DE NEMOURS, INC.: KEY EXECUTIVES
- TABLE 139. DUPONT DE NEMOURS, INC.: COMPANY SNAPSHOT
- TABLE 140. DUPONT DE NEMOURS, INC.: PRODUCT SEGMENTS
- TABLE 141. DUPONT DE NEMOURS, INC.: SERVICE SEGMENTS
- TABLE 142. DUPONT DE NEMOURS, INC.: PRODUCT PORTFOLIO
- TABLE 143. DUPONT DE NEMOURS, INC.: KEY STRATEGIES
- TABLE 144. INGREDION INCORPORATED: KEY EXECUTIVES
- TABLE 145. INGREDION INCORPORATED: COMPANY SNAPSHOT
- TABLE 146. INGREDION INCORPORATED: PRODUCT SEGMENTS
- TABLE 147. INGREDION INCORPORATED: SERVICE SEGMENTS
- TABLE 148. INGREDION INCORPORATED: PRODUCT PORTFOLIO
- TABLE 149. INGREDION INCORPORATED: KEY STRATEGIES
- TABLE 150. KERRY GROUP: KEY EXECUTIVES
- TABLE 151. KERRY GROUP: COMPANY SNAPSHOT
- TABLE 152. KERRY GROUP: PRODUCT SEGMENTS
- TABLE 153. KERRY GROUP: SERVICE SEGMENTS
- TABLE 154. KERRY GROUP: PRODUCT PORTFOLIO
- TABLE 155. KERRY GROUP: KEY STRATEGIES
- TABLE 156. ROQUETTE FRERES: KEY EXECUTIVES
- TABLE 157. ROQUETTE FRERES: COMPANY SNAPSHOT
- TABLE 158. ROQUETTE FRERES: PRODUCT SEGMENTS
- TABLE 159. ROQUETTE FRERES: SERVICE SEGMENTS
- TABLE 160. ROQUETTE FRERES: PRODUCT PORTFOLIO
- TABLE 161. ROQUETTE FRERES: KEY STRATEGIES
- TABLE 162. SUDZUCKER GROUP: KEY EXECUTIVES
- TABLE 163. SUDZUCKER GROUP: COMPANY SNAPSHOT
- TABLE 164. SUDZUCKER GROUP: PRODUCT SEGMENTS
- TABLE 165. SUDZUCKER GROUP: SERVICE SEGMENTS
- TABLE 166. SUDZUCKER GROUP: PRODUCT PORTFOLIO
- TABLE 167. SUDZUCKER GROUP: KEY STRATEGIES
- TABLE 168. TATE AND LYLE PLC: KEY EXECUTIVES
- TABLE 169. TATE AND LYLE PLC: COMPANY SNAPSHOT
- TABLE 170. TATE AND LYLE PLC: PRODUCT SEGMENTS
- TABLE 171. TATE AND LYLE PLC: SERVICE SEGMENTS
- TABLE 172. TATE AND LYLE PLC: PRODUCT PORTFOLIO
- TABLE 173. TATE AND LYLE PLC: KEY STRATEGIES
LIST OF FIGURES
- FIGURE 01. SWEETENER MARKET, 2023-2035
- FIGURE 02. SEGMENTATION OF SWEETENER MARKET,2023-2035
- FIGURE 03. TOP IMPACTING FACTORS IN SWEETENER MARKET
- FIGURE 04. TOP INVESTMENT POCKETS IN SWEETENER MARKET (2024-2035)
- FIGURE 05. BARGAINING POWER OF SUPPLIERS
- FIGURE 06. BARGAINING POWER OF BUYERS
- FIGURE 07. THREAT OF SUBSTITUTION
- FIGURE 08. THREAT OF SUBSTITUTION
- FIGURE 09. COMPETITIVE RIVALRY
- FIGURE 10. GLOBAL SWEETENER MARKET:DRIVERS, RESTRAINTS AND OPPORTUNITIES
- FIGURE 11. PRICING ANALYSIS: SWEETENER MARKET 2023 AND 2035
- FIGURE 12. IMPACT OF KEY REGULATION: SWEETENER MARKET
- FIGURE 13. SWEETENER MARKET, BY TYPE, 2023 AND 2035(%)
- FIGURE 14. COMPARATIVE SHARE ANALYSIS OF SWEETENER MARKET FOR SUCROSE, BY COUNTRY 2023 AND 2035(%)
- FIGURE 15. COMPARATIVE SHARE ANALYSIS OF SWEETENER MARKET FOR STARCH SWEETENERS AND SUGAR ALCOHOL, BY COUNTRY 2023 AND 2035(%)
- FIGURE 16. COMPARATIVE SHARE ANALYSIS OF SWEETENER MARKET FOR HIGH INTENSITY SWEETENERS, BY COUNTRY 2023 AND 2035(%)
- FIGURE 17. SWEETENER MARKET, BY APPLICATION, 2023 AND 2035(%)
- FIGURE 18. COMPARATIVE SHARE ANALYSIS OF SWEETENER MARKET FOR BAKERY AND CEREAL, BY COUNTRY 2023 AND 2035(%)
- FIGURE 19. COMPARATIVE SHARE ANALYSIS OF SWEETENER MARKET FOR BEVERAGES, BY COUNTRY 2023 AND 2035(%)
- FIGURE 20. COMPARATIVE SHARE ANALYSIS OF SWEETENER MARKET FOR DAIRY, BY COUNTRY 2023 AND 2035(%)
- FIGURE 21. COMPARATIVE SHARE ANALYSIS OF SWEETENER MARKET FOR PROCESSED FOOD, BY COUNTRY 2023 AND 2035(%)
- FIGURE 22. COMPARATIVE SHARE ANALYSIS OF SWEETENER MARKET FOR CONFECTIONERY, BY COUNTRY 2023 AND 2035(%)
- FIGURE 23. COMPARATIVE SHARE ANALYSIS OF SWEETENER MARKET FOR TABLE TOP SWEETENER, BY COUNTRY 2023 AND 2035(%)
- FIGURE 24. SWEETENER MARKET, BY DISTRIBUTION CHANNEL, 2023 AND 2035(%)
- FIGURE 25. COMPARATIVE SHARE ANALYSIS OF SWEETENER MARKET FOR SUPERMARKET AND HYPERMARKETS, BY COUNTRY 2023 AND 2035(%)
- FIGURE 26. COMPARATIVE SHARE ANALYSIS OF SWEETENER MARKET FOR DEPARTMENTAL STORES, BY COUNTRY 2023 AND 2035(%)
- FIGURE 27. COMPARATIVE SHARE ANALYSIS OF SWEETENER MARKET FOR CONVENIENCE STORES, BY COUNTRY 2023 AND 2035(%)
- FIGURE 28. COMPARATIVE SHARE ANALYSIS OF SWEETENER MARKET FOR ONLINE STORE, BY COUNTRY 2023 AND 2035(%)
- FIGURE 29. COMPARATIVE SHARE ANALYSIS OF SWEETENER MARKET FOR OTHERS, BY COUNTRY 2023 AND 2035(%)
- FIGURE 30. SWEETENER MARKET BY REGION, 2023 AND 2035(%)
- FIGURE 31. U.S. SWEETENER MARKET, 2023-2035 ($MILLION)
- FIGURE 32. CANADA SWEETENER MARKET, 2023-2035 ($MILLION)
- FIGURE 33. MEXICO SWEETENER MARKET, 2023-2035 ($MILLION)
- FIGURE 34. GERMANY SWEETENER MARKET, 2023-2035 ($MILLION)
- FIGURE 35. UK SWEETENER MARKET, 2023-2035 ($MILLION)
- FIGURE 36. FRANCE SWEETENER MARKET, 2023-2035 ($MILLION)
- FIGURE 37. ITALY SWEETENER MARKET, 2023-2035 ($MILLION)
- FIGURE 38. SPAIN SWEETENER MARKET, 2023-2035 ($MILLION)
- FIGURE 39. REST OF EUROPE SWEETENER MARKET, 2023-2035 ($MILLION)
- FIGURE 40. CHINA SWEETENER MARKET, 2023-2035 ($MILLION)
- FIGURE 41. JAPAN SWEETENER MARKET, 2023-2035 ($MILLION)
- FIGURE 42. INDIA SWEETENER MARKET, 2023-2035 ($MILLION)
- FIGURE 43. AUSTRALIA SWEETENER MARKET, 2023-2035 ($MILLION)
- FIGURE 44. MALAYSIA SWEETENER MARKET, 2023-2035 ($MILLION)
- FIGURE 45. THAILAND SWEETENER MARKET, 2023-2035 ($MILLION)
- FIGURE 46. INDONESIA SWEETENER MARKET, 2023-2035 ($MILLION)
- FIGURE 47. REST OF ASIA-PACIFIC SWEETENER MARKET, 2023-2035 ($MILLION)
- FIGURE 48. BRAZIL SWEETENER MARKET, 2023-2035 ($MILLION)
- FIGURE 49. ARGENTINA SWEETENER MARKET, 2023-2035 ($MILLION)
- FIGURE 50. REST OF LATIN AMERICA SWEETENER MARKET, 2023-2035 ($MILLION)
- FIGURE 51. UAE SWEETENER MARKET, 2023-2035 ($MILLION)
- FIGURE 52. SOUTH AFRICA SWEETENER MARKET, 2023-2035 ($MILLION)
- FIGURE 53. REST OF MEA SWEETENER MARKET, 2023-2035 ($MILLION)
- FIGURE 54. TOP WINNING STRATEGIES, BY YEAR
- FIGURE 55. TOP WINNING STRATEGIES, BY DEVELOPMENT
- FIGURE 56. TOP WINNING STRATEGIES, BY COMPANY
- FIGURE 57. PRODUCT MAPPING OF TOP 10 PLAYERS
- FIGURE 58. COMPETITIVE DASHBOARD
- FIGURE 59. COMPETITIVE HEATMAP: SWEETENER MARKET
- FIGURE 60. TOP PLAYER POSITIONING, 2023
Have a question?


SELECT AN OPTION
Have a question?
Questions? Please give us a call or visit the contact form.