
PUBLISHER: Roots Analysis | PRODUCT CODE: 1643959

PUBLISHER: Roots Analysis | PRODUCT CODE: 1643959
Needles Market: Industry Trends and Global Forecasts, till 2035 - Distribution by Type of Needle based on Design, Type of Needle based on Purpose, Mode of Delivery, Type of Material, End Users, Geographical Regions and Leading Players
NEEDLES MARKET:
As per Roots Analysis, the global needles market size is estimated to grow from USD 8.1 billion in the current year to USD 14.7 billion by 2035, at a CAGR of 6.1% during the forecast period, till 2035.
The opportunity for needles market has been distributed across the following segments:
- Type of Needle based on Design
- Conventional Needles
- Safety Needles
- Type of Needle based on Purpose
- Syringe Needles
- Suture Needles
- Pen Needles
- Autoinjector Needles
- Blood Collection Needles
- Others
- Type of Material
- Stainless Steel
- Plastic
- Others
- Mode of Delivery
- Subcutaneous
- Intramuscular
- Intravenous
- Intradermal
- Others
- End Users
- Hospitals and Clinics
- Diagnostic Centers
- Home Healthcare
- Others
- Geographical Regions
- North America (US, Canada and Mexico)
- Europe (Germany, France, UK, Italy, Spain and Rest of Europe)
- Asia-Pacific (China, Japan, India and Rest of Asia-Pacific)
- Midde East and North Africa (Egypt, Saudi Arabia and UAE)
- Latin America (Brazil and Argentina)
- Leading Players
NEEDLES MARKET: GROWTH AND TRENDS
Over the years, increasing prevalence of chronic diseases, such as autoimmune diseases, diabetes, cancer, and heart diseases, has led to reduced mobility and increased mortality among the patients. A recent report from the Center for Managing Chronic Disease at the University of Michigan indicated that more than 50% of the US population is suffering from at least one type of chronic disease. Needles play a vital role in managing chronic diseases owing to their accuracy and effectiveness in providing targeted treatment and facilitating diagnostic procedures, thereby increasing their demand.
Over the centuries, needles have been an indispensable tool used in healthcare, playing a crucial role in various medical procedures, such as administering medication, extracting fluid samples and in wound closure procedures. Moreover, extensive R&D in this domain has led to the development and commercialization of several advanced needles, such as pen needles that are finer and less painful. These innovations have enhanced the use of needles across hospitals, diagnostic centers and homecare settings, making them vital for a wide range of therapeutic deliveries.
Driven by the benefits offered by needles and the increasing need for effective disease management, routine diagnosis and vaccination programs, the demand for needles is increasing at a steady pace. Moreover, owing to continuous improvement in material science, design and manufacturing techniques, the development and application of needles is anticipated to expand, positioning the market for healthy growth in the forthcoming years.
NEEDLES MARKET: KEY INSIGHTS
The report delves into the current state of the needles market and identifies potential growth opportunities within the industry. Some key findings from the report include:
1.Currently, over 475 companies are engaged in the manufacturing and development of needles, with more than 30% of these players headquartered in China.
2.Stainless steel has emerged as the preferred material for needle development due to its high tensile strength, durability and resistance to corrosion, thereby ensuring greater precision and safety in medical procedures.
3.In pursuit of a competitive edge, stakeholders are actively upgrading their existing capabilities and enhancing their needle portfolios to meet evolving industry standards.
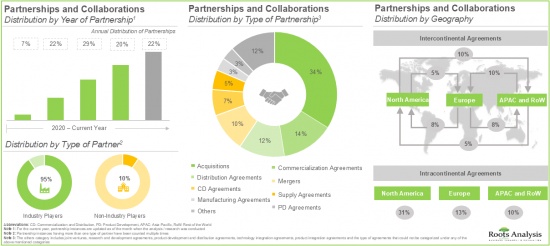
4.Close to 40% of the deals have been inked in the last two years, demonstrating a considerable increase in partnership activity during the given period; of these, 60% were international deals.
5.Around 765 patents related to needles have been filed / granted to various industry and non-industry players in order to protect the intellectual property generated within this field.
6.The market opportunity associated with needles is likely to witness an annualized growth rate of 6.1% till 2035, owing to the growing demand for injectable therapies.
7.The needles market opportunity is expected to be well distributed across different types of materials, modes of delivery and end users.
NEEDLES MARKET: KEY SEGMENTS
Safety Needles is the Fastest Growing Segment of the Needles Market
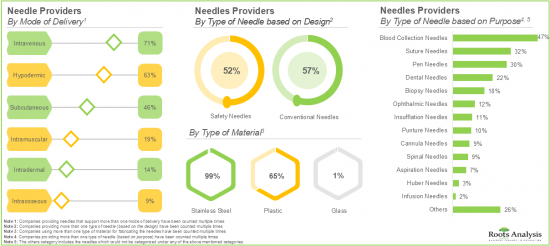
Based on the types of needles based on design, the global needles market is segmented into conventional needles and safety needles. Currently, the majority share of the needles market is captured by conventional needles. It is worth mentioning that the safety needles segment is likely to grow at a higher CAGR in the coming years.
Syringe Needles Segment is Likely to Dominate the Needles Market During the Forecast Period
Based on the types of needles based on purpose, the global needles market is distributed across syringe needles, suture needles, pen needles, autoinjector needles, blood collection needles and others. Currently, the syringe needles segment is likely to dominate the overall market, owing to their wide range of applications in various medical procedures.
Subcutaneous Mode of Delivery Segment is Likely to Hold the Largest Share of the Needles Market During the Forecast Period
Based on the mode of delivery, the global needles market is segmented into subcutaneous mode, intramuscular mode, intravenous mode, intradermal mode and others. Currently, the market is likely to be dominated by the subcutaneous mode of delivery segment. This can be attributed to the fact that subcutaneous mode of delivery facilitates faster absorption of medications into the bloodstream, thereby resulting in a rapid therapeutic action than the other delivery systems.
By Type of Material, Stainless Steel Segment is Likely to Dominate the Market During the Forecast Period
Based on the type of material, the global needles market is distributed across stainless steel, plastic and others. Notably, stainless steel is the preferred material for manufacturing needles owing to its high strength and durability and thus, it is likely to dominate the needles market during the forecast period.
Currently, Hospitals and Clinics Segment Hold the Largest Share of the Needles Market
Based on the end users, the global needles market is segmented into hospitals and clinics, diagnostic centres, home healthcare and others. Currently, the hospitals and clinics segment hold the highest share of the overall market, owing to the increasing number of healthcare facilities in emerging economies. Notably, this trend is unlikely to change during the forecast period.
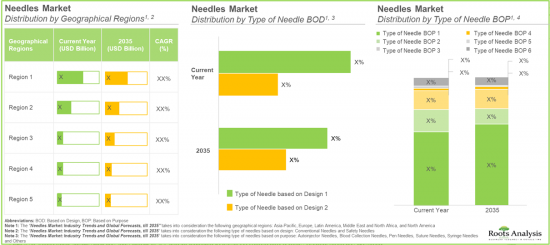
Asia-Pacific Accounts for the Largest Share of the Market
Based on geographical regions, the global needles market is segmented into North America, Europe, Asia-Pacific, Middle East and North Africa, and Latin America. In the current scenario, Asia-Pacific is likely to capture the largest market share which can be attributed to the growing investment in research and development within the medical devices sector in this region.
Example Players in the Needles Market
- BD
- Medtronic
- Olympus
- Themo Fisher Scientific
- B. Braun
- BIOTRONIK
- Gerresheimer
- Novo Nordisk
- Roche
- Lars Medicare
- SB-KAWASUMI LABORATORIES
- Wuzhou Medical
- Aleda Makina
- DALI Medical Devices
- Geotek
- MEDEREN Neotech
NEEDLES MARKET: RESEARCH COVERAGE
The report on needles market features insights on various sections, including:
- Market Sizing and Opportunity Analysis: An in-depth analysis of the needles market, focusing on key market segments, including [A] type of needle based on design, [B] type of needle based on purpose, [C] mode of delivery, [D] type of material, [E] end user, [F] geographical region and [G] leading players.
- Market Impact Analysis: A thorough analysis of various factors, such as drivers, restraints, opportunities, and existing challenges that are likely to impact market growth.
- Needle Providers Market Landscape: A comprehensive evaluation of the companies engaged in this domain, based on several relevant parameters, such as [A] company size, [B] location of headquarters, [C] location of manufacturing unit, [D] type of needle based on design, [E] type of needle based on usability, [F] type of material, [G] type of needle based on purpose. Additionally, this section also features analyses of these companies based on [A] mode of delivery and [B] end-users.
- Company Competitiveness Analysis: An insightful competitiveness analysis of needle providers based on various relevant parameters, such as [A] company strength, [B] portfolio strength, and [C] portfolio diversity.
- Company Profiles: Elaborate profiles of prominent needle providers across various geographies, including North America, Europe, Asia-Pacific and Middle East and North Africa and rest of the world, providing details on [A] company overview, [B] financial information (if available), [C] needles product portfolio, [D] recent developments and [E] an informed future outlook.
- Partnerships and Collaborations: An insightful analysis of the deals inked by stakeholders in needles market, based on several parameters, such as [A] year of partnership, [B] type of partnership, [C] type of partner, [D] type of needle based on design, [E] type of needle based on purpose, [F] most active players and [G] geographical distribution of partnership activity.
- Patent Analysis: An in-depth analysis of patents filed / granted till date in the needles domain, based on various relevant parameters, such as [A] type of patent, [B] publication year, [C] CPC symbols, [D] patent jurisdiction, [E] type of applicant, [F] leading industry players, [G] patent benchmarking, [H] patent valuation analysis, and [I] leading patents.
KEY QUESTIONS ANSWERED IN THIS REPORT
- How many companies are currently engaged in this market?
- Which are the leading companies in this market?
- What factors are likely to influence the evolution of this market?
- What is the current and future market size?
- What is the CAGR of this market?
- How is the current and future market opportunity likely to be distributed across key market segments?
- What type of partnership models are commonly adopted by industry stakeholders?
- What is the patent filing activity in the market?
REASONS TO BUY THIS REPORT
- The report provides a comprehensive market analysis, offering detailed revenue projections of the overall market and its specific sub-segments. This information is valuable to both established market leaders and emerging entrants.
- Stakeholders can leverage the report to gain a deeper understanding of the competitive dynamics within the market. By analyzing the competitive landscape, businesses can make informed decisions to optimize their market positioning and develop effective go-to-market strategies.
- The report offers stakeholders a comprehensive overview of the market, including key drivers, barriers, opportunities, and challenges. This information empowers stakeholders to stay abreast of market trends and make data-driven decisions to capitalize on growth prospects.
ADDITIONAL BENEFITS
- Complimentary PPT Insights Packs
- Complimentary Excel Data Packs for all Analytical Modules in the Report
- 10% Free Content Customization
- Detailed Report Walkthrough Session with Research Team
- Free Updated report if the report is 6-12 months old or older
TABLE OF CONTENTS
1. PREFACE
- 1.1. Introduction
- 1.2. Market Share Insights
- 1.3. Key Market Insights
- 1.4. Report Coverage
- 1.5. Key Questions Answered
- 1.6. Chapter Outlines
2. RESEARCH METHODOLOGY
- 2.1. Chapter Overview
- 2.2. Research Assumptions
- 2.2.1. Market Landscape and Market Trends
- 2.2.2. Market Forecast and Opportunity Analysis
- 2.2.3. Comparative Analysis
- 2.3. Database Building
- 2.3.1. Data Collection
- 2.3.2. Data Validation
- 2.3.3. Data Analysis
- 2.4. Project Methodology
- 2.4.1. Secondary Research
- 2.4.1.1. Annual Reports
- 2.4.1.2. Academic Research Papers
- 2.4.1.3. Company Websites
- 2.4.1.4. Investor Presentations
- 2.4.1.5. Regulatory Filings
- 2.4.1.6. White Papers
- 2.4.1.7. Industry Publications
- 2.4.1.8. Conferences and Seminars
- 2.4.1.9. Government Portals
- 2.4.1.10. Media and Press Releases
- 2.4.1.11. Newsletters
- 2.4.1.12. Industry Databases
- 2.4.1.13. Roots Proprietary Databases
- 2.4.1.14. Paid Databases and Sources
- 2.4.1.15. Social Media Portals
- 2.4.1.16. Other Secondary Sources
- 2.4.2. Primary Research
- 2.4.2.1. Types of Primary Research
- 2.4.2.1.1. Qualitative Research
- 2.4.2.1.2. Quantitative Research
- 2.4.2.1.3. Hybrid Approach
- 2.4.2.2. Advantages of Primary Research
- 2.4.2.3. Techniques for Primary Research
- 2.4.2.3.1. Interviews
- 2.4.2.3.2. Surveys
- 2.4.2.3.3. Focus Groups
- 2.4.2.3.4. Observational Research
- 2.4.2.3.5. Social Media Interactions
- 2.4.2.4. Key Opinion Leaders Considered in Primary Research
- 2.4.2.4.1. Company Executives (CXOs)
- 2.4.2.4.2. Board of Directors
- 2.4.2.4.3. Company Presidents and Vice Presidents
- 2.4.2.4.4. Research and Development Heads
- 2.4.2.4.5. Technical Experts
- 2.4.2.4.6. Subject Matter Experts
- 2.4.2.4.7. Scientists
- 2.4.2.4.8. Doctors and Other Healthcare Providers
- 2.4.2.5. Ethics and Integrity
- 2.4.2.5.1. Research Ethics
- 2.4.2.5.2. Data Integrity
- 2.4.2.1. Types of Primary Research
- 2.4.3. Analytical Tools and Databases
- 2.4.1. Secondary Research
- 2.5. Robust Quality Control
3. MARKET DYNAMICS
- 3.1. Chapter Overview
- 3.2. Forecast Methodology
- 3.2.1. Top-down Approach
- 3.2.2. Bottom-up Approach
- 3.2.3. Hybrid Approach
- 3.3. Market Assessment Framework
- 3.3.1. Total Addressable Market (TAM)
- 3.3.2. Serviceable Addressable Market (SAM)
- 3.3.3. Serviceable Obtainable Market (SOM)
- 3.3.4. Currently Acquired Market (CAM)
- 3.4. Forecasting Tools and Techniques
- 3.4.1. Qualitative Forecasting
- 3.4.2. Correlation
- 3.4.3. Regression
- 3.4.4. Extrapolation
- 3.4.5. Convergence
- 3.4.6. Sensitivity Analysis
- 3.4.7. Scenario Planning
- 3.4.8. Data Visualization
- 3.4.9. Time Series Analysis
- 3.4.10. Forecast Error Analysis
- 3.5. Key Considerations
- 3.5.1. Demographics
- 3.5.2. Government Regulations
- 3.5.3. Reimbursement Scenarios
- 3.5.4. Market Access
- 3.5.5. Supply Chain
- 3.5.6. Industry Consolidation
- 3.5.7. Pandemic / Unforeseen Disruptions Impact
- 3.6. Limitations
4. MACRO-ECONOMIC INDICATORS
- 4.1. Chapter Overview
- 4.2. Market Dynamics
- 4.2.1. Time Period
- 4.2.1.1. Historical Trends
- 4.2.1.2. Current and Forecasted Estimates
- 4.2.2. Currency Coverage
- 4.2.2.1. Major Currencies Affecting the Market
- 4.2.2.2. Factors Affecting Currency Fluctuations
- 4.2.2.3. Impact of Currency Fluctuations on the Industry
- 4.2.3. Foreign Currency Exchange Rate
- 4.2.3.1. Impact of Foreign Exchange Rate Volatility on the Market
- 4.2.3.2. Strategies for Mitigating Foreign Exchange Risk
- 4.2.4. Recession
- 4.2.4.1. Assessment of Current Economic Conditions and Potential Impact on the Market
- 4.2.4.2. Historical Analysis of Past Recessions and Lessons Learnt
- 4.2.5. Inflation
- 4.2.5.1. Measurement and Analysis of Inflationary Pressures in the Economy
- 4.2.5.2. Potential Impact of Inflation on the Market Evolution
- 4.2.6. Interest Rates
- 4.2.6.1. Interest Rates and Their Impact on the Market
- 4.2.6.2. Strategies for Managing Interest Rate Risk
- 4.2.7. Commodity Flow Analysis
- 4.2.7.1. Type of Commodity
- 4.2.7.2. Origins and Destinations
- 4.2.7.3. Values and Weights
- 4.2.7.4. Modes of Transportation
- 4.2.8. Global Trade Dynamics
- 4.2.8.1. Import Scenario
- 4.2.8.2. Export Scenario
- 4.2.8.3. Trade Policies
- 4.2.8.4. Strategies for Mitigating the Risks Associated with Trade Barriers
- 4.2.8.5. Impact of Trade Barriers on the Market
- 4.2.9. War Impact Analysis
- 4.2.9.1. Russian-Ukraine War
- 4.2.9.2. Israel-Hamas War
- 4.2.10. COVID Impact / Related Factors
- 4.2.10.1. Global Economic Impact
- 4.2.10.2. Industry-specific Impact
- 4.2.10.3. Government Response and Stimulus Measures
- 4.2.10.4. Future Outlook and Adaptation Strategies
- 4.2.11. Other Indicators
- 4.2.11.1. Fiscal Policy
- 4.2.11.2. Consumer Spending
- 4.2.11.3. Gross Domestic Product (GDP)
- 4.2.11.4. Employment
- 4.2.11.5. Taxes
- 4.2.11.6. Stock Market Performance
- 4.2.11.7. Cross-Border Dynamics
- 4.2.1. Time Period
- 4.3. Conclusion
5. EXECUTIVE SUMMARY
6. INTRODUCTION
- 6.1. Chapter Overview
- 6.2. Evolution of Needles
- 6.3. Components of a Needle
- 6.4. Types of Needles
- 6.5. Uses of Needles Across Various Healthcare Sectors
- 6.6. Challenges Associated with Needle Usage
- 6.7. Future Perspectives
7. MARKET LANDSCAPE
- 7.1. Chapter Overview
- 7.2. Needle Providers: Overall Market Landscape
- 7.2.1. Analysis by Year of Establishment
- 7.2.2. Analysis by Company Size
- 7.2.3. Analysis by Location of Headquarters (Region)
- 7.2.4. Analysis by Location of Headquarters (Country)
- 7.2.5. Analysis by Company Size and Location of Headquarters (Region)
- 7.2.6. Analysis by Location of Manufacturing Unit
- 7.3. Needles: Overall Market Landscape
- 7.3.1. Analysis by Type of Needle based on Design
- 7.3.2. Analysis by Type of Needle based on Usability
- 7.3.3. Analysis by Type of Material
- 7.3.4. Analysis by Type of Needle based on Purpose
- 7.3.5. Analysis by Type of Needle based on Design and Purpose
- 7.3.6. Analysis by Type of Needle based on Usability and Purpose
- 7.3.7. Analysis by Mode of Delivery
- 7.3.8. Analysis by Type of Needle based on Purpose and Mode of Delivery
- 7.3.9. Analysis by End Users
8. COMPANY COMPETITIVENESS ANALYSIS
- 8.1. Chapter Overview
- 8.2. Assumptions and Key Parameters
- 8.3. Methodology
- 8.4. Company Competitiveness Analysis: Needle Providers
- 8.4.1. Needle Providers based in North America (Peer Group I)
- 8.4.2. Needle Providers based in Europe (Peer Group II)
- 8.4.3. Needle Providers based in Asia-Pacific (Peer Group III)
- 8.4.4. Needle Providers based in Middle East and North Africa and Rest of the World (Peer Group IV)
9. COMPANY PROFILES: NEEDLE PROVIDERS BASED IN NORTH AMERICA
- 9.1. Chapter Overview
- 9.2. BD
- 9.2.1. Company Overview
- 9.2.2. Financial Information
- 9.2.3. Needle Portfolio
- 9.2.4. Recent Developments and Future Outlook
- 9.3. Medtronic
- 9.4. Olympus America
- 9.5. Thermo Fisher Scientific
10. COMPANY PROFILES: NEEDLE PROVIDERS BASED IN EUROPE
- 10.1. Chapter Overview
- 10.2. B. Braun
- 10.2.1. Company Overview
- 10.2.2. Financial Information
- 10.2.3. Needle Portfolio
- 10.2.4. Recent Developments and Future Outlook
- 10.3. Biotronik
- 10.4. Gerresheimer
- 10.5. Novo Nordisk
- 10.6. Roche
11. COMPANY PROFILES: NEEDLE PROVIDERS BASED IN ASIA-PACIFIC
- 11.1. Chapter Overview
- 11.2. Lars Medicare
- 11.2.1. Company Overview
- 11.2.2. Financial Information
- 11.2.3. Needle Portfolio
- 11.2.4. Recent Developments and Future Outlook
- 11.3. SB-KAWASUMI LABORATORIES
- 11.4. Wuzhou Medical
12. COMPANY PROFILES: NEEDLE PROVIDERS BASED IN MIDDLE EAST AND NORTH AFRICA, AND REST OF THE WORLD
- 12.1. Chapter Overview
- 12.2. Aleda Makina
- 12.2.1. Company Overview
- 12.2.2. Financial Information
- 12.2.3. Needle Portfolio
- 12.2.4. Recent Developments and Future Outlook
- 12.3. DALI Medical Devices
- 12.4. GEOTEK
- 12.5. MEDEREN Neotech
13. PARTNERSHIPS AND COLLABORATIONS
- 13.1. Chapter Overview
- 13.2. Partnership Models
- 13.3. Needle Providers: Partnerships and Collaborations
- 13.3.1. Analysis by Year of Partnership
- 13.3.2. Analysis by Type of Partnership
- 13.3.3. Analysis by Year and Type of Partnership
- 13.3.4. Analysis by Type of Partner
- 13.3.5. Analysis by Type of Needle based on Design
- 13.3.6. Analysis by Type of Needle Based on Purpose
- 13.3.7. Most Active Players: Distribution by Number of Partnerships
- 13.3.8. Analysis by Geography
- 13.3.8.1. Local and International Agreements
- 13.3.8.2. Intracontinental and Intercontinental Agreements
14. PATENT ANALYSIS
- 14.1. Chapter Overview
- 14.2. Scope and Methodology
- 14.3. Needles: Patent Analysis
- 14.3.1. Analysis by Patent Publication Year
- 14.3.2. Analysis by Type of Patent and Publication Year
- 14.3.3. Analysis by Patent Application Year
- 14.3.4. Analysis by Patent Jurisdiction
- 14.3.5. Analysis by CPC Symbols
- 14.3.6. Analysis by Type of Applicant
- 14.3.7. Leading Industry Players: Analysis by Number of Patents
- 14.4. Patent Benchmarking Analysis
- 14.4.1. Analysis by Patent Characteristics
- 14.5. Patent Valuation
- 14.6. Leading Patents by Number of Citations
15. MARKET IMPACT ANALYSIS
- 15.1. Chapter Overview
- 15.2. Market Drivers
- 15.3. Market Restraints
- 15.4. Market Opportunities
- 15.5. Market Challenges
- 15.6. Conclusion
16. GLOBAL NEEDLES MARKET
- 16.1. Chapter Overview
- 16.2. Key Assumptions and Methodology
- 16.3. Global Needles Market, Historical Trends (Since 2019) and Forecasted Estimates (Till 2035)
- 16.3.1. Scenario Analysis
- 16.3.1.1. Conservative Scenario
- 16.3.1.2. Optimistic Scenario
- 16.3.1. Scenario Analysis
- 16.4. Key Market Segmentations
17. NEEDLES MARKET, BY TYPE OF NEEDLE BASED ON DESIGN
- 17.1. Chapter Overview
- 17.2. Key Assumptions and Methodology
- 17.3. Needles Market: Distribution by Type of Needle based on Design
- 17.3.1. Needles Market for Conventional Needles, Historical Trends (Since 2019) and Forecasted Estimates (Till 2035)
- 17.3.2. Needles Market for Safety Needles, Historical Trends (Since 2019) and Forecasted Estimates (Till 2035)
- 17.4. Data Triangulation and Validation
18. NEEDLES MARKET, BY TYPE OF NEEDLE BASED ON PURPOSE
- 18.1. Chapter Overview
- 18.2. Key Assumptions and Methodology
- 18.3. Needles Market: Distribution by Type of Needle based on Purpose
- 18.3.1. Needles Market for Syringe Needles, Historical Trends (Since 2019) and Forecasted Estimates (Till 2035)
- 18.3.2. Needles Market for Suture Needles, Historical Trends (Since 2019) and Forecasted Estimates (Till 2035)
- 18.3.3. Needles Market for Pen Needles, Historical Trends (Since 2019) and Forecasted Estimates (Till 2035)
- 18.3.4. Needles Market for Autoinjector Needles, Historical Trends (Since 2019) and Forecasted Estimates (Till 2035)
- 18.3.5. Needles Market for Blood Collection Needles, Historical Trends (Since 2019) and Forecasted Estimates (Till 2035)
- 18.3.6. Needles Market for Others, Historical Trends (Since 2019) and Forecasted Estimates (Till 2035)
- 18.4. Data Triangulation and Validation
19. NEEDLES MARKET, BY MODE OF DELIVERY
- 19.1. Chapter Overview
- 19.2. Key Assumptions and Methodology
- 19.3. Needles Market: Distribution by Mode of Delivery
- 19.3.1. Needles Market for Subcutaneous Mode, Historical Trends (Since 2019) and Forecasted Estimates (Till 2035)
- 19.3.2. Needles Market for Intramuscular Mode, Historical Trends (Since 2019) and Forecasted Estimates (Till 2035)
- 19.3.3. Needles Market for Intravenous Mode, Historical Trends (Since 2019) and Forecasted Estimates (Till 2035)
- 19.3.4. Needles Market for Intradermal Mode, Historical Trends (Since 2019) and Forecasted Estimates (Till 2035)
- 19.3.5. Needles Market for Others, Historical Trends (Since 2019) and Forecasted Estimates (Till 2035)
- 19.4. Data Triangulation and Validation
20. NEEDLES MARKET, BY TYPE OF MATERIAL
- 20.1. Chapter Overview
- 20.2. Key Assumptions and Methodology
- 20.3. Needles Market: Distribution by Type of Material
- 20.3.1. Needles Market for Stainless Steel, Historical Trends (Since 2019) and Forecasted Estimates (Till 2035)
- 20.3.2. Needles Market for Plastic, Historical Trends (Since 2019) and Forecasted Estimates (Till 2035)
- 20.3.3. Needles Market for Others, Historical Trends (Since 2019) and Forecasted Estimates (Till 2035)
- 20.4. Data Triangulation and Validation
21. NEEDLES MARKET, BY END USERS
- 21.1. Chapter Overview
- 21.2. Key Assumptions and Methodology
- 21.3. Needles Market: Distribution by End Users
- 21.3.1. Needles Market for Hospitals and Clinics, Historical Trends (Since 2019) and Forecasted Estimates (Till 2035)
- 21.3.2. Needles Market for Diagnostic Centers, Historical Trends (Since 2019) and Forecasted Estimates (Till 2035)
- 21.3.3. Needles Market for Home Healthcare, Historical Trends (Since 2019) and Forecasted Estimates (Till 2035)
- 21.3.4. Needles Market for Others, Historical Trends (Since 2019) and Forecasted Estimates (Till 2035)
- 21.4. Data Triangulation and Validation
22. NEEDLES MARKET, BY GEOGRAPHICAL REGIONS
- 22.1. Chapter Overview
- 22.2. Key Assumptions and Methodology
- 22.3. Needles Market: Distribution by Geographical Regions
- 22.3.1. Needles Market in North America, Historical Trends (Since 2019) and Forecasted Estimates (Till 2035)
- 22.3.1.1. Needles Market in the US, Historical Trends (Since 2019) and Forecasted Estimates (Till 2035)
- 22.3.1.2. Needles Market in Canada, Historical Trends (Since 2019) and Forecasted Estimates (Till 2035)
- 22.3.1.3. Needles Market in Mexico, Historical Trends (Since 2019) and Forecasted Estimates (Till 2035)
- 22.3.2. Needles Market in Europe, Historical Trends (Since 2019) and Forecasted Estimates (Till 2035)
- 22.3.2.1. Needles Market in Germany, Historical Trends (Since 2019) and Forecasted Estimates (Till 2035)
- 22.3.2.2. Needles Market in France, Historical Trends (Since 2019) and Forecasted Estimates (Till 2035)
- 22.3.2.3. Needles Market in the UK, Historical Trends (Since 2019) and Forecasted Estimates (Till 2035)
- 22.3.2.4. Needles Market in Italy, Historical Trends (Since 2019) and Forecasted Estimates (Till 2035)
- 22.3.2.5. Needles Market in Spain, Historical Trends (Since 2019) and Forecasted Estimates (Till 2035)
- 22.3.2.6. Needles Market in Rest of Europe, Historical Trends (Since 2019) and Forecasted Estimates (Till 2035)
- 22.3.3. Needles Market in Asia-Pacific, Historical Trends (Since 2019) and Forecasted Estimates (Till 2035)
- 22.3.3.1. Needles Market in China, Historical Trends (Since 2019) and Forecasted Estimates (Till 2035)
- 22.3.3.2. Needles Market in India, Historical Trends (Since 2019) and Forecasted Estimates (Till 2035)
- 22.3.3.3. Needles Market in Japan, Historical Trends (Since 2019) and Forecasted Estimates (Till 2035)
- 22.3.3.4. Needles Market in Rest of Asia Pacific, Historical Trends (Since 2019) and Forecasted Estimates (Till 2035)
- 22.3.4. Needles Market in Middle East and North Africa, Historical Trends (Since 2019) and Forecasted Estimates (Till 2035)
- 22.3.4.1. Needles Market in Egypt, Historical Trends (Since 2019) and Forecasted Estimates (Till 2035)
- 22.3.4.2. Needles Market in Saudi Arabia, Historical Trends (Since 2019) and Forecasted Estimates (Till 2035)
- 22.3.4.3. Needles Market in UAE, Historical Trends (Since 2019) and Forecasted Estimates (Till 2035)
- 22.3.5. Needles Market in Latin America, Historical Trends (Since 2019) and Forecasted Estimates (Till 2035)
- 22.3.5.1. Needles Market in Brazil, Historical Trends (Since 2019) and Forecasted Estimates (Till 2035)
- 22.3.5.2. Needles Market in Argentina, Historical Trends (Since 2019) and Forecasted Estimates (Till 2035)
- 22.3.1. Needles Market in North America, Historical Trends (Since 2019) and Forecasted Estimates (Till 2035)
- 22.4. Needles Market by Geographical Regions: Market Dynamics Assessment
- 22.4.1. Market Movement Analysis
- 22.4.2. Penetration Growth (P-G) Matrix
- 22.4.3. Data Triangulation and Validation
23. NEEDLES MARKET, LEADING PLAYERS
- 23.1. Chapter Overview
- 23.2. Key Assumptions and Methodology
- 23.3. Needles Market: Distribution by Leading Players
- 23.4. Data Triangulation and Validation
24. CONCLUDING REMARKS
25. EXECUTIVE INSIGHTS
26. APPENDIX I: TABULATED DATA
27. APPENDIX II: LIST OF COMPANIES AND ORGANIZATIONS
List of Tables
- Table 7.1 Needle Providers: Information on Year of Establishment, Company Size, Location of Headquarters and Manufacturing Unit
- Table 7.2 Needle Providers: Information on Type of Needle based on Design, Type of Needle based on Usability and Type of Material
- Table 7.3 Needle Providers: Information on Type of Needle based on Purpose
- Table 7.4 Needle Providers: Information on Mode of Delivery and End User
- Table 9.1 Needle Providers based in North America: List of Companies Profiled
- Table 9.2 BD: Company Overview
- Table 9.3 BD: Needle Portfolio
- Table 9.4 BD: Recent Developments and Future Outlook
- Table 9.5 Medtronic: Company Overview
- Table 9.6 Medtronic: Needle Portfolio
- Table 9.8 Olympus America: Company Overview
- Table 9.9 Olympus America: Needle Portfolio
- Table 9.10 Thermo Fisher Scientific: Company Overview
- Table 9.11 Thermo Fisher Scientific: Needle Portfolio
- Table 10.1 Needle Providers based in Europe: List of Companies Profiled
- Table 10.2 B. Braun: Company Overview
- Table 10.3 B. Braun: Needle Portfolio
- Table 10.4 Biotronik: Company Overview
- Table 10.5 Biotronik: Needle Portfolio
- Table 10.6 Gerresheimer: Company Overview
- Table 10.7 Gerresheimer: Needle Portfolio
- Table 10.8 Novo Nordisk: Company Overview
- Table 10.9 Novo Nordisk: Needle Portfolio
- Table 10.10 Novo Nordisk: Recent Developments and Future Outlook
- Table 10.11 Roche: Company Overview
- Table 10.12 Roche: Needle Portfolio
- Table 11.1 Needle Providers based in Asia-Pacific: List of Companies Profiled
- Table 11.2 Lars Medicare: Company Overview
- Table 11.3 Lars Medicare: Needle Portfolio
- Table 11.4 SB-KAWASUMI LABORATORIES: Company Overview
- Table 11.5 SB-KAWASUMI LABORATORIES: Needle Portfolio
- Table 11.6 Wuzhou Medical: Company Overview
- Table 11.7 Wuzhou Medical: Needle Portfolio
- Table 12.1 Needle Providers based in Middle East and North Africa and Rest of the World: List of Companies Profiled
- Table 12.2 Aleda Makina: Company Overview
- Table 12.3 Aleda Makina: Needle Portfolio
- Table 12.4 DALI Medical Devices: Company Overview
- Table 12.5 DALI Medical Devices: Needle Portfolio
- Table 12.6 GEOTEK: Company Overview
- Table 12.7 GEOTEK: Needle Portfolio
- Table 12.8 MEDEREN Neotech: Company Overview
- Table 12.9 MEDEREN Neotech: Needle Portfolio
- Table 13.1 Needle Providers: List of Partnerships and Collaborations, since 2020
- Table 13.2 Partnerships and Collaborations: Information on Location of Headquarters (Country and Region) and Type of Agreement (Country and Region)
- Table 14.1 Patent Analysis: Top CPC Sections
- Table 14.2 Patent Analysis: Top CPC Symbols
- Table 14.3 Patent Analysis: Top CPC Codes
- Table 14.4 Patent Analysis: Summary of Benchmarking Analysis
- Table 14.5 Patent Analysis: Categorization based on Weighted Valuation Scores
- Table 14.6 Patent Portfolio: List of Leading Patents (by Highest Relative Valuation)
- Table 14.7 Patent Portfolio: List of Leading Patents (by Number of Citations)
- Table 26.1 Needle Providers: Distribution by Year of Establishment
- Table 26.2 Needle Providers: Distribution by Company Size
- Table 26.3 Needle Providers: Distribution by Location of Headquarters (Region)
- Table 26.4 Needle Providers: Distribution by Location of Headquarters (Country)
- Table 26.5 Needle Providers: Distribution by Company Size and Location of Headquarters (Region)
- Table 26.6 Needle Providers: Distribution by Location of Manufacturing Unit
- Table 26.7 Needle Providers: Distribution by Type of Needle based on Design
- Table 26.8 Needle Providers: Distribution by Type of Needle based on Usability
- Table 26.9 Needle Providers: Distribution by Type of Material
- Table 26.10 Needle Providers: Distribution by Type of Needle based on Purpose
- Table 26.11 Needle Providers: Distribution by Type of Needle based on Design and Purpose
- Table 26.12 Needle Providers: Distribution by Type of Needle based on Usability and Purpose
- Table 26.13 Needle Providers: Distribution by Mode of Delivery
- Table 26.14 Needle Providers: Distribution by Type of Needle based on Purpose and Mode of Delivery
- Table 26.15 Needle Providers: Distribution by End Users
- Table 26.16 BD: Business Segment-wise Revenues and Consolidated Financial Details (USD Billion)
- Table 26.17 Medtronic: Business Segment-wise Revenues and Consolidated Financial Details (USD Billion)
- Table 26.18 Olympus America: Business Segment-wise Revenues and Consolidated Financial Details (YEN Billion)
- Table 26.19 Thermo Fisher Scientific: Business Segment-wise Revenues and Consolidated Financial Details (USD Billion)
- Table 26.20 B. Braun: Business Segment-wise Revenues and Consolidated Financial Details (EUR Billion)
- Table 26.21 Gerresheimer: Business Segment-wise Revenues and Consolidated Financial Details (EUR Billion)
- Table 26.22 Novo Nordisk: Business Segment-wise Revenues and Consolidated Financial Details (DKK Billion)
- Table 26.23 Roche: Business Segment-wise Revenues and Consolidated Financial Details (CHF Billion)
- Table 26.24 Wuzhou Medical: Consolidated Financial Details (YEN Billion)
- Table 26.25 Partnerships and Collaborations: Cumulative Year-wise Trend, since 2020
- Table 26.26 Partnerships and Collaborations: Distribution by Type of Partnership
- Table 26.27 Partnerships and Collaborations: Distribution by Year and Type of Partnership, since 2020
- Table 26.28 Partnerships and Collaborations: Distribution by Type of Partner
- Table 26.29 Partnerships and Collaborations: Distribution by Type of Needle based on Design
- Table 26.30 Partnerships and Collaborations: Distribution by Type of Needle based on Purpose
- Table 26.31 Most Active Players: Distribution by Number of Partnerships
- Table 26.32 Partnerships and Collaborations: Local and International Agreements
- Table 26.33 Partnerships and Collaborations: Intracontinental and Intercontinental Agreements
- Table 26.34 Patent Analysis: Distribution by Type of Patent
- Table 26.35 Patent Analysis: Cumulative Distribution by Patent Publication Year, since 2022
- Table 26.36 Patent Analysis: Distribution by Type of Patent and Patent Publication Year
- Table 26.37 Patent Analysis: Distribution by Patent Application Year, since 2010
- Table 26.38 Patent Analysis: Patent Jurisdiction
- Table 26.39 Patent Analysis: Cumulative Year-wise Distribution by Type of Applicant, since 2022
- Table 26.40 Leading Industry Players: Distribution by Number of Patents
- Table 26.41 Patent Benchmarking Analysis: Distribution of Patent Characteristics (CPC Codes) by Leading Industry Players
- Table 26.42 Needles: Patent Valuation
- Table 26.43 Global Needles Market, Historical Trends (Since 2019) and Forecasted Estimates (Till 2035) (Billion Units, USD Billion)
- Table 26.44 Global Needles Market, Forecasted Estimates (Till 2035): Conservative Scenario (USD Billion)
- Table 26.45 Global Needles Market, Forecasted Estimates (Till 2035): Optimistic Scenario (USD Billion)
- Table 26.46 Needles Market: Distribution by Type of Needle based on Design
- Table 26.47 Needles Market for Conventional Needles, Historical Trends (Since 2019) and Forecasted Estimates (Till 2035) (USD Billion)
- Table 26.48 Needles Market for Safety Needles, Historical Trends (Since 2019) and Forecasted Estimates (Till 2035) (USD Billion)
- Table 26.49 Needles Market: Distribution by Type of Needle based on Purpose
- Table 26.50 Needles Market for Syring Needles, Historical Trends (Since 2019) and Forecasted Estimates (Till 2035) (Billion Units, USD Billion)
- Table 26.51 Needles Market for Suture Needles, Historical Trends (Since 2019) and Forecasted Estimates (Till 2035) (Billion Units, USD Billion)
- Table 26.52 Needles Market for Pen Needles, Historical Trends (Since 2019) and Forecasted Estimates (Till 2035) (Billion Units, USD Billion)
- Table 26.53 Needles Market for Autoinjector Needles, Historical Trends (Since 2019) and Forecasted Estimates (Till 2035) (Billion Units, USD Billion)
- Table 26.54 Needles Market for Blood Collection Needles, Historical Trends (Since 2019) and Forecasted Estimates (Till 2035) (Billion Units, USD Billion)
- Table 26.55 Needles Market for Others, Historical Trends (Since 2019) and Forecasted Estimates (Till 2035) (USD Billion)
- Table 26.56 Needles Market: Distribution by Mode of Delivery
- Table 26.57 Needles Market for Subcutaneous Mode, Historical Trends (Since 2019) and Forecasted Estimates (Till 2035) (USD Billion)
- Table 26.58 Needles Market for Intramuscular Mode, Historical Trends (Since 2019) and Forecasted Estimates (Till 2035) (USD Billion)
- Table 26.59 Needles Market for Intravenous Mode, Historical Trends (Since 2019) and Forecasted Estimates (Till 2035) (USD Billion)
- Table 26.60 Needles Market for Intradermal Mode, Historical Trends (Since 2019) and Forecasted Estimates (Till 2035) (USD Billion)
- Table 26.61 Needles Market for Others, Historical Trends (Since 2019) and Forecasted Estimates (Till 2035) (USD Billion)
- Table 26.62 Needles Market: Distribution by Type of Material
- Table 26.63 Needles Market for Stainless Steel, Historical Trends (Since 2019) and Forecasted Estimates (Till 2035) (USD Billion)
- Table 26.64 Needles Market for Plastic, Historical Trends (Since 2019) and Forecasted Estimates (Till 2035) (USD Billion)
- Table 26.65 Needles Market for Others, Historical Trends (Since 2019) and Forecasted Estimates (Till 2035) (USD Billion)
- Table 26.66 Needles Market: Distribution by End Users
- Table 26.67 Needles Market for Hospitals and Clinics, Historical Trends (Since 2019) and Forecasted Estimates (Till 2035) (USD Billion)
- Table 26.68 Needles Market for Diagnostic Centers, Historical Trends (Since 2019) and Forecasted Estimates (Till 2035) (USD Billion)
- Table 26.69 Needles Market for Home Healthcare, Historical Trends (Since 2019) and Forecasted Estimates (Till 2035) (USD Billion)
- Table 26.70 Needles Market for Others, Historical Trends (Since 2019) and Forecasted Estimates (Till 2035) (USD Billion)
- Table 26.71 Needles Market: Distribution by Geographical Regions
- Table 26.72 Needles Market in North America, Historical Trends (Since 2019) and Forecasted Estimates (Till 2035) (USD Billion)
- Table 26.73 Needles Market in the US, Historical Trends (Since 2019) and Forecasted Estimates (Till 2035) (USD Billion)
- Table 26.74 Needles Market in Canada, Historical Trends (Since 2019) and Forecasted Estimates (Till 2035) (USD Billion)
- Table 26.75 Needles Market in Mexico, Historical Trends (Since 2019) and Forecasted Estimates (Till 2035) (USD Billion)
- Table 26.76 Needles Market in Europe, Historical Trends (Since 2019) and Forecasted Estimates (Till 2035) (USD Billion)
- Table 26.77 Needles Market in Germany, Historical Trends (Since 2019) and Forecasted Estimates (Till 2035) (USD Billion)
- Table 26.78 Needles Market in France, Historical Trends (Since 2019) and Forecasted Estimates (Till 2035) (USD Billion)
- Table 26.79 Needles Market in the UK, Historical Trends (Since 2019) and Forecasted Estimates (Till 2035) (USD Billion)
- Table 26.80 Needles Market in Italy, Historical Trends (Since 2019) and Forecasted Estimates (Till 2035) (USD Billion)
- Table 26.81 Needles Market in Spain, Historical Trends (Since 2019) and Forecasted Estimates (Till 2035) (USD Billion)
- Table 26.82 Needles Market in Rest of Europe, Historical Trends (Since 2019) and Forecasted Estimates (Till 2035) (USD Billion)
- Table 26.83 Needles Market in Asia-Pacific, Historical Trends (Since 2019) and Forecasted Estimates (Till 2035) (USD Billion)
- Table 26.84 Needles Market in China, Historical Trends (Since 2019) and Forecasted Estimates (Till 2035) (USD Billion)
- Table 26.85 Needles Market in India, Historical Trends (Since 2019) and Forecasted Estimates (Till 2035) (USD Billion)
- Table 26.86 Needles Market in Japan, Historical Trends (Since 2019) and Forecasted Estimates (Till 2035) (USD Billion)
- Table 26.87 Needles Market in Rest of Asia Pacific, Historical Trends (Since 2019) and Forecasted Estimates (Till 2035) (USD Billion)
- Table 26.88 Needles Market in Middle East and North Africa, Historical Trends (Since 2019) and Forecasted Estimates (Till 2035) (USD Billion)
- Table 26.89 Needles Market in Egypt, Historical Trends (Since 2019) and Forecasted Estimates (Till 2035) (USD Billion)
- Table 26.90 Needles Market in Saudi Arabia, Historical Trends (Since 2019) and Forecasted Estimates (Till 2035) (USD Billion)
- Table 26.91 Needles Market in UAE, Historical Trends (Since 2019) and Forecasted Estimates (Till 2035) (USD Billion)
- Table 26.92 Needles Market in Latin America, Historical Trends (Since 2019) and Forecasted Estimates (Till 2035) (USD Billion)
- Table 26.93 Needles Market in Brazil, Historical Trends (Since 2019) and Forecasted Estimates (Till 2035) (USD Billion)
- Table 26.94 Needles Market in Argentina, Historical Trends (Since 2019) and Forecasted Estimates (Till 2035) (USD Billion)
- Table 26.95 Needles Market: Distribution by Leading Players (USD Billion)
List of Figures
- Figure 2.1 Research Methodology: Project Methodology
- Figure 2.2 Research Methodology: Data Sources for Secondary Research
- Figure 2.3 Research Methodology: Robust Quality Control
- Figure 3.1 Market Dynamics: Forecast Methodology
- Figure 3.2 Market Dynamics: Market Assessment Framework
- Figure 4.1 Lessons Learnt from Past Recessions
- Figure 5.1 Executive Summary: Market Landscape
- Figure 5.2 Executive Summary: Partnerships and Collaborations
- Figure 5.3 Executive Summary: Patent Analysis
- Figure 5.4 Executive Summary: Market Sizing and Opportunity Analysis
- Figure 6.1 Evolution of Needles
- Figure 6.2 Components of a Needle
- Figure 6.3 Types of Needles
- Figure 6.4 Uses of Needles Across Various Healthcare Domains
- Figure 6.5 Challenges Associated with Needle Usage
- Figure 7.1 Needle Providers: Distribution by Year of Establishment
- Figure 7.2 Needle Providers: Distribution by Company Size
- Figure 7.3 Needle Providers: Distribution by Location of Headquarters (Region)
- Figure 7.4 Needle Providers: Distribution by Location of Headquarters (Country)
- Figure 7.5 Needle Providers: Distribution by Company Size and Location of Headquarters (Region)
- Figure 7.6 Needle Providers: Distribution by Location of Manufacturing Unit
- Figure 7.7 Needle Providers: Distribution by Type of Needle based on Design
- Figure 7.8 Needle Providers: Distribution by Type of Needle based on Usability
- Figure 7.9 Needle Providers: Distribution by Type of Material
- Figure 7.10 Needle Providers: Distribution by Type of Needle based on Purpose
- Figure 7.11 Needle Providers: Distribution by Type of Needle based on Design and Purpose
- Figure 7.12 Needle Providers: Distribution by Type of Needle based on Usability and Purpose
- Figure 7.13 Needle Providers: Distribution by Mode of Delivery
- Figure 7.14 Needle Providers: Distribution by Type of Needle based on Purpose and Mode of Delivery
- Figure 7.15 Needle Providers: Distribution by End Users
- Figure 8.1 Company Competitiveness Analysis: Needle Providers based in North America (Peer Group I)
- Figure 8.2 Company Competitiveness Analysis: Needle Providers based in Europe (Peer Group II)
- Figure 8.3 Company Competitiveness Analysis: Needle Providers based in Asia-Pacific (Peer Group III)
- Figure 8.4 Company Competitiveness Analysis: Needle Providers based in Middle East and North Africa and Rest of the World (Peer Group IV)
- Figure 9.1 BD: Business Segment-wise Revenues and Consolidated Financial Details (USD Billion)
- Figure 9.2 Medtronic: Business Segment-wise Revenues and Consolidated Financial Details (USD Billion)
- Figure 9.3 Olympus America: Business Segment-wise Revenues and Consolidated Financial Details (YEN Billion)
- Figure 9.4 Thermo Fisher Scientific: Business Segment-wise Revenues and Consolidated Financial Details (USD Billion)
- Figure 10.1 B. Braun: Business Segment-wise Revenues and Consolidated Financial Details (EUR Billion)
- Figure 10.2 Gerresheimer: Business Segment-wise Revenues and Consolidated Financial Details (EUR Billion)
- Figure 10.3 Novo Nordisk: Business Segment-wise Revenues and Consolidated Financial Details (DKK Billion)
- Figure 10.4 Roche: Business Segment-wise Revenues and Consolidated Financial Details (CHF Billion)
- Figure 11.1 Wuzhou Medical: Consolidated Financial Details (YEN Billion)
- Figure 13.1 Partnerships and Collaborations: Cumulative Year-wise Trend, since 2020
- Figure 13.2 Partnerships and Collaborations: Distribution by Type of Partnership
- Figure 13.3 Partnerships and Collaborations: Distribution by Year and Type of Partnership, since 2020
- Figure 13.4 Partnerships and Collaborations: Distribution by Type of Partner
- Figure 13.5 Partnerships and Collaborations: Distribution by Type of Needle based on Design
- Figure 13.6 Partnerships and Collaborations: Distribution by Type of Needle based on Purpose
- Figure 13.7 Most Active Players: Distribution by Number of Partnerships
- Figure 13.8 Partnerships and Collaborations: Local and International Agreements
- Figure 13.9 Partnerships and Collaborations: Intracontinental and Intercontinental Agreements
- Figure 14.1 Patent Analysis: Distribution by Type of Patent
- Figure 14.2 Patent Analysis: Cumulative Distribution by Patent Publication Year, since 2022
- Figure 14.3 Patent Analysis: Distribution by Type of Patent and Patent Publication Year
- Figure 14.4 Patent Analysis: Distribution by Patent Application Year, since 2010
- Figure 14.5 Patent Analysis: Patent Jurisdiction
- Figure 14.6 Patent Analysis: Distribution by CPC Symbols
- Figure 14.7 Patent Analysis: Cumulative Year-wise Distribution by Type of Applicant, since 2022
- Figure 14.8 Leading Industry Players: Distribution by Number of Patents
- Figure 14.9 Patent Benchmarking Analysis: Distribution of Patent Characteristics (CPC Codes) by Leading Industry Players
- Figure 14.10 Patent Benchmarking Analysis: Distribution of Leading Industry Players by Patent Characteristics (CPC Codes)
- Figure 14.11 Patent Analysis: Distribution by Patent Age
- Figure 14.12 Needles: Patent Valuation
- Figure 16.1 Global Needles Market, Historical Trends (Since 2019) and Forecasted Estimates (Till 2035) (Billion Units, USD Billion)
- Figure 16.2 Global Needles Market, Forecasted Estimates (Till 2035): Conservative Scenario (USD Billion)
- Figure 16.3 Global Needles Market, Forecasted Estimates (Till 2035): Optimistic Scenario (USD Billion)
- Figure 17.1 Needles Market: Distribution by Type of Needle based on Design
- Figure 17.2 Needles Market for Conventional Needles, Historical Trends (Since 2019) and Forecasted Estimates (Till 2035) (USD Billion)
- Figure 17.3 Needles Market for Safety Needles, Historical Trends (Since 2019) and Forecasted Estimates (Till 2035) (USD Billion)
- Figure 18.1 Needles Market: Distribution by Type of Needle based on Purpose
- Figure 18.2 Needles Market for Syring Needles, Historical Trends (Since 2019) and Forecasted Estimates (Till 2035) (Billion Units, USD Billion)
- Figure 18.3 Needles Market for Suture Needles, Historical Trends (Since 2019) and Forecasted Estimates (Till 2035) (Billion Units, USD Billion)
- Figure 18.4 Needles Market for Pen Needles, Historical Trends (Since 2019) and Forecasted Estimates (Till 2035) (Billion Units, USD Billion)
- Figure 18.5 Needles Market for Autoinjector Needles, Historical Trends (Since 2019) and Forecasted Estimates (Till 2035) (Billion Units, USD Billion)
- Figure 18.6 Needles Market for Blood Collection Needles, Historical Trends (Since 2019) and Forecasted Estimates (Till 2035) (Billion Units, USD Billion)
- Figure 18.7 Needles Market for Others, Historical Trends (Since 2019) and Forecasted Estimates (Till 2035) (USD Billion)
- Figure 19.1 Needles Market: Distribution by Mode of Delivery
- Figure 19.2 Needles Market for Subcutaneous Mode, Historical Trends (Since 2019) and Forecasted Estimates (Till 2035) (USD Billion)
- Figure 19.3 Needles Market for Intramuscular Mode, Historical Trends (Since 2019) and Forecasted Estimates (Till 2035) (USD Billion)
- Figure 19.4 Needles Market for Intravenous Mode, Historical Trends (Since 2019) and Forecasted Estimates (Till 2035) (USD Billion)
- Figure 19.5 Needles Market for Intradermal Mode, Historical Trends (Since 2019) and Forecasted Estimates (Till 2035) (USD Billion)
- Figure 19.6 Needles Market for Others, Historical Trends (Since 2019) and Forecasted Estimates (Till 2035) (USD Billion)
- Figure 20.1 Needles Market: Distribution by Type of Material
- Figure 20.2 Needles Market for Stainless Steel, Historical Trends (Since 2019) and Forecasted Estimates (Till 2035) (USD Billion)
- Figure 20.3 Needles Market for Plastic, Historical Trends (Since 2019) and Forecasted Estimates (Till 2035) (USD Billion)
- Figure 20.4 Needles Market for Others, Historical Trends (Since 2019) and Forecasted Estimates (Till 2035) (USD Billion)
- Figure 21.1 Needles Market: Distribution by End Users
- Figure 21.2 Needles Market for Hospitals and Clinics, Historical Trends (Since 2019) and Forecasted Estimates (Till 2035) (USD Billion)
- Figure 21.3 Needles Market for Diagnostic Centers, Historical Trends (Since 2019) and Forecasted Estimates (Till 2035) (USD Billion)
- Figure 21.4 Needles Market for Home Healthcare, Historical Trends (Since 2019) and Forecasted Estimates (Till 2035) (USD Billion)
- Figure 21.5 Needles Market for Others, Historical Trends (Since 2019) and Forecasted Estimates (Till 2035) (USD Billion)
- Figure 22.1 Needles Market: Distribution by Geographical Regions
- Figure 22.2 Needles Market in North America, Historical Trends (Since 2019) and Forecasted Estimates (Till 2035) (USD Billion)
- Figure 22.3 Needles Market in the US, Historical Trends (Since 2019) and Forecasted Estimates (Till 2035) (USD Billion)
- Figure 22.4 Needles Market in Canada, Historical Trends (Since 2019) and Forecasted Estimates (Till 2035) (USD Billion)
- Figure 22.5 Needles Market in Mexico, Historical Trends (Since 2019) and Forecasted Estimates (Till 2035) (USD Billion)
- Figure 22.6 Needles Market in Europe, Historical Trends (Since 2019) and Forecasted Estimates (Till 2035) (USD Billion)
- Figure 22.7 Needles Market in Germany, Historical Trends (Since 2019) and Forecasted Estimates (Till 2035) (USD Billion)
- Figure 22.8 Needles Market in France, Historical Trends (Since 2019) and Forecasted Estimates (Till 2035) (USD Billion)
- Figure 22.9 Needles Market in the UK, Historical Trends (Since 2019) and Forecasted Estimates (Till 2035) (USD Billion)
- Figure 22.10 Needles Market in Italy, Historical Trends (Since 2019) and Forecasted Estimates (Till 2035) (USD Billion)
- Figure 22.11 Needles Market in Spain, Historical Trends (Since 2019) and Forecasted Estimates (Till 2035) (USD Billion)
- Figure 22.12 Needles Market in Rest of Europe, Historical Trends (Since 2019) and Forecasted Estimates (Till 2035) (USD Billion)
- Figure 22.13 Needles Market in Asia-Pacific, Historical Trends (Since 2019) and Forecasted Estimates (Till 2035) (USD Billion)
- Figure 22.14 Needles Market in China, Historical Trends (Since 2019) and Forecasted Estimates (Till 2035) (USD Billion)
- Figure 22.15 Needles Market in India, Historical Trends (Since 2019) and Forecasted Estimates (Till 2035) (USD Billion)
- Figure 22.16 Needles Market in Japan, Historical Trends (Since 2019) and Forecasted Estimates (Till 2035) (USD Billion)
- Figure 22.17 Needles Market in Rest of Asia Pacific, Historical Trends (Since 2019) and Forecasted Estimates (Till 2035) (USD Billion)
- Figure 22.18 Needles Market in Middle East and North Africa, Historical Trends (Since 2019) and Forecasted Estimates (Till 2035) (USD Billion)
- Figure 22.19 Needles Market in Egypt, Historical Trends (Since 2019) and Forecasted Estimates (Till 2035) (USD Billion)
- Figure 22.20 Needles Market in Saudi Arabia, Historical Trends (Since 2019) and Forecasted Estimates (Till 2035) (USD Billion)
- Figure 22.21 Needles Market in UAE, Historical Trends (Since 2019) and Forecasted Estimates (Till 2035) (USD Billion)
- Figure 22.22 Needles Market in Latin America, Historical Trends (Since 2019) and Forecasted Estimates (Till 2035) (USD Billion)
- Figure 22.23 Needles Market in Brazil, Historical Trends (Since 2019) and Forecasted Estimates (Till 2035) (USD Billion)
- Figure 22.24 Needles Market in Argentina, Historical Trends (Since 2019) and Forecasted Estimates (Till 2035) (USD Billion)
- Figure 22.25 Needles Market: Market Movement Analysis
- Figure 22.26 Needles Market: Penetration Growth (P-G) Matrix
- Figure 23.1 Needles Market: Distribution by Leading Players (USD Billion)
- Figure 24.1 Conclusion: Market Landscape
- Figure 24.2 Conclusion: Partnerships and Collaborations
- Figure 24.3 Conclusion: Patent Analysis
- Figure 24.4 Conclusion: Market Sizing and Opportunity Analysis (1/2)
- Figure 24.5 Conclusion: Market Sizing and Opportunity Analysis (2/2)

