
Need help finding what you are looking for?
Contact Us
PUBLISHER: Mordor Intelligence | PRODUCT CODE: 1690978

PUBLISHER: Mordor Intelligence | PRODUCT CODE: 1690978
North America Pea Protein Ingredients - Market Share Analysis, Industry Trends & Statistics, Growth Forecasts (2025 - 2030)
PUBLISHED:
PAGES: 223 Pages
DELIVERY TIME: 2-3 business days
SELECT AN OPTION
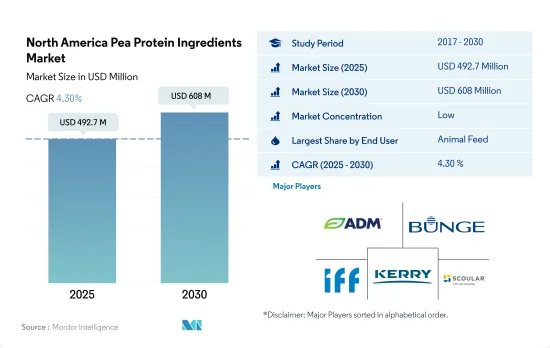
The North America Pea Protein Ingredients Market size is estimated at 492.7 million USD in 2025, and is expected to reach 608 million USD by 2030, growing at a CAGR of 4.30% during the forecast period (2025-2030).
The food and beverage segment accounted for a major share in 2022, with a growing demand for alternative meat products
- In North America, the food and beverage segment stands out as the primary user of pea proteins, with a particular focus on meat alternatives and RTE/RTC food items. As of 2022, these sub-segments collectively dominated, accounting for 57% of the region's pea protein consumption. Additionally, the supplements segment, projected to witness a CAGR of 4.47% during the study period, is expected to emerge as another pivotal market for pea proteins. This growth underscores a broader shift, where supplements are increasingly embraced as integral, nourishing additions to daily diets.
- The increasing preference for plant protein-based foods and beverages is leading companies to invest strategically in the industry. North America is becoming one of the prime established markets for plant-based meat globally, with the meat and meat alternatives segment expected to grow the fastest with respect to pea protein. The segment is projected to register a CAGR of 10.48% during the forecast period.
- In North America, veganism is becoming more popular. More people are switching to vegan diets and only buying plant-based products. The increasing acceptance of vegan diets is anticipated to be advantageous for manufacturers of plant-based protein supplements. In 2021, 0.5% of the US population (1.62 million) was estimated to be vegan. While a small number of Americans are vegan, in reality, the number of people who are not completely vegan but aspire to be is far higher. About 39% of Americans state that their diets do not consist entirely of plant-based foods, but they want to become fully vegan by avoiding as many animal-related foods as possible.
Widespread acceptance of versatility across food and beverages in the region, primarily dominated by the United States, impacts the segmental growth
- The United States retained its top position in the region in 2022 and registered a growth of 36.83% by value during 2017-2022. Pea protein has gained significant traction in the country due to widespread consumer acceptance of versatility across different applications. Manufacturers also prefer pea protein, quoting its ability to meet nutritional, functional, and label objectives. The United States was followed by Mexico and Canada in terms of market value, driven by the food and beverages segment.
- Responding to the escalating demand for pea protein, US companies are scaling up their production. In 2021, Cargill's Puris inaugurated a new facility, aiming to double its pea protein output. Likewise, Ingredion broadened its plant-based solutions, introducing two pea-based ingredients at its Nebraska facility. These competitive strides are set to fuel the growth of the food and beverages segment, with pea protein poised to achieve a CAGR of 5.49% by volume during the forecast period.
- Mexico stands out as the frontrunner in the global pea protein market, with a projected CAGR of 8.05% by value during 2023-2029. Rising concerns over prevalent health issues, notably cardiovascular diseases and obesity, linked to Mexico's traditional meat-heavy diet, are prompting a shift toward healthier options. With approximately 73% of Mexicans classified as overweight, the trend toward pea-based protein products is expected to flourish significantly, bolstering the market studied.
North America Pea Protein Ingredients Market Trends
Plant protein consumption growth fuels opportunities for key players in the ingredients industry
- From 2017 to 2022, the region saw a 2.42% increase in per capita plant protein consumption, driven by investments and innovations. This surge was primarily fueled by a growing number of consumers shifting toward vegan or vegetarian diets, largely motivated by concerns for animal welfare. Notably, in 2020, approximately 9.6 million more Americans adopted plant-based diets, constituting nearly 3% of the US population. After the COVID-19 pandemic, plant protein consumption surged, partly due to concerns over viral contamination in animal-sourced proteins and a general increase in protein blends, including both animal and plant sources.
- While most Americans are reducing their meat intake, they are not eliminating it, leaning more toward a flexitarian diet than strict veganism or vegetarianism. Plant proteins find significant usage in sports nutrition and as meat alternatives. Soy and whey proteins, in particular, are prevalent in food and beverage, supplements, and sports nutrition. By 2021, 36% of US consumers were familiar with and had consumed soy protein, with a slightly lower share of 31% having tried whey protein.
- Canada boasts the second-largest flexitarian population, showcasing a significant shift toward flexitarianism and veganism among consumers. This trend presents a ripe opportunity for manufacturers to further innovate in the plant protein market. In 2021, the Canadian government pledged over USD 4.3 million to bolster the country's pulse and special crop farmers, aligning with the rising consumer appetite for sustainable, high-quality plant-based proteins.
United States and Canada are the major pea producers across North America
- Dry peas serve as the primary raw material for extracting pea protein. Canada stands out as the leading producer of dry peas in North America, closely trailed by the United States. In Canada, provinces such as Saskatchewan, Alberta, and Manitoba lead in dry pea cultivation. North America witnessed a substantial 32% rise in pea production from 2015 to 2020. By 2020, the region's focus had notably shifted toward dry pea production, representing a dominant 95% of the total pea output.
- Forecasts indicate a continued rise in dry pea production, driven by improving yields. Notably, despite a smaller harvested area, Alberta saw heightened yields in 2020. The Canadian government's projections highlight Alberta and Saskatchewan targeting a combined dry pea production of 4.1 million metric tons, with the rest shared among Manitoba, British Columbia, and Eastern Canada. In contrast, the US faced production challenges, primarily due to reduced seeding in North Dakota, leading to both lower yields and increased abandonment. The USDA's estimates for 2020-2021 suggested a 17% drop in US dry pea production, settling just above 0.8 million metric tons.
- Canada's robust dry pea production is enticing manufacturers to set up pea protein processing plants in the country. This strategic move not only leverages Canada's production strength but also helps in curtailing supply chain costs, especially in transportation and storage. A prime example is Roquette, a major North American pea protein producer, which, in November 2021, inaugurated the world's largest pea protein facility in Portage la Prairie, Canada. This cutting-edge plant specializes in processing yellow peas into fibers, proteins, and starch, catering to diverse applications, notably in the pharmaceutical sector.
North America Pea Protein Ingredients Industry Overview
The North America Pea Protein Ingredients Market is fragmented, with the top five companies occupying 21.59%. The major players in this market are Archer Daniels Midland Company, Bunge Limited, International Flavors & Fragrances, Inc., Kerry Group PLC and The Scoular Company (sorted alphabetically).
Additional Benefits:
- The market estimate (ME) sheet in Excel format
- 3 months of analyst support
Product Code: 90089
TABLE OF CONTENTS
1 EXECUTIVE SUMMARY & KEY FINDINGS
2 INTRODUCTION
- 2.1 Study Assumptions & Market Definition
- 2.2 Scope of the Study
- 2.3 Research Methodology
3 KEY INDUSTRY TRENDS
- 3.1 End User Market Volume
- 3.1.1 Baby Food and Infant Formula
- 3.1.2 Bakery
- 3.1.3 Beverages
- 3.1.4 Breakfast Cereals
- 3.1.5 Condiments/Sauces
- 3.1.6 Confectionery
- 3.1.7 Dairy and Dairy Alternative Products
- 3.1.8 Elderly Nutrition and Medical Nutrition
- 3.1.9 Meat/Poultry/Seafood and Meat Alternative Products
- 3.1.10 RTE/RTC Food Products
- 3.1.11 Snacks
- 3.1.12 Sport/Performance Nutrition
- 3.1.13 Animal Feed
- 3.1.14 Personal Care and Cosmetics
- 3.2 Protein Consumption Trends
- 3.2.1 Plant
- 3.3 Production Trends
- 3.3.1 Plant
- 3.4 Regulatory Framework
- 3.4.1 United States
- 3.5 Value Chain & Distribution Channel Analysis
4 MARKET SEGMENTATION (includes market size in Value in USD and Volume, Forecasts up to 2030 and analysis of growth prospects)
- 4.1 Form
- 4.1.1 Concentrates
- 4.1.2 Isolates
- 4.1.3 Textured/Hydrolyzed
- 4.2 End User
- 4.2.1 Animal Feed
- 4.2.2 Food and Beverages
- 4.2.2.1 By Sub End User
- 4.2.2.1.1 Bakery
- 4.2.2.1.2 Beverages
- 4.2.2.1.3 Breakfast Cereals
- 4.2.2.1.4 Condiments/Sauces
- 4.2.2.1.5 Confectionery
- 4.2.2.1.6 Dairy and Dairy Alternative Products
- 4.2.2.1.7 Meat/Poultry/Seafood and Meat Alternative Products
- 4.2.2.1.8 RTE/RTC Food Products
- 4.2.2.1.9 Snacks
- 4.2.3 Personal Care and Cosmetics
- 4.2.4 Supplements
- 4.2.4.1 By Sub End User
- 4.2.4.1.1 Baby Food and Infant Formula
- 4.2.4.1.2 Elderly Nutrition and Medical Nutrition
- 4.2.4.1.3 Sport/Performance Nutrition
- 4.3 Country
- 4.3.1 Canada
- 4.3.2 Mexico
- 4.3.3 United States
- 4.3.4 Rest of North America
5 COMPETITIVE LANDSCAPE
- 5.1 Key Strategic Moves
- 5.2 Market Share Analysis
- 5.3 Company Landscape
- 5.4 Company Profiles (includes Global Level Overview, Market Level Overview, Core Business Segments, Financials, Headcount, Key Information, Market Rank, Market Share, Products and Services, and Analysis of Recent Developments).
- 5.4.1 Archer Daniels Midland Company
- 5.4.2 Bunge Limited
- 5.4.3 Cargill Incorporated
- 5.4.4 Farbest-Tallman Foods Corporation
- 5.4.5 Glanbia PLC
- 5.4.6 Ingredion Incorporated
- 5.4.7 International Flavors & Fragrances, Inc.
- 5.4.8 Kerry Group PLC
- 5.4.9 Roquette Freres
- 5.4.10 The Scoular Company
6 KEY STRATEGIC QUESTIONS FOR PROTEIN INGREDIENTS INDUSTRY CEOS
7 APPENDIX
- 7.1 Global Overview
- 7.1.1 Overview
- 7.1.2 Porter's Five Forces Framework
- 7.1.3 Global Value Chain Analysis
- 7.1.4 Market Dynamics (DROs)
- 7.2 Sources & References
- 7.3 List of Tables & Figures
- 7.4 Primary Insights
- 7.5 Data Pack
- 7.6 Glossary of Terms
Have a question?


SELECT AN OPTION
Have a question?
Questions? Please give us a call or visit the contact form.