
Need help finding what you are looking for?
Contact Us
PUBLISHER: Mordor Intelligence | PRODUCT CODE: 1683508

PUBLISHER: Mordor Intelligence | PRODUCT CODE: 1683508
Pea Protein Ingredients - Market Share Analysis, Industry Trends & Statistics, Growth Forecasts (2025 - 2030)
PUBLISHED:
PAGES: 402 Pages
DELIVERY TIME: 2-3 business days
SELECT AN OPTION
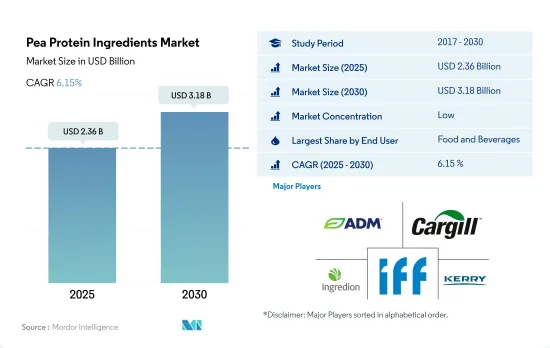
The Pea Protein Ingredients Market size is estimated at 2.36 billion USD in 2025, and is expected to reach 3.18 billion USD by 2030, growing at a CAGR of 6.15% during the forecast period (2025-2030).
With the increasing vegan culture, the demand for pea protein ingredients has risen throughout the region
- Due to their expanding functionalities, pea protein-infused products are in high global demand. In 2022, the food and beverage segment led the charge, accounting for 88.48% of the market's volume consumption. Recognized for its hypoallergenic properties, pea protein is often blended with other ingredients to enhance flavor, texture, and overall nutritional value.
- Within the supplements segment, the sports/performance nutrition sub-segment is the primary driver, poised for a 6.85% CAGR during the forecast period. The protein beverage market is currently dominated by dairy and soy products. However, a noticeable shift is occurring, with 30% of US consumers now opting for plant-based protein beverages. In the United Kingdom, 10% of consumers avoid soy due to allergies or intolerances, while another 10% steer clear of it as part of a broader health-conscious choice. Pea protein's allure is further bolstered by the rising popularity of labels like 'gluten-free' and 'GMO-free.' Pea protein is particularly well-placed in the sports nutrition industry due to its impressive amino acid profile. The animal feed segment is the second-largest consumer of pea protein globally, following closely behind the food and beverage industry. In 2022, pea protein isolates, capturing a substantial 41.97% volume share, led the charge in animal feed applications. Its digestibility and naturally low antitrypsin activity make pea protein a preferred choice, especially in young animal nutrition, notably in piglets. Numerous studies underscore the palatability and growth benefits of a diet rich in pea protein.
Pea protein is gaining popularity as a substitute for egg protein, supported by widespread veganism across the region
- Asia-Pacific dominates the global pea protein market, driven by the F&B segment, which accounted for 95% of the market share by volume in 2022. In addition, pea protein provides enough viscosity and creaminess, so local manufacturers use pea protein as a substitute for eggs in products like mayonnaise. Pea protein has been touted as a label-friendly, gluten-free, and soy-free alternative. Along with holding the largest share, Asia-Pacific is growing significantly and is expected to record a CAGR of 6.53% during the forecast period.
- Asia-Pacific is followed by Europe, primarily led by the F&B segment, which accounted for about 93% of pea proteins used in the region in 2022. The demand for pea protein as an alternative source of protein has been growing as vegan diets are becoming more popular in the region's developed countries. Germany remained the largest consumer of pea protein during the study period due to rising veganism and consumers' growing reliance on alternative meat products.
- The Middle East is projected to be the fastest-growing regional segment, as the demand for natural and sustainable ingredients is rapidly growing due to the rise in health consciousness among consumers. Over the forecast period, the region is expected to record a CAGR of 12.21% by volume. Saudi Arabia primarily drives the Middle Eastern pea protein market due to increasing awareness of pea protein use, causing the country's population to adopt it in their diets. However, these proteins have applications in the F&B segment, which was majorly driven by the meat and meat alternative products sub-segment, with a 37% share by volume in 2022.
Global Pea Protein Ingredients Market Trends
Due to several health benefits of plant protein-based diets, customers are moving toward vegan offerings
- Globally, consumers are shifting their dietary preferences. Notably, there is a growing preference for dairy and meat alternatives, especially among consumers in Europe and North America. In 2022, Europe led the way with plant-based milk accounting for 38% of total plant-based food sales, followed closely by plant-based meat. This evolving trend is boosting the number of flexitarian and vegan consumers and opening doors for manufacturers to innovate within the plant protein sector.
- The popularity of plant-based protein alternatives is due to their nutritional value and stems from growing concerns over environmental impact, ethics, and health. Proteins, known for their slower digestion compared to carbohydrates, play a crucial role in weight management by promoting a longer-lasting feeling of fullness with fewer calories. A new study reveals that over one billion people globally were living with obesity between 2022 and 2023.
- Moreover, the rising engagement of the younger population in sports and fitness activities, coupled with a growing trend of fortifying food and beverages with functional ingredients for added health benefits, is fueling the demand for plant-based proteins. In 2023, a record-high 242 million Americans aged 6 and older (nearly 80% of the population) participated in at least one sport or fitness activity, a 2.2% increase from 2022. This active lifestyle shift is driving the demand for plant-based protein food products. Furthermore, government initiatives, such as Canada's Health Ministry, which revamped its food guide, emphasizing three key categories: vegetables and fruits, whole grains, and plant-based proteins, are driving awareness and demand for alternative proteins among consumers.
North America dominates the global dry pea production, driven by Canada
- Dry peas are the primary source for extracting pea protein, with Canada leading the production, closely followed by the United States. In Canada, provinces like Saskatchewan, Alberta, and Manitoba lead dry pea production. Notably, North American pea production surged 32% from 2015 to 2020. By 2020, the region's focus had shifted significantly toward dried peas, claiming a dominant 95% share of the total pea production. Conversely, the United States faced production challenges, primarily from reduced seeding in North Dakota, diminished yields, and higher abandonment rates. In its 2020-2021 forecast, the USDA anticipated a 17% drop in US dry pea production, settling just above 0.8 million metric tons.
- In Asia-Pacific, China leads the pea production, closely trailed by India. China boasts two key dried pea production hubs: the Northern and Southern Dried Pea-producing Areas. Provinces like Ningxia, Gansu, Yunnan, and Qinghai collectively contribute over 70% to China's dried pea output. Shifting to India, the country's dry pea production hit 100,440.2 tons in 2022, marking a notable 23.72% increase from the 2019 figure of 811,810 tons.
- Aside from the dominant players, countries like Russia, France, Ukraine, and Australia also hold significant global dry pea production positions. Notably, yellow peas are in substantial cultivation, especially in eastern Australia. While historically, Victoria and South Australia led Australian pea production, Western Australia has seen a remarkable surge in production, attributed to advancements in both varieties and production techniques.
Pea Protein Ingredients Industry Overview
The Pea Protein Ingredients Market is fragmented, with the top five companies occupying 21.95%. The major players in this market are Archer Daniels Midland Company, Cargill Incorporated, Ingredion Incorporated, International Flavors & Fragrances, Inc. and Kerry Group (sorted alphabetically).
Additional Benefits:
- The market estimate (ME) sheet in Excel format
- 3 months of analyst support
Product Code: 90231
TABLE OF CONTENTS
1 EXECUTIVE SUMMARY & KEY FINDINGS
2 INTRODUCTION
- 2.1 Study Assumptions & Market Definition
- 2.2 Scope of the Study
- 2.3 Research Methodology
3 KEY INDUSTRY TRENDS
- 3.1 End User Market Volume
- 3.1.1 Baby Food and Infant Formula
- 3.1.2 Bakery
- 3.1.3 Beverages
- 3.1.4 Breakfast Cereals
- 3.1.5 Condiments/Sauces
- 3.1.6 Confectionery
- 3.1.7 Dairy and Dairy Alternative Products
- 3.1.8 Elderly Nutrition and Medical Nutrition
- 3.1.9 Meat/Poultry/Seafood and Meat Alternative Products
- 3.1.10 RTE/RTC Food Products
- 3.1.11 Snacks
- 3.1.12 Sport/Performance Nutrition
- 3.1.13 Animal Feed
- 3.1.14 Personal Care and Cosmetics
- 3.2 Protein Consumption Trends
- 3.2.1 Plant
- 3.3 Production Trends
- 3.3.1 Plant
- 3.4 Regulatory Framework
- 3.4.1 China
- 3.4.2 Germany
- 3.4.3 India
- 3.4.4 Japan
- 3.4.5 United States
- 3.5 Value Chain & Distribution Channel Analysis
4 MARKET SEGMENTATION (includes market size in Value in USD and Volume, Forecasts up to 2030 and analysis of growth prospects)
- 4.1 Form
- 4.1.1 Concentrates
- 4.1.2 Isolates
- 4.1.3 Textured/Hydrolyzed
- 4.2 End User
- 4.2.1 Animal Feed
- 4.2.2 Food and Beverages
- 4.2.2.1 By Sub End User
- 4.2.2.1.1 Bakery
- 4.2.2.1.2 Beverages
- 4.2.2.1.3 Breakfast Cereals
- 4.2.2.1.4 Condiments/Sauces
- 4.2.2.1.5 Confectionery
- 4.2.2.1.6 Dairy and Dairy Alternative Products
- 4.2.2.1.7 Meat/Poultry/Seafood and Meat Alternative Products
- 4.2.2.1.8 RTE/RTC Food Products
- 4.2.2.1.9 Snacks
- 4.2.3 Personal Care and Cosmetics
- 4.2.4 Supplements
- 4.2.4.1 By Sub End User
- 4.2.4.1.1 Baby Food and Infant Formula
- 4.2.4.1.2 Elderly Nutrition and Medical Nutrition
- 4.2.4.1.3 Sport/Performance Nutrition
- 4.3 Region
- 4.3.1 Africa
- 4.3.1.1 By Form
- 4.3.1.2 By End User
- 4.3.1.3 By Country
- 4.3.1.3.1 Nigeria
- 4.3.1.3.2 South Africa
- 4.3.1.3.3 Rest of Africa
- 4.3.2 Asia-Pacific
- 4.3.2.1 By Form
- 4.3.2.2 By End User
- 4.3.2.3 By Country
- 4.3.2.3.1 Australia
- 4.3.2.3.2 China
- 4.3.2.3.3 India
- 4.3.2.3.4 Indonesia
- 4.3.2.3.5 Japan
- 4.3.2.3.6 Malaysia
- 4.3.2.3.7 New Zealand
- 4.3.2.3.8 South Korea
- 4.3.2.3.9 Thailand
- 4.3.2.3.10 Vietnam
- 4.3.2.3.11 Rest of Asia-Pacific
- 4.3.3 Europe
- 4.3.3.1 By Form
- 4.3.3.2 By End User
- 4.3.3.3 By Country
- 4.3.3.3.1 Belgium
- 4.3.3.3.2 France
- 4.3.3.3.3 Germany
- 4.3.3.3.4 Italy
- 4.3.3.3.5 Netherlands
- 4.3.3.3.6 Russia
- 4.3.3.3.7 Spain
- 4.3.3.3.8 Turkey
- 4.3.3.3.9 United Kingdom
- 4.3.3.3.10 Rest of Europe
- 4.3.4 Middle East
- 4.3.4.1 By Form
- 4.3.4.2 By End User
- 4.3.4.3 By Country
- 4.3.4.3.1 Iran
- 4.3.4.3.2 Saudi Arabia
- 4.3.4.3.3 United Arab Emirates
- 4.3.4.3.4 Rest of Middle East
- 4.3.5 North America
- 4.3.5.1 By Form
- 4.3.5.2 By End User
- 4.3.5.3 By Country
- 4.3.5.3.1 Canada
- 4.3.5.3.2 Mexico
- 4.3.5.3.3 United States
- 4.3.5.3.4 Rest of North America
- 4.3.6 South America
- 4.3.6.1 By Form
- 4.3.6.2 By End User
- 4.3.6.3 By Country
- 4.3.6.3.1 Argentina
- 4.3.6.3.2 Brazil
- 4.3.6.3.3 Rest of South America
- 4.3.1 Africa
5 COMPETITIVE LANDSCAPE
- 5.1 Key Strategic Moves
- 5.2 Market Share Analysis
- 5.3 Company Landscape
- 5.4 Company Profiles (includes Global Level Overview, Market Level Overview, Core Business Segments, Financials, Headcount, Key Information, Market Rank, Market Share, Products and Services, and Analysis of Recent Developments).
- 5.4.1 Archer Daniels Midland Company
- 5.4.2 Cargill Incorporated
- 5.4.3 Cosucra Groupe Warcoing SA
- 5.4.4 Emsland Group
- 5.4.5 Ingredion Incorporated
- 5.4.6 International Flavors & Fragrances, Inc.
- 5.4.7 Kerry Group
- 5.4.8 Roquette Frere
- 5.4.9 Yantai Shuangta Food Co. Ltd
6 KEY STRATEGIC QUESTIONS FOR PROTEIN INGREDIENTS INDUSTRY CEOS
7 APPENDIX
- 7.1 Global Overview
- 7.1.1 Overview
- 7.1.2 Porter's Five Forces Framework
- 7.1.3 Global Value Chain Analysis
- 7.1.4 Market Dynamics (DROs)
- 7.2 Sources & References
- 7.3 List of Tables & Figures
- 7.4 Primary Insights
- 7.5 Data Pack
- 7.6 Glossary of Terms
Have a question?


SELECT AN OPTION
Have a question?
Questions? Please give us a call or visit the contact form.