
Need help finding what you are looking for?
Contact Us
PUBLISHER: Mordor Intelligence | PRODUCT CODE: 1683506

PUBLISHER: Mordor Intelligence | PRODUCT CODE: 1683506
Milk Protein - Market Share Analysis, Industry Trends & Statistics, Growth Forecasts (2025 - 2030)
PUBLISHED:
PAGES: 389 Pages
DELIVERY TIME: 2-3 business days
SELECT AN OPTION
The Milk Protein Market size is estimated at 1.38 billion USD in 2025, and is expected to reach 1.8 billion USD by 2030, growing at a CAGR of 5.52% during the forecast period (2025-2030).
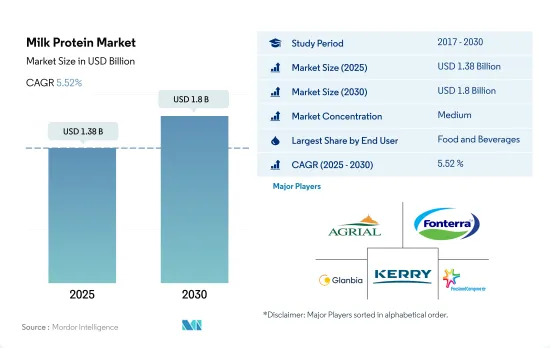
With 85.67% of milk protein demand in the bakery, snacks, and beverage industries, food and beverages segment has led the market
- By application, the F&B sector retained the top position in the market throughout the review period. By volume, 85.67% of milk protein demand in the F&B segment was driven by the bakery, snacks, and beverage industries in 2022. Milk proteins are gaining popularity in low-acid beverages due to their greater solubility and heat stability. Similarly, milk proteins' high efficacy in egg replacement boosted its demand in the bakery industry, especially in countries where avian flu is a budding concern. Hence, the use of milk proteins in the F&B segment is anticipated to register a CAGR of 4.55%, by volume, during the forecast period.
- On the other hand, the supplements sector also recorded a significant global demand. This was led by the growing demand for the sport and performance nutrition and baby food and infant formula industries, which accounted for shares of 33% and 66%, by volume, respectively, in the supplements segment. Sports and performance nutrition is projected to be the fastest-growing among all supplements sub-segments, recording a CAGR of 6.08% during the forecast period. Milk protein is an excellent alternative for bodybuilders due to its ability to offer a whey-to-casein ratio of 20:80. More than 75% of Americans take dietary supplements every year; with 79% of female adults and 74% of male adults claiming to consume at least one form of supplements with their diet.
- In June 2020, the FDA decided to allow the inclusion of milk protein concentrate (MPC), milk protein isolate (MPI), and a few additional additives in products branded as "high protein milk," which is further expected to propel the market segment during the forecast period.
Increasing population with rising prevalence of obesity and other health concerns, Asia-Pacific witnessed the highest market for milk protein
- Asia-Pacific, particularly China (with a 33.8% share in the regional market in 2022), is the leading market for milk protein, aided by constant innovations targeting distinct end-user segments. Increases in the prevalence of obesity (roughly 27% of the population, more than half a billion people in 2020) and fitness enthusiasts choosing high-protein foods have positioned China as the market leader. The dairy industry has recorded immense growth globally, driving milk protein production. These proteins have immense applications in the bakery sub-segment in the food and beverages segment, followed by the supplements segment.
- Europe holds the second-largest market share and has been attracting foreign investments in line with harmonization achieved by Turkish and EU Food Laws. Other regions hold enormous development potential, prompting multinational businesses to spend heavily in the milk protein market in Africa, South America, and the Middle East. Dairy ingredient maker Darigold, a major brand that offers milk protein concentrates, opened an office in Dubai in 2019 for improved service integration with customers in the Middle East and Africa.
- The Middle East region is projected to be the fastest-growing in the market, with a CAGR of 6.25% by value during the forecast period 2023-2029. Due to the growing awareness of its nutritional value, raw material manufacturers are opening sales offices and selling products in the Middle Eastern market. In 2021, around 48.2% of people across Saudi Arabia practiced physical and sporting activities at least 30 minutes a week. The protein consumption in the supplements segment accounted for a volume of 8,234.4 ton in 2022 in Saudi Arabia.
Global Milk Protein Market Trends
Rising health awareness and growing demand from millennials are driving the market
- Rising health awareness and a surge in demand from millennials are driving the sports nutrition segment. The segment is witnessing an upswing, with consumers increasingly seeking protein-enriched beverages and dietary supplements, citing benefits like muscle maintenance and growth. For instance, the 2023 CRN Consumer Survey on Dietary Supplements reveals that 74% of US adults consume dietary supplements, with 55% identified as "regular users".
- Sports drinks, traditionally marketed for their electrolyte-replenishing properties during intense physical activities, have evolved to emphasize benefits such as increased carbohydrates, salts, and enhanced performance during workouts. This evolution aligns with the shift toward active and healthier lifestyles. The sports nutrition segment has seen a boost from growing participation in sports among middle-aged and elderly populations. For example, in 2022, the rate of regular sports participation among Asian youth aged 6 to 12 years surged to 42%, up from 35% in 2019.
- North America stands at the forefront of the sports nutrition segment, driven by a rising athletic trend, health concerns, and dietary habits. The market is expected to benefit from the ongoing trend of flavor innovations that boast health advantages. Meanwhile, Europe is emerging as a significant player, with key markets like the United Kingdom, Germany, Spain, and France commanding a major share of the market. In 2022, statistics revealed that 38% of adults in the European Union engaged in sports or exercise at least once a week, with 6% committing to it five times weekly.
Milk continues to contribute as a major animal protein source
- Milk is a key source of financial revenue for small-scale farmers and offers relatively quick returns. This development is mostly due to an increase in the number of milk-producing animals and a tangible expansion in yield figures rather than an increase in production per head. Global milk production increased by more than 59% in the previous three decades, from 530 million tons in 1988 to 843 million tons in 2018, and global milk production in 2022 was projected to reach 937 million tons, up 1.0% from 2021. According to production data from the Food and Agriculture Organization Corporate Statistical Database (FAOSTAT), India is the highest milk producer in the world. India contributed 24% of global milk production from 2021 to 2022.
- Asia, led by India and Pakistan's efficiency in milk collection and China's burgeoning large-scale farms, is poised to be the linchpin of global milk production. While North America, Central America, and the Caribbean saw moderate growth in milk output in 2022, largely driven by enhanced yields, Europe, South America, and Oceania faced projections of declining production. This decline is attributed to diminishing dairy cattle numbers, a rising shortage of skilled labor, and subpar pasture quality.
- France experienced a notable dip in milk supply in the European Union in January 2021, down over 3% from the same month in 2020, settling at just over 2 billion liters. This translated to a production drop of more than 70 million liters compared to January 2020. The decline was primarily linked to harsh early 2021 weather, alongside elevated feed prices and substandard silage quality.
Milk Protein Industry Overview
The Milk Protein Market is moderately consolidated, with the top five companies occupying 41.38%. The major players in this market are Agrial Enterprise, Fonterra Co-operative Group Limited, Glanbia PLC, Kerry Group PLC and Royal FrieslandCampina NV (sorted alphabetically).
Additional Benefits:
- The market estimate (ME) sheet in Excel format
- 3 months of analyst support
Product Code: 90224
TABLE OF CONTENTS
1 EXECUTIVE SUMMARY & KEY FINDINGS
2 INTRODUCTION
- 2.1 Study Assumptions & Market Definition
- 2.2 Scope of the Study
- 2.3 Research Methodology
3 KEY INDUSTRY TRENDS
- 3.1 End User Market Volume
- 3.1.1 Baby Food and Infant Formula
- 3.1.2 Bakery
- 3.1.3 Beverages
- 3.1.4 Breakfast Cereals
- 3.1.5 Condiments/Sauces
- 3.1.6 Confectionery
- 3.1.7 Dairy and Dairy Alternative Products
- 3.1.8 Elderly Nutrition and Medical Nutrition
- 3.1.9 Meat/Poultry/Seafood and Meat Alternative Products
- 3.1.10 RTE/RTC Food Products
- 3.1.11 Snacks
- 3.1.12 Sport/Performance Nutrition
- 3.1.13 Animal Feed
- 3.1.14 Personal Care and Cosmetics
- 3.2 Protein Consumption Trends
- 3.2.1 Animal
- 3.3 Production Trends
- 3.3.1 Animal
- 3.4 Regulatory Framework
- 3.4.1 Australia
- 3.4.2 Canada
- 3.4.3 China
- 3.4.4 France
- 3.4.5 Germany
- 3.4.6 India
- 3.4.7 Italy
- 3.4.8 United Kingdom
- 3.4.9 United States
- 3.5 Value Chain & Distribution Channel Analysis
4 MARKET SEGMENTATION (includes market size in Value in USD and Volume, Forecasts up to 2030 and analysis of growth prospects)
- 4.1 Form
- 4.1.1 Concentrates
- 4.1.2 Hydrolyzed
- 4.1.3 Isolates
- 4.2 End User
- 4.2.1 Animal Feed
- 4.2.2 Food and Beverages
- 4.2.2.1 By Sub End User
- 4.2.2.1.1 Bakery
- 4.2.2.1.2 Beverages
- 4.2.2.1.3 Breakfast Cereals
- 4.2.2.1.4 Condiments/Sauces
- 4.2.2.1.5 Dairy and Dairy Alternative Products
- 4.2.2.1.6 RTE/RTC Food Products
- 4.2.2.1.7 Snacks
- 4.2.3 Personal Care and Cosmetics
- 4.2.4 Supplements
- 4.2.4.1 By Sub End User
- 4.2.4.1.1 Baby Food and Infant Formula
- 4.2.4.1.2 Elderly Nutrition and Medical Nutrition
- 4.2.4.1.3 Sport/Performance Nutrition
- 4.3 Region
- 4.3.1 Africa
- 4.3.1.1 By Form
- 4.3.1.2 By End User
- 4.3.1.3 By Country
- 4.3.1.3.1 Nigeria
- 4.3.1.3.2 South Africa
- 4.3.1.3.3 Rest of Africa
- 4.3.2 Asia-Pacific
- 4.3.2.1 By Form
- 4.3.2.2 By End User
- 4.3.2.3 By Country
- 4.3.2.3.1 Australia
- 4.3.2.3.2 China
- 4.3.2.3.3 India
- 4.3.2.3.4 Indonesia
- 4.3.2.3.5 Japan
- 4.3.2.3.6 Malaysia
- 4.3.2.3.7 New Zealand
- 4.3.2.3.8 South Korea
- 4.3.2.3.9 Thailand
- 4.3.2.3.10 Vietnam
- 4.3.2.3.11 Rest of Asia-Pacific
- 4.3.3 Europe
- 4.3.3.1 By Form
- 4.3.3.2 By End User
- 4.3.3.3 By Country
- 4.3.3.3.1 Belgium
- 4.3.3.3.2 France
- 4.3.3.3.3 Germany
- 4.3.3.3.4 Italy
- 4.3.3.3.5 Netherlands
- 4.3.3.3.6 Russia
- 4.3.3.3.7 Spain
- 4.3.3.3.8 Turkey
- 4.3.3.3.9 United Kingdom
- 4.3.3.3.10 Rest of Europe
- 4.3.4 Middle East
- 4.3.4.1 By Form
- 4.3.4.2 By End User
- 4.3.4.3 By Country
- 4.3.4.3.1 Iran
- 4.3.4.3.2 Saudi Arabia
- 4.3.4.3.3 United Arab Emirates
- 4.3.4.3.4 Rest of Middle East
- 4.3.5 North America
- 4.3.5.1 By Form
- 4.3.5.2 By End User
- 4.3.5.3 By Country
- 4.3.5.3.1 Canada
- 4.3.5.3.2 Mexico
- 4.3.5.3.3 United States
- 4.3.5.3.4 Rest of North America
- 4.3.6 South America
- 4.3.6.1 By Form
- 4.3.6.2 By End User
- 4.3.6.3 By Country
- 4.3.6.3.1 Argentina
- 4.3.6.3.2 Brazil
- 4.3.6.3.3 Rest of South America
- 4.3.1 Africa
5 COMPETITIVE LANDSCAPE
- 5.1 Key Strategic Moves
- 5.2 Market Share Analysis
- 5.3 Company Landscape
- 5.4 Company Profiles (includes Global Level Overview, Market Level Overview, Core Business Segments, Financials, Headcount, Key Information, Market Rank, Market Share, Products and Services, and Analysis of Recent Developments).
- 5.4.1 Agrial Enterprise
- 5.4.2 Fonterra Co-operative Group Limited
- 5.4.3 Glanbia PLC
- 5.4.4 Groupe LACTALIS
- 5.4.5 Kerry Group PLC
- 5.4.6 Morinaga Milk Industry Co., Ltd.
- 5.4.7 Olam International Limited
- 5.4.8 Royal FrieslandCampina NV
6 KEY STRATEGIC QUESTIONS FOR PROTEIN INGREDIENTS INDUSTRY CEOS
7 APPENDIX
- 7.1 Global Overview
- 7.1.1 Overview
- 7.1.2 Porter's Five Forces Framework
- 7.1.3 Global Value Chain Analysis
- 7.1.4 Market Dynamics (DROs)
- 7.2 Sources & References
- 7.3 List of Tables & Figures
- 7.4 Primary Insights
- 7.5 Data Pack
- 7.6 Glossary of Terms
Have a question?


SELECT AN OPTION
Have a question?
Questions? Please give us a call or visit the contact form.