
PUBLISHER: Mordor Intelligence | PRODUCT CODE: 1644516

PUBLISHER: Mordor Intelligence | PRODUCT CODE: 1644516
India Flexible Office Space - Market Share Analysis, Industry Trends & Statistics, Growth Forecasts (2025 - 2030)
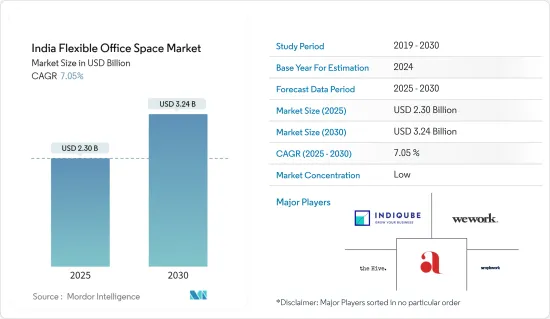
The India Flexible Office Space Market size is estimated at USD 2.30 billion in 2025, and is expected to reach USD 3.24 billion by 2030, at a CAGR of 7.05% during the forecast period (2025-2030).
Key Highlights
- Driven by the rise of hybrid work models, a demand for flexible leases, and evolving work cultures, India is witnessing a pronounced shift towards flexible office spaces. This trend has attracted a diverse clientele, spanning start-ups, SMEs, and major corporations. Their share of total office leasing has risen from 10.2% in 2019 to 12.7% in the first half of 2024. The uptake of flexible office seats surged from 85,234 in 2021 to 155,000 in 2023, with 106,554 seats leased in just the first half of 2024, as per the reports by Business Standard on September 2024.
- Reported by Industry Associations on Evolution on the Flex Space Industry, as of H1 2024, flexible workspaces across India's top eight cities spanned 58 Million Square Feet (MSF), representing 7-8% of the nation's total Grade A office supply. The first half of 2024 alone saw an addition of over 5 MSF to the flex supply, building on the previous two years' momentum, which saw increases of 8-9 MSF each year, with growth rates of 23% in 2022 and 18% in 2023.
- Over the past 3.5 years, the flexible workspace sector has enjoyed an impressive annual growth rate of 35-37%. Notably, 2024 is already on track, achieving nearly 70% of 2023's leasing figures. From Flex to Managed - Evolution of the Flex Space Industry, September 2024, a report from Industry Associations also details the distribution of flex space inventory in the top 8 cities: Bangalore dominates with 31% of the total stock, trailed by Delhi NCR (16%), Pune (14%), Hyderabad (14%), and Mumbai (11%). Moreover, there's a burgeoning demand for flexible workspaces in Tier II and III cities, spurred by workforce decentralization and a heightened focus on work-life balance. Nationwide, flexible spaces now represent 11-13% of total office space demand.
- Enterprises leveraging the Managed Office Solutions (MOS) model enjoy a suite of tailored services, allowing for a fully custom-built office and control over every aspect of their workspace. Among the 300+ operators in the market, the top 5% dominate, holding over 50% of the Grade A flex stock, with most centering their offerings around Managed Office Solutions (MOS).
- Information Technology (specifically business process management) leads the charge, making up 50% of 2024 absorption in flexible workspaces. They are followed by engineering and manufacturing at 18%, and banking, financial services, and insurance (BFSI) at 12%. Post-pandemic, rising costs and the feasibility of remote work have nudged these sectors towards flexible office solutions.
India Flexible Office Space Market Trends
Market Thrives on IT and Communication Sector Demand
India's flexible office space market is witnessing significant growth, primarily driven by the IT and Communication sectors. The surge in demand for these adaptable workspaces underscores their importance for companies transitioning to hybrid work models. Business Standard reports that in the first half of 2024, the IT sector was responsible for a substantial 50% of the total absorption of flexible office spaces, underscoring its dominant influence on the market. As businesses adapt to the post-pandemic landscape, the allure of flexible office solutions has intensified, especially for IT firms keen on optimizing their real estate strategies.
Beyond the IT realm, the Business Process Management (BPM) segment, a key player in the communication sector, is also fueling this trend. As the nature of work evolves, companies increasingly recognize the need for agility, leading to a marked uptick in demand for flexible office spaces. Reports from Industry Association, indicate that in quarterly leasing, IT-BPM segments commanded the lion's share at ~32%, trailed by flexible workspaces at 15% and the BFSI sector at 14%. This evolution signifies a wider acceptance of flexible work arrangements, with IT and BPM at the forefront, adapting swiftly to the changing workforce dynamics.
The IT and Communication sectors are also benefiting from the rise of startups and small-to-medium enterprises (SMEs) that are increasingly opting for flexible workspaces. Over the past two years, 2022 and 2023, the sector has consistently witnessed new leasing activities totaling around 10 million square feet, driven largely by demand from satellite offices of MNCs, MSMEs, unicorns, startups, and GCCs. This momentum is set to continue into 2024 and 2025, with projections of an annual growth of 10-12 million square feet as reported by India Breifing. By embracing coworking environments, IT and Communication companies gain access to state-of-the-art infrastructure without the burdensome long-term commitments of traditional leases. This shift not only serves the interests of these sectors but also fosters enhanced collaboration and networking among diverse enterprises.
In conclusion, the IT and Communication sectors are pivotal in shaping the growth trajectory of India's flexible office space market. Their increasing reliance on adaptable workspaces reflects a broader industry shift towards flexibility and innovation, ensuring these sectors remain at the forefront of workplace transformation in the years to come.
Bengaluru's Surge in Office Leasing Sets the Pace for Market
Bengaluru, often dubbed India's tech capital, spearheaded office leasing activities in 2024, absorbing a staggering 16.4 million square feet from January to September, as per Industry Association's data. This surge in demand predominantly stems from technology firms and Global Capability Centres (GCCs), both flourishing in Bengaluru's robust tech landscape. With the tech sector accounting for 23% of total leasing, companies are on the lookout for spaces boasting cutting-edge infrastructure and amenities, pivotal for high-stakes operations like R&D and data analytics.
As per reports from Construction Week, in Q3 2024 alone, Bengaluru witnessed an absorption of 6.2 million square feet, marking a notable 48% year-on-year uptick. Large transactions, each spanning 100,000 square feet or more, dominated the scene, making up 67% of the leasing activity. Projections suggest the city is on track to hit a record gross absorption of approximately 20 million square feet by year's end. While the IT-BPM sector remained the frontrunner with a 46% leasing share, the BFSI sector made its mark, contributing 23% to the city's leasing activities in Q3 2024.
Major cities, including Bengaluru, Mumbai, Delhi NCR, and Hyderabad, experienced heightened fresh space take-ups across diverse sectors, from IT-BPM and BFSI to engineering, manufacturing, and flexible operators. While Q3 2024 saw a nationwide uptick in supply, primarily fueled by completions in Bengaluru and Hyderabad, demand outpaced this supply. This disparity underscores the urgency for accelerated completions in major cities, especially as inquiries for premium Grade A spaces intensify.
Key highlights from Industry Associations, reveal that Q3 2024 witnessed 10 million square feet of new completions, with Bengaluru and Hyderabad claiming 50% and 24% shares, respectively. Leading the charge, Bengaluru boasts a flex space availability of 20.2 million square feet. Notably, the average desk cost in Tier I cities like Mumbai, Bengaluru, and Delhi NCR is 50% steeper in prime micro-markets than in other locales. By September 2024, reports indicate that over 80% of occupiers in Bengaluru are inclined to expand their portfolios with flexible spaces in the coming years.
In conclusion, Bengaluru's dominance in office leasing and its robust flex space market highlight its pivotal role in driving India's flexible office space market. The city's ability to cater to diverse sectors and its focus on quality infrastructure position it as a key player in meeting the evolving demands of occupiers.
India Flexible Office Space Industry Overview
Major international and domestic players populate the competitive landscape of India's flexible office space market. High competition characterizes this market, fueled by technological advancements that lower entry barriers for newcomers. To secure a competitive edge, companies in India's flexible office space arena pursue growth strategies, including strategic partnerships, mergers, and acquisitions. Some of the major players include WeWork, Awfis, IndiQube, Simpliwork, The Hive, 91 Springboard, Redbrics, Mumbai Co-working, etc., among others.
Additional Benefits:
- The market estimate (ME) sheet in Excel format
- 3 months of analyst support
TABLE OF CONTENTS
1 INTRODUCTION
- 1.1 Study Deliverables
- 1.2 Study Assumptions
- 1.3 Scope of the Study
2 RESEARCH METHODOLOGY
3 EXECUTIVE SUMMARY
4 MARKET INSIGHTS
- 4.1 Current Market Scenario
- 4.2 Technological Trends
- 4.3 Government Regulations and Initiatives
- 4.4 Insights on Office Rents
- 4.5 Insights on Flexible Office Space Startups in India
- 4.6 Insights into Interest Rate Regime for General Economy and Real Estate Lending
- 4.7 Impact of Geopolitics and Pandemic on the Market
5 MARKET DYNAMICS
- 5.1 Market Drivers
- 5.1.1 Rise of Startups and SMEs
- 5.1.2 Increase in Foreign Investment
- 5.2 Market Restraints
- 5.2.1 High Competition and Saturation
- 5.2.2 Lease Flexibility
- 5.3 Market Opportunities
- 5.3.1 Growing Tier - 2 Cities
- 5.3.2 Sustainability and Green Initiatives
- 5.4 Porter's Five Forces Analysis
- 5.4.1 Bargaining Power of Suppliers
- 5.4.2 Bargaining Power of Buyers/Consumers
- 5.4.3 Threat of New Entrants
- 5.4.4 Threat of Substitute Products
- 5.4.5 Intensity of Competitive Rivalry
6 MARKET SEGMENTATION
- 6.1 By Type
- 6.1.1 Private Officees
- 6.1.2 Coworking Offices
- 6.1.3 Virtual Offices
- 6.2 By End User
- 6.2.1 IT and Telecommunications
- 6.2.2 Media and Entertainment
- 6.2.3 Retail and Consumer Goods
- 6.2.4 Other End Users
- 6.3 By City
- 6.3.1 Delhi
- 6.3.2 Mumbai
- 6.3.3 Bangalore
- 6.3.4 Hyderabad
- 6.3.5 Pune
- 6.3.6 Rest of India
7 COMPETITIVE LANDSCAPE
- 7.1 Market Concentration Overview
- 7.2 Company Profiles
- 7.2.1 WeWork
- 7.2.2 Mumbai Coworking
- 7.2.3 Simpliwork
- 7.2.4 The Hive
- 7.2.5 Innov8
- 7.2.6 91Springboard
- 7.2.7 IndiQube
- 7.2.8 Skootr
- 7.2.9 Awfis
- 7.2.10 Smartworks
- 7.2.11 Goodworks
- 7.2.12 Spring House Coworking*
8 FUTURE OF THE MARKET
9 APPENDIX

