
PUBLISHER: Allied Market Research | PRODUCT CODE: 1641792

PUBLISHER: Allied Market Research | PRODUCT CODE: 1641792
U.S. Automotive Composites Market By Fiber Type (Glass Fiber, Carbon Fiber, Others) , By Resin Type (Thermoset, Thermoplastic) By Application (Exterior, Interior, Others) : Opportunity Analysis and Industry Forecast, 2024-2033
U.S. Automotive Composites Market
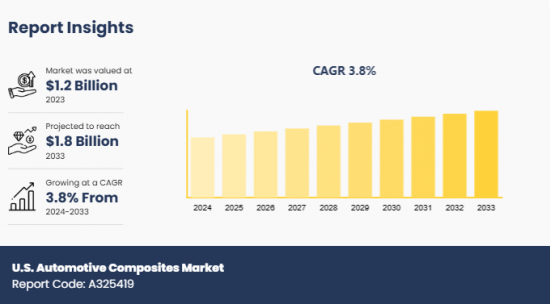
The U.S. automotive composites market was valued at $1.2 billion in 2023 and is projected to reach $1.8 billion by 2033, growing at a CAGR of 3.8% from 2024 to 2033.
Automotive composites are lightweight materials with superior properties formed by blending two or more different substances with distinguished characteristics. These are high-performance objects incorporated into automobiles to improve their fuel efficiency, aesthetics, and durability. The formulation of composites consists of reinforcing materials such as glass or aramid fiber, which are embedded into a matrix material such as epoxy or polyester. The key attributes of automotive composites are their resistance to corrosion and flexibility to be shaped into complex designs. They find applications in different parts of automobiles, including dashboards, doors, roof panels, bumpers, brake components, and hoods.
Rise in awareness regarding the crucial role of lightweight materials in enhancing the fuel efficiency of automobiles has fueled the usage of composites in vehicle designing, thereby propelling the development of the market. Furthermore, the implementation of stringent emission standards by regulatory bodies such as the Environmental Protection Agency is compelling automakers to manufacture light vehicles, which is augmenting the growth of the U.S. automotive composites market. A prominent trend acquiring traction in the market currently is the development of self-healing composites. They are created to withstand or recover from environmental effects & abrasions, resulting in remarkable impact resistance and strength in automobiles.
However, high costs associated with the production of composites restrict their usage in low-cost vehicles, hampering the development of the market. Moreover, lack of efficient recycling options at the end-of-life stage deters several environmentally conscious consumers from purchasing vehicles manufactured using composites, which, in turn, hampers the market growth. On the contrary, exponential surge in the adoption of electric vehicles (EVs) in the U.S. is projected to present remunerative opportunities for the market. Automotive composites are essential for the development of EVs as lightweight materials are pivotal to accelerate the range & efficiency of electric batteries, without compromising the strength and durability. According to an article by The International Council on Clean Transportation-an independent non-profit organization-sales of new light-duty EVs in the U.S. grew by 9% in 2023, reaching around 1.4 million from the approximate value of 1 million in 2022. With rising concerns pertaining to the environmental impact and low fuel efficiency of internal combustion engines, the adoption of EVs is poised to increase notably in the future, opening new avenues for the U.S. automotive composites market.
Segment Review
The U.S. automotive composites market is segmented into fiber type, resin type, and application. Depending on fiber type, the market is divided into glass fiber, carbon fiber, and others. As per resin type, it is bifurcated into thermoset and thermoplastic. By application, it is categorized into exterior, interior, and others.
Key Findings
Depending on fiber type, the glass fiber segment dominated the market in 2023.
As per resin type, the thermoset segment acquired a notable stake in the market in 2023.
By application, the interior segment was the highest shareholder in 2023.
Competition Analysis
The major players in the U.S. automotive composites market include Toray Industries, Inc., Hexcel Corporation, Teijin Limited, Mitsubishi Chemical Corporation, Owens Corning, Huntsman Corporation, Solvay S.A., Magna International Inc., Plasan Carbon Composite, and A. Schulman, Inc. These major players have adopted various key development strategies such as business expansion, new product launches, and partnerships to strengthen their foothold in the competitive market.
Additional benefits you will get with this purchase are:
- Quarterly Update and* (only available with a corporate license, on listed price)
- 5 additional Company Profile of client Choice pre- or Post-purchase, as a free update.
- Free Upcoming Version on the Purchase of Five and Enterprise User License.
- 16 analyst hours of support* (post-purchase, if you find additional data requirements upon review of the report, you may receive support amounting to 16 analyst hours to solve questions, and post-sale queries)
- 15% Free Customization* (in case the scope or segment of the report does not match your requirements, 15% is equivalent to 3 working days of free work, applicable once)
- Free data Pack on the Five and Enterprise User License. (Excel version of the report)
- Free Updated report if the report is 6-12 months old or older.
- 24-hour priority response*
- Free Industry updates and white papers.
Possible Customization with this report (with additional cost and timeline, please talk to the sales executive to know more)
- Analysis of raw material in a product (by %)
- Investment Opportunities
- Product Benchmarking / Product specification and applications
- Supply Chain Analysis & Vendor Margins
- Upcoming/New Entrant by Regions
- Technology Trend Analysis
- Go To Market Strategy
- New Product Development/ Product Matrix of Key Players
- Regulatory Guidelines
- Additional company profiles with specific to client's interest
- Additional country or region analysis- market size and forecast
- Expanded list for Company Profiles
- Historic market data
- Key player details (including location, contact details, supplier/vendor network etc. in excel format)
- List of customers/consumers/raw material suppliers- value chain analysis
- SWOT Analysis
- Volume Market Size and Forecast
Key Market Segments
By Fiber Type
- Glass Fiber
- Carbon Fiber
- Others
By Resin Type
- Thermoset
- Thermoplastic
By Application
- Exterior
- Interior
- Others
Key Market Players:
- Toray Industries, Inc
- Hexcel Corporation
- Teijin Limited
- Mitsubishi Chemical Corporation
- Owens Corning
- Huntsman Corporation
- Solvay S.A.
- Magna International Inc
- Plasan Carbon Composite
- A. Schulman, Inc
TABLE OF CONTENTS
CHAPTER 1: INTRODUCTION
- 1.1. Report Description
- 1.2. Key Market Segments
- 1.3. Key Benefits
- 1.4. Research Methodology
- 1.4.1. Primary Research
- 1.4.2. Secondary Research
- 1.4.3. Analyst Tools and Models
CHAPTER 2: EXECUTIVE SUMMARY
- 2.1. CXO Perspective
CHAPTER 3: MARKET LANDSCAPE
- 3.1. Market Definition and Scope
- 3.2. Key Findings
- 3.2.1. Top Investment Pockets
- 3.2.2. Top Winning Strategies
- 3.3. Porter's Five Forces Analysis
- 3.3.1. Bargaining Power of Suppliers
- 3.3.2. Threat of New Entrants
- 3.3.3. Threat of Substitutes
- 3.3.4. Competitive Rivalry
- 3.3.5. Bargaining Power among Buyers
- 3.4. Market Dynamics
- 3.4.1. Drivers
- 3.4.2. Restraints
- 3.4.3. Opportunities
CHAPTER 4: U.S. AUTOMOTIVE COMPOSITES MARKET, BY FIBER TYPE
- 4.1. Market Overview
- 4.1.1 Market Size and Forecast, By Fiber Type
- 4.2. Glass Fiber
- 4.2.1. Key Market Trends, Growth Factors and Opportunities
- 4.3. Carbon Fiber
- 4.3.1. Key Market Trends, Growth Factors and Opportunities
- 4.4. Others
- 4.4.1. Key Market Trends, Growth Factors and Opportunities
CHAPTER 5: U.S. AUTOMOTIVE COMPOSITES MARKET, BY RESIN TYPE
- 5.1. Market Overview
- 5.1.1 Market Size and Forecast, By Resin Type
- 5.2. Thermoset
- 5.2.1. Key Market Trends, Growth Factors and Opportunities
- 5.3. Thermoplastic
- 5.3.1. Key Market Trends, Growth Factors and Opportunities
CHAPTER 6: U.S. AUTOMOTIVE COMPOSITES MARKET, BY APPLICATION
- 6.1. Market Overview
- 6.1.1 Market Size and Forecast, By Application
- 6.2. Exterior
- 6.2.1. Key Market Trends, Growth Factors and Opportunities
- 6.3. Interior
- 6.3.1. Key Market Trends, Growth Factors and Opportunities
- 6.4. Others
- 6.4.1. Key Market Trends, Growth Factors and Opportunities
CHAPTER 7: COMPETITIVE LANDSCAPE
- 7.1. Introduction
- 7.2. Top Winning Strategies
- 7.3. Product Mapping Of Top 10 Player
- 7.4. Competitive Dashboard
- 7.5. Competitive Heatmap
- 7.6. Top Player Positioning,2023
CHAPTER 8: COMPANY PROFILES
- 8.1. Toray Industries, Inc
- 8.1.1. Company Overview
- 8.1.2. Key Executives
- 8.1.3. Company Snapshot
- 8.1.4. Operating Business Segments
- 8.1.5. Product Portfolio
- 8.1.6. Business Performance
- 8.1.7. Key Strategic Moves and Developments
- 8.2. Hexcel Corporation
- 8.2.1. Company Overview
- 8.2.2. Key Executives
- 8.2.3. Company Snapshot
- 8.2.4. Operating Business Segments
- 8.2.5. Product Portfolio
- 8.2.6. Business Performance
- 8.2.7. Key Strategic Moves and Developments
- 8.3. Teijin Limited
- 8.3.1. Company Overview
- 8.3.2. Key Executives
- 8.3.3. Company Snapshot
- 8.3.4. Operating Business Segments
- 8.3.5. Product Portfolio
- 8.3.6. Business Performance
- 8.3.7. Key Strategic Moves and Developments
- 8.4. Mitsubishi Chemical Corporation
- 8.4.1. Company Overview
- 8.4.2. Key Executives
- 8.4.3. Company Snapshot
- 8.4.4. Operating Business Segments
- 8.4.5. Product Portfolio
- 8.4.6. Business Performance
- 8.4.7. Key Strategic Moves and Developments
- 8.5. Owens Corning
- 8.5.1. Company Overview
- 8.5.2. Key Executives
- 8.5.3. Company Snapshot
- 8.5.4. Operating Business Segments
- 8.5.5. Product Portfolio
- 8.5.6. Business Performance
- 8.5.7. Key Strategic Moves and Developments
- 8.6. Huntsman Corporation
- 8.6.1. Company Overview
- 8.6.2. Key Executives
- 8.6.3. Company Snapshot
- 8.6.4. Operating Business Segments
- 8.6.5. Product Portfolio
- 8.6.6. Business Performance
- 8.6.7. Key Strategic Moves and Developments
- 8.7. Solvay S.A.
- 8.7.1. Company Overview
- 8.7.2. Key Executives
- 8.7.3. Company Snapshot
- 8.7.4. Operating Business Segments
- 8.7.5. Product Portfolio
- 8.7.6. Business Performance
- 8.7.7. Key Strategic Moves and Developments
- 8.8. Magna International Inc
- 8.8.1. Company Overview
- 8.8.2. Key Executives
- 8.8.3. Company Snapshot
- 8.8.4. Operating Business Segments
- 8.8.5. Product Portfolio
- 8.8.6. Business Performance
- 8.8.7. Key Strategic Moves and Developments
- 8.9. Plasan Carbon Composite
- 8.9.1. Company Overview
- 8.9.2. Key Executives
- 8.9.3. Company Snapshot
- 8.9.4. Operating Business Segments
- 8.9.5. Product Portfolio
- 8.9.6. Business Performance
- 8.9.7. Key Strategic Moves and Developments
- 8.10. A. Schulman, Inc
- 8.10.1. Company Overview
- 8.10.2. Key Executives
- 8.10.3. Company Snapshot
- 8.10.4. Operating Business Segments
- 8.10.5. Product Portfolio
- 8.10.6. Business Performance
- 8.10.7. Key Strategic Moves and Developments
- TABLE 1. U.S. AUTOMOTIVE COMPOSITES MARKET, BY FIBER TYPE, 2024 - 2033 ($MILLION)
- TABLE 2. U.S. AUTOMOTIVE COMPOSITES MARKET, BY FIBER TYPE, 2024 - 2033 (KILOTON)
- TABLE 3. U.S. AUTOMOTIVE COMPOSITES MARKET, BY RESIN TYPE, 2024 - 2033 ($MILLION)
- TABLE 4. U.S. AUTOMOTIVE COMPOSITES MARKET, BY RESIN TYPE, 2024 - 2033 (KILOTON)
- TABLE 5. U.S. AUTOMOTIVE COMPOSITES MARKET, BY APPLICATION, 2024 - 2033 ($MILLION)
- TABLE 6. U.S. AUTOMOTIVE COMPOSITES MARKET, BY APPLICATION, 2024 - 2033 (KILOTON)
- TABLE 7. TORAY INDUSTRIES, INC: KEY EXECUTIVES
- TABLE 8. TORAY INDUSTRIES, INC: COMPANY SNAPSHOT
- TABLE 9. TORAY INDUSTRIES, INC: OPERATING SEGMENTS
- TABLE 10. TORAY INDUSTRIES, INC: PRODUCT PORTFOLIO
- TABLE 11. TORAY INDUSTRIES, INC: KEY STRATEGIC MOVES AND DEVELOPMENTS
- TABLE 12. HEXCEL CORPORATION: KEY EXECUTIVES
- TABLE 13. HEXCEL CORPORATION: COMPANY SNAPSHOT
- TABLE 14. HEXCEL CORPORATION: OPERATING SEGMENTS
- TABLE 15. HEXCEL CORPORATION: PRODUCT PORTFOLIO
- TABLE 16. HEXCEL CORPORATION: KEY STRATEGIC MOVES AND DEVELOPMENTS
- TABLE 17. TEIJIN LIMITED: KEY EXECUTIVES
- TABLE 18. TEIJIN LIMITED: COMPANY SNAPSHOT
- TABLE 19. TEIJIN LIMITED: OPERATING SEGMENTS
- TABLE 20. TEIJIN LIMITED: PRODUCT PORTFOLIO
- TABLE 21. TEIJIN LIMITED: KEY STRATEGIC MOVES AND DEVELOPMENTS
- TABLE 22. MITSUBISHI CHEMICAL CORPORATION: KEY EXECUTIVES
- TABLE 23. MITSUBISHI CHEMICAL CORPORATION: COMPANY SNAPSHOT
- TABLE 24. MITSUBISHI CHEMICAL CORPORATION: OPERATING SEGMENTS
- TABLE 25. MITSUBISHI CHEMICAL CORPORATION: PRODUCT PORTFOLIO
- TABLE 26. MITSUBISHI CHEMICAL CORPORATION: KEY STRATEGIC MOVES AND DEVELOPMENTS
- TABLE 27. OWENS CORNING: KEY EXECUTIVES
- TABLE 28. OWENS CORNING: COMPANY SNAPSHOT
- TABLE 29. OWENS CORNING: OPERATING SEGMENTS
- TABLE 30. OWENS CORNING: PRODUCT PORTFOLIO
- TABLE 31. OWENS CORNING: KEY STRATEGIC MOVES AND DEVELOPMENTS
- TABLE 32. HUNTSMAN CORPORATION: KEY EXECUTIVES
- TABLE 33. HUNTSMAN CORPORATION: COMPANY SNAPSHOT
- TABLE 34. HUNTSMAN CORPORATION: OPERATING SEGMENTS
- TABLE 35. HUNTSMAN CORPORATION: PRODUCT PORTFOLIO
- TABLE 36. HUNTSMAN CORPORATION: KEY STRATEGIC MOVES AND DEVELOPMENTS
- TABLE 37. SOLVAY S.A.: KEY EXECUTIVES
- TABLE 38. SOLVAY S.A.: COMPANY SNAPSHOT
- TABLE 39. SOLVAY S.A.: OPERATING SEGMENTS
- TABLE 40. SOLVAY S.A.: PRODUCT PORTFOLIO
- TABLE 41. SOLVAY S.A.: KEY STRATEGIC MOVES AND DEVELOPMENTS
- TABLE 42. MAGNA INTERNATIONAL INC: KEY EXECUTIVES
- TABLE 43. MAGNA INTERNATIONAL INC: COMPANY SNAPSHOT
- TABLE 44. MAGNA INTERNATIONAL INC: OPERATING SEGMENTS
- TABLE 45. MAGNA INTERNATIONAL INC: PRODUCT PORTFOLIO
- TABLE 46. MAGNA INTERNATIONAL INC: KEY STRATEGIC MOVES AND DEVELOPMENTS
- TABLE 47. PLASAN CARBON COMPOSITE: KEY EXECUTIVES
- TABLE 48. PLASAN CARBON COMPOSITE: COMPANY SNAPSHOT
- TABLE 49. PLASAN CARBON COMPOSITE: OPERATING SEGMENTS
- TABLE 50. PLASAN CARBON COMPOSITE: PRODUCT PORTFOLIO
- TABLE 51. PLASAN CARBON COMPOSITE: KEY STRATEGIC MOVES AND DEVELOPMENTS
- TABLE 52. A. SCHULMAN, INC: KEY EXECUTIVES
- TABLE 53. A. SCHULMAN, INC: COMPANY SNAPSHOT
- TABLE 54. A. SCHULMAN, INC: OPERATING SEGMENTS
- TABLE 55. A. SCHULMAN, INC: PRODUCT PORTFOLIO
- TABLE 56. A. SCHULMAN, INC: KEY STRATEGIC MOVES AND DEVELOPMENTS
- FIGURE 1. U.S. AUTOMOTIVE COMPOSITES MARKET,2024 - 2033
- FIGURE 2. SEGMENTATION OF U.S. AUTOMOTIVE COMPOSITES MARKET,2024 - 2033
- FIGURE 3. TOP INVESTMENT POCKET IN U.S. AUTOMOTIVE COMPOSITES MARKET,2024 - 2033
- FIGURE 4. MODERATE BARGAINING POWER OF BUYERS
- FIGURE 5. MODERATE BARGAINING POWER OF SUPPLIERS
- FIGURE 6. MODERATE THREAT OF NEW ENTRANTS
- FIGURE 7. LOW THREAT OF SUBSTITUTION
- FIGURE 8. HIGH COMPETITIVE RIVALRY
- FIGURE 9. OPPORTUNITIES, RESTRAINTS AND DRIVERS: U.S. AUTOMOTIVE COMPOSITES MARKET
- FIGURE 10. U.S. AUTOMOTIVE COMPOSITES MARKET , BY FIBER TYPE,2024 - 2033 ($MILLION)
- FIGURE 11. U.S. AUTOMOTIVE COMPOSITES MARKET , BY RESIN TYPE,2024 - 2033 ($MILLION)
- FIGURE 12. U.S. AUTOMOTIVE COMPOSITES MARKET , BY APPLICATION,2024 - 2033 ($MILLION)
- FIGURE 13. TOP WINNING STRATEGIES, BY YEAR, 2021-2023*
- FIGURE 14. TOP WINNING STRATEGIES, BY DEVELOPMENT, 2021-2023*
- FIGURE 15. TOP WINNING STRATEGIES, BY COMPANY, 2021-2023*
- FIGURE 16. PRODUCT MAPPING OF TOP 10 PLAYERS
- FIGURE 17. COMPETITIVE DASHBOARD
- FIGURE 18. COMPETITIVE HEATMAP: U.S. AUTOMOTIVE COMPOSITES MARKET
- FIGURE 19. TOP PLAYER POSITIONING,2023
- FIGURE 20. TORAY INDUSTRIES, INC: NET SALES, 2021-2023 ($MILLION)
- FIGURE 21. TORAY INDUSTRIES, INC: REVENUE SHARE, BY SEGMENT, 2023 (%)
- FIGURE 22. TORAY INDUSTRIES, INC: REVENUE SHARE, BY REGION, 2023 (%)
- FIGURE 23. HEXCEL CORPORATION: NET SALES, 2021-2023 ($MILLION)
- FIGURE 24. HEXCEL CORPORATION: REVENUE SHARE, BY SEGMENT, 2023 (%)
- FIGURE 25. HEXCEL CORPORATION: REVENUE SHARE, BY REGION, 2023 (%)
- FIGURE 26. TEIJIN LIMITED: NET SALES, 2021-2023 ($MILLION)
- FIGURE 27. TEIJIN LIMITED: REVENUE SHARE, BY SEGMENT, 2023 (%)
- FIGURE 28. TEIJIN LIMITED: REVENUE SHARE, BY REGION, 2023 (%)
- FIGURE 29. MITSUBISHI CHEMICAL CORPORATION: NET SALES, 2021-2023 ($MILLION)
- FIGURE 30. MITSUBISHI CHEMICAL CORPORATION: REVENUE SHARE, BY SEGMENT, 2023 (%)
- FIGURE 31. MITSUBISHI CHEMICAL CORPORATION: REVENUE SHARE, BY REGION, 2023 (%)
- FIGURE 32. OWENS CORNING: NET SALES, 2021-2023 ($MILLION)
- FIGURE 33. OWENS CORNING: REVENUE SHARE, BY SEGMENT, 2023 (%)
- FIGURE 34. OWENS CORNING: REVENUE SHARE, BY REGION, 2023 (%)
- FIGURE 35. HUNTSMAN CORPORATION: NET SALES, 2021-2023 ($MILLION)
- FIGURE 36. HUNTSMAN CORPORATION: REVENUE SHARE, BY SEGMENT, 2023 (%)
- FIGURE 37. HUNTSMAN CORPORATION: REVENUE SHARE, BY REGION, 2023 (%)
- FIGURE 38. SOLVAY S.A.: NET SALES, 2021-2023 ($MILLION)
- FIGURE 39. SOLVAY S.A.: REVENUE SHARE, BY SEGMENT, 2023 (%)
- FIGURE 40. SOLVAY S.A.: REVENUE SHARE, BY REGION, 2023 (%)
- FIGURE 41. MAGNA INTERNATIONAL INC: NET SALES, 2021-2023 ($MILLION)
- FIGURE 42. MAGNA INTERNATIONAL INC: REVENUE SHARE, BY SEGMENT, 2023 (%)
- FIGURE 43. MAGNA INTERNATIONAL INC: REVENUE SHARE, BY REGION, 2023 (%)
- FIGURE 44. PLASAN CARBON COMPOSITE: NET SALES, 2021-2023 ($MILLION)
- FIGURE 45. PLASAN CARBON COMPOSITE: REVENUE SHARE, BY SEGMENT, 2023 (%)
- FIGURE 46. PLASAN CARBON COMPOSITE: REVENUE SHARE, BY REGION, 2023 (%)
- FIGURE 47. A. SCHULMAN, INC: NET SALES, 2021-2023 ($MILLION)
- FIGURE 48. A. SCHULMAN, INC: REVENUE SHARE, BY SEGMENT, 2023 (%)
- FIGURE 49. A. SCHULMAN, INC: REVENUE SHARE, BY REGION, 2023 (%)

