
PUBLISHER: Allied Market Research | PRODUCT CODE: 1641791

PUBLISHER: Allied Market Research | PRODUCT CODE: 1641791
Europe Automotive Composites Market By Fiber Type (Glass Fiber, Carbon Fiber, Others) , By Resin Type (Thermoset, Thermoplastic) By Application (Exterior, Interior, Others) : Opportunity Analysis and Industry Forecast, 2024-2033
Europe Automotive Composites Market
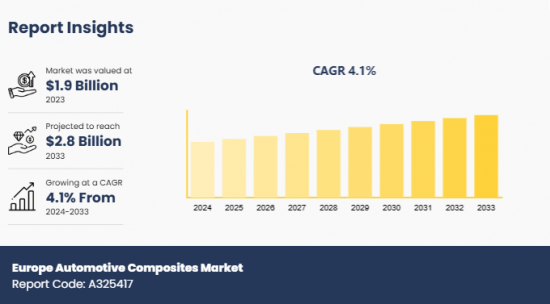
The Europe automotive composites market was valued at $1.9 billion in 2023 and is projected to reach $2.8 billion by 2033, growing at a CAGR of 4.1% from 2024 to 2033.
Automotive composites are lightweight materials that combine two or more distinct substances, each contributing specific properties. These materials are used in vehicles to enhance fuel efficiency, aesthetics, and durability. The composite formulation includes reinforcing materials such as glass or aramid fiber embedded in a matrix material such as epoxy or polyester. Key benefits of automotive composites include corrosion resistance and the ability to be molded into complex shapes. They are used in different parts of automobiles, including dashboards, doors, roof panels, bumpers, brake parts, and hoods.
As the automakers in Europe are seeking technologies that enhance fuel efficiency of vehicles without compromising on performance, the Europe automotive composites market is being driven significantly. In addition, rise in investments in innovative composite manufacturing techniques such as resin transfer molding and compression molding is propelling the development of the market notably. In recent times, R&D for the incorporation of natural fibers such as cellulose into automotive composites has been trending in Europe. This is attributed to the robust physical, chemical, and mechanical properties of natural fibers that are projected to enhance the sustainability and cost-effectiveness of composites.
However, the recycling and disposal of automotive composites requires a robust infrastructure, lack of which impacts long-term sustainability and hampers the growth of the Europe automotive composites market. Moreover, disruptions in the supply chain owing to fluctuations in global trade policies have created a volatile environment for sourcing essential materials, which is restraining the development of the market notably. On the contrary, rise in the sales of electric vehicles (EVs) in Europe is fueling the demand for automotive composites and presenting lucrative opportunities for the market. According to McKinsey, inclination of European consumers toward EVs has increased, as year-over-year EV sales exhibited an average rise of more than 50% from 2020 to 2023. Designing a lightweight EV is crucial to enhance its efficiency, improve fire resistance, and increase mileage per charge. These factors highlight the growing demand for automotive composites in Europe, indicating a promising future for the market.
Segment Review
The Europe automotive composites market is segmented into fiber type, resin type, application, and country. On the basis of fiber type, the market is divided into glass fiber, carbon fiber, and others. Depending on resin type, it is bifurcated into thermoset and thermoplastic. As per application, it is classified into exterior, interior, and others. Country wise, it is analyzed across Germany, France, UK, Spain, Italy, and rest of Europe.
Key Findings
On the basis of fiber type, the glass fiber segment dominated the market in 2023.
Depending on resin type, the thermoset segment acquired a notable stake in the market in 2023.
As per application, the interior segment was the highest shareholder in 2023.
Competition Analysis
The major players in the Europe automotive composites market include SGL Carbon, TEIJIN LIMITED, BASF SE, Solvay S.A., Hexcel Corporation, ZOLTEK Corporation, Evonik Industries AG, Mitsubishi Chemical Group Corporation, Covestro AG, and LANXESS. These major players have adopted various key development strategies such as business expansion, new product launches, and partnerships to strengthen their foothold in the competitive market.
Additional benefits you will get with this purchase are:
- Quarterly Update and* (only available with a corporate license, on listed price)
- 5 additional Company Profile of client Choice pre- or Post-purchase, as a free update.
- Free Upcoming Version on the Purchase of Five and Enterprise User License.
- 16 analyst hours of support* (post-purchase, if you find additional data requirements upon review of the report, you may receive support amounting to 16 analyst hours to solve questions, and post-sale queries)
- 15% Free Customization* (in case the scope or segment of the report does not match your requirements, 15% is equivalent to 3 working days of free work, applicable once)
- Free data Pack on the Five and Enterprise User License. (Excel version of the report)
- Free Updated report if the report is 6-12 months old or older.
- 24-hour priority response*
- Free Industry updates and white papers.
Possible Customization with this report (with additional cost and timeline, please talk to the sales executive to know more)
- Analysis of raw material in a product (by %)
- Investment Opportunities
- Product Benchmarking / Product specification and applications
- Supply Chain Analysis & Vendor Margins
- Upcoming/New Entrant by Regions
- Technology Trend Analysis
- Go To Market Strategy
- New Product Development/ Product Matrix of Key Players
- Regulatory Guidelines
- Additional company profiles with specific to client's interest
- Additional country or region analysis- market size and forecast
- Expanded list for Company Profiles
- Historic market data
- Key player details (including location, contact details, supplier/vendor network etc. in excel format)
- List of customers/consumers/raw material suppliers- value chain analysis
- SWOT Analysis
- Volume Market Size and Forecast
Key Market Segments
By Fiber Type
- Glass Fiber
- Carbon Fiber
- Others
By Resin Type
- Thermoset
- Thermoplastic
By Application
- Exterior
- Interior
- Others
By Country
- Germany
- France
- UK
- Spain
- Italy
- Rest of Europe
Key Market Players:
- SGL Carbon
- TEIJIN LIMITED
- BASF SE
- Solvay S.A.
- Hexcel Corporation
- ZOLTEK Corporation
- Evonik Industries AG
- Mitsubishi Chemical Group Corporation
- Covestro AG
- LANXESS
TABLE OF CONTENTS
CHAPTER 1: INTRODUCTION
- 1.1. Report Description
- 1.2. Key Market Segments
- 1.3. Key Benefits
- 1.4. Research Methodology
- 1.4.1. Primary Research
- 1.4.2. Secondary Research
- 1.4.3. Analyst Tools and Models
CHAPTER 2: EXECUTIVE SUMMARY
- 2.1. CXO Perspective
CHAPTER 3: MARKET LANDSCAPE
- 3.1. Market Definition and Scope
- 3.2. Key Findings
- 3.2.1. Top Investment Pockets
- 3.2.2. Top Winning Strategies
- 3.3. Porter's Five Forces Analysis
- 3.3.1. Bargaining Power of Suppliers
- 3.3.2. Threat of New Entrants
- 3.3.3. Threat of Substitutes
- 3.3.4. Competitive Rivalry
- 3.3.5. Bargaining Power among Buyers
- 3.4. Market Dynamics
- 3.4.1. Drivers
- 3.4.2. Restraints
- 3.4.3. Opportunities
CHAPTER 4: EUROPE AUTOMOTIVE COMPOSITES MARKET, BY FIBER TYPE
- 4.1. Market Overview
- 4.1.1 Market Size and Forecast, By Fiber Type
- 4.2. Glass Fiber
- 4.2.1. Key Market Trends, Growth Factors and Opportunities
- 4.2.2. Market Share Analysis, By Country
- 4.3. Carbon Fiber
- 4.3.1. Key Market Trends, Growth Factors and Opportunities
- 4.3.2. Market Share Analysis, By Country
- 4.4. Others
- 4.4.1. Key Market Trends, Growth Factors and Opportunities
- 4.4.2. Market Share Analysis, By Country
CHAPTER 5: EUROPE AUTOMOTIVE COMPOSITES MARKET, BY RESIN TYPE
- 5.1. Market Overview
- 5.1.1 Market Size and Forecast, By Resin Type
- 5.2. Thermoset
- 5.2.1. Key Market Trends, Growth Factors and Opportunities
- 5.2.2. Market Share Analysis, By Country
- 5.3. Thermoplastic
- 5.3.1. Key Market Trends, Growth Factors and Opportunities
- 5.3.2. Market Share Analysis, By Country
CHAPTER 6: EUROPE AUTOMOTIVE COMPOSITES MARKET, BY APPLICATION
- 6.1. Market Overview
- 6.1.1 Market Size and Forecast, By Application
- 6.2. Exterior
- 6.2.1. Key Market Trends, Growth Factors and Opportunities
- 6.2.2. Market Share Analysis, By Country
- 6.3. Interior
- 6.3.1. Key Market Trends, Growth Factors and Opportunities
- 6.3.2. Market Share Analysis, By Country
- 6.4. Others
- 6.4.1. Key Market Trends, Growth Factors and Opportunities
- 6.4.2. Market Share Analysis, By Country
CHAPTER 7: EUROPE AUTOMOTIVE COMPOSITES MARKET, BY COUNTRY
- 7.1. Market Overview
- 7.1.1 Market Size and Forecast, By Country
- 7.2. Europe
- 7.2.2. Key Market Trends and Opportunities
- 7.2.2. Market Size and Forecast, By Fiber Type
- 7.2.3. Market Size and Forecast, By Resin Type
- 7.2.4. Market Size and Forecast, By Application
- 7.2.5. Market Size and Forecast, By Country
- 7.2.6.Germany
- 7.2.6.1. Market Size and Forecast, By Fiber Type
- 7.2.6.2. Market Size and Forecast, By Resin Type
- 7.2.6.3. Market Size and Forecast, By Application
- 7.2.7.France
- 7.2.7.1. Market Size and Forecast, By Fiber Type
- 7.2.7.2. Market Size and Forecast, By Resin Type
- 7.2.7.3. Market Size and Forecast, By Application
- 7.2.8.UK
- 7.2.8.1. Market Size and Forecast, By Fiber Type
- 7.2.8.2. Market Size and Forecast, By Resin Type
- 7.2.8.3. Market Size and Forecast, By Application
- 7.2.9.Spain
- 7.2.9.1. Market Size and Forecast, By Fiber Type
- 7.2.9.2. Market Size and Forecast, By Resin Type
- 7.2.9.3. Market Size and Forecast, By Application
- 7.2.10.Italy
- 7.2.10.1. Market Size and Forecast, By Fiber Type
- 7.2.10.2. Market Size and Forecast, By Resin Type
- 7.2.10.3. Market Size and Forecast, By Application
- 7.2.11.Rest Of Europe
- 7.2.11.1. Market Size and Forecast, By Fiber Type
- 7.2.11.2. Market Size and Forecast, By Resin Type
- 7.2.11.3. Market Size and Forecast, By Application
CHAPTER 8: COMPETITIVE LANDSCAPE
- 8.1. Introduction
- 8.2. Top Winning Strategies
- 8.3. Product Mapping Of Top 10 Player
- 8.4. Competitive Dashboard
- 8.5. Competitive Heatmap
- 8.6. Top Player Positioning,2023
CHAPTER 9: COMPANY PROFILES
- 9.1. SGL Carbon
- 9.1.1. Company Overview
- 9.1.2. Key Executives
- 9.1.3. Company Snapshot
- 9.1.4. Operating Business Segments
- 9.1.5. Product Portfolio
- 9.1.6. Business Performance
- 9.1.7. Key Strategic Moves and Developments
- 9.2. TEIJIN LIMITED
- 9.2.1. Company Overview
- 9.2.2. Key Executives
- 9.2.3. Company Snapshot
- 9.2.4. Operating Business Segments
- 9.2.5. Product Portfolio
- 9.2.6. Business Performance
- 9.2.7. Key Strategic Moves and Developments
- 9.3. BASF SE
- 9.3.1. Company Overview
- 9.3.2. Key Executives
- 9.3.3. Company Snapshot
- 9.3.4. Operating Business Segments
- 9.3.5. Product Portfolio
- 9.3.6. Business Performance
- 9.3.7. Key Strategic Moves and Developments
- 9.4. Solvay S.A.
- 9.4.1. Company Overview
- 9.4.2. Key Executives
- 9.4.3. Company Snapshot
- 9.4.4. Operating Business Segments
- 9.4.5. Product Portfolio
- 9.4.6. Business Performance
- 9.4.7. Key Strategic Moves and Developments
- 9.5. Hexcel Corporation
- 9.5.1. Company Overview
- 9.5.2. Key Executives
- 9.5.3. Company Snapshot
- 9.5.4. Operating Business Segments
- 9.5.5. Product Portfolio
- 9.5.6. Business Performance
- 9.5.7. Key Strategic Moves and Developments
- 9.6. ZOLTEK Corporation
- 9.6.1. Company Overview
- 9.6.2. Key Executives
- 9.6.3. Company Snapshot
- 9.6.4. Operating Business Segments
- 9.6.5. Product Portfolio
- 9.6.6. Business Performance
- 9.6.7. Key Strategic Moves and Developments
- 9.7. Evonik Industries AG
- 9.7.1. Company Overview
- 9.7.2. Key Executives
- 9.7.3. Company Snapshot
- 9.7.4. Operating Business Segments
- 9.7.5. Product Portfolio
- 9.7.6. Business Performance
- 9.7.7. Key Strategic Moves and Developments
- 9.8. Mitsubishi Chemical Group Corporation
- 9.8.1. Company Overview
- 9.8.2. Key Executives
- 9.8.3. Company Snapshot
- 9.8.4. Operating Business Segments
- 9.8.5. Product Portfolio
- 9.8.6. Business Performance
- 9.8.7. Key Strategic Moves and Developments
- 9.9. Covestro AG
- 9.9.1. Company Overview
- 9.9.2. Key Executives
- 9.9.3. Company Snapshot
- 9.9.4. Operating Business Segments
- 9.9.5. Product Portfolio
- 9.9.6. Business Performance
- 9.9.7. Key Strategic Moves and Developments
- 9.10. LANXESS
- 9.10.1. Company Overview
- 9.10.2. Key Executives
- 9.10.3. Company Snapshot
- 9.10.4. Operating Business Segments
- 9.10.5. Product Portfolio
- 9.10.6. Business Performance
- 9.10.7. Key Strategic Moves and Developments
- TABLE 1. EUROPE AUTOMOTIVE COMPOSITES MARKET, BY FIBER TYPE, 2024 - 2033 ($MILLION)
- TABLE 2. EUROPE AUTOMOTIVE COMPOSITES MARKET, BY FIBER TYPE, 2024 - 2033 (KILOTON)
- TABLE 3. EUROPE AUTOMOTIVE COMPOSITES MARKET FOR GLASS FIBER, BY COUNTRY, 2024 - 2033 ($MILLION)
- TABLE 4. EUROPE AUTOMOTIVE COMPOSITES MARKET FOR GLASS FIBER, BY COUNTRY, 2024 - 2033 (KILOTON)
- TABLE 5. EUROPE AUTOMOTIVE COMPOSITES MARKET FOR CARBON FIBER, BY COUNTRY, 2024 - 2033 ($MILLION)
- TABLE 6. EUROPE AUTOMOTIVE COMPOSITES MARKET FOR CARBON FIBER, BY COUNTRY, 2024 - 2033 (KILOTON)
- TABLE 7. EUROPE AUTOMOTIVE COMPOSITES MARKET FOR OTHERS, BY COUNTRY, 2024 - 2033 ($MILLION)
- TABLE 8. EUROPE AUTOMOTIVE COMPOSITES MARKET FOR OTHERS, BY COUNTRY, 2024 - 2033 (KILOTON)
- TABLE 9. EUROPE AUTOMOTIVE COMPOSITES MARKET, BY RESIN TYPE, 2024 - 2033 ($MILLION)
- TABLE 10. EUROPE AUTOMOTIVE COMPOSITES MARKET, BY RESIN TYPE, 2024 - 2033 (KILOTON)
- TABLE 11. EUROPE AUTOMOTIVE COMPOSITES MARKET FOR THERMOSET, BY COUNTRY, 2024 - 2033 ($MILLION)
- TABLE 12. EUROPE AUTOMOTIVE COMPOSITES MARKET FOR THERMOSET, BY COUNTRY, 2024 - 2033 (KILOTON)
- TABLE 13. EUROPE AUTOMOTIVE COMPOSITES MARKET FOR THERMOPLASTIC, BY COUNTRY, 2024 - 2033 ($MILLION)
- TABLE 14. EUROPE AUTOMOTIVE COMPOSITES MARKET FOR THERMOPLASTIC, BY COUNTRY, 2024 - 2033 (KILOTON)
- TABLE 15. EUROPE AUTOMOTIVE COMPOSITES MARKET, BY APPLICATION, 2024 - 2033 ($MILLION)
- TABLE 16. EUROPE AUTOMOTIVE COMPOSITES MARKET, BY APPLICATION, 2024 - 2033 (KILOTON)
- TABLE 17. EUROPE AUTOMOTIVE COMPOSITES MARKET FOR EXTERIOR, BY COUNTRY, 2024 - 2033 ($MILLION)
- TABLE 18. EUROPE AUTOMOTIVE COMPOSITES MARKET FOR EXTERIOR, BY COUNTRY, 2024 - 2033 (KILOTON)
- TABLE 19. EUROPE AUTOMOTIVE COMPOSITES MARKET FOR INTERIOR, BY COUNTRY, 2024 - 2033 ($MILLION)
- TABLE 20. EUROPE AUTOMOTIVE COMPOSITES MARKET FOR INTERIOR, BY COUNTRY, 2024 - 2033 (KILOTON)
- TABLE 21. EUROPE AUTOMOTIVE COMPOSITES MARKET FOR OTHERS, BY COUNTRY, 2024 - 2033 ($MILLION)
- TABLE 22. EUROPE AUTOMOTIVE COMPOSITES MARKET FOR OTHERS, BY COUNTRY, 2024 - 2033 (KILOTON)
- TABLE 23. EUROPE AUTOMOTIVE COMPOSITES MARKET, BY COUNTRY, 2024 - 2033 ($MILLION)
- TABLE 24. EUROPE AUTOMOTIVE COMPOSITES MARKET, BY COUNTRY, 2024 - 2033 (KILOTON)
- TABLE 25. EUROPE AUTOMOTIVE COMPOSITES MARKET, BY FIBER TYPE, 2024 - 2033 ($MILLION)
- TABLE 26. EUROPE AUTOMOTIVE COMPOSITES MARKET, BY FIBER TYPE, 2024 - 2033 (KILOTON)
- TABLE 27. EUROPE AUTOMOTIVE COMPOSITES MARKET, BY RESIN TYPE, 2024 - 2033 ($MILLION)
- TABLE 28. EUROPE AUTOMOTIVE COMPOSITES MARKET, BY RESIN TYPE, 2024 - 2033 (KILOTON)
- TABLE 29. EUROPE AUTOMOTIVE COMPOSITES MARKET, BY APPLICATION, 2024 - 2033 ($MILLION)
- TABLE 30. EUROPE AUTOMOTIVE COMPOSITES MARKET, BY APPLICATION, 2024 - 2033 (KILOTON)
- TABLE 31. GERMANY AUTOMOTIVE COMPOSITES MARKET, BY FIBER TYPE, 2024 - 2033 ($MILLION)
- TABLE 32. GERMANY AUTOMOTIVE COMPOSITES MARKET, BY FIBER TYPE, 2024 - 2033 (KILOTON)
- TABLE 33. GERMANY AUTOMOTIVE COMPOSITES MARKET, BY RESIN TYPE, 2024 - 2033 ($MILLION)
- TABLE 34. GERMANY AUTOMOTIVE COMPOSITES MARKET, BY RESIN TYPE, 2024 - 2033 (KILOTON)
- TABLE 35. GERMANY AUTOMOTIVE COMPOSITES MARKET, BY APPLICATION, 2024 - 2033 ($MILLION)
- TABLE 36. GERMANY AUTOMOTIVE COMPOSITES MARKET, BY APPLICATION, 2024 - 2033 (KILOTON)
- TABLE 37. FRANCE AUTOMOTIVE COMPOSITES MARKET, BY FIBER TYPE, 2024 - 2033 ($MILLION)
- TABLE 38. FRANCE AUTOMOTIVE COMPOSITES MARKET, BY FIBER TYPE, 2024 - 2033 (KILOTON)
- TABLE 39. FRANCE AUTOMOTIVE COMPOSITES MARKET, BY RESIN TYPE, 2024 - 2033 ($MILLION)
- TABLE 40. FRANCE AUTOMOTIVE COMPOSITES MARKET, BY RESIN TYPE, 2024 - 2033 (KILOTON)
- TABLE 41. FRANCE AUTOMOTIVE COMPOSITES MARKET, BY APPLICATION, 2024 - 2033 ($MILLION)
- TABLE 42. FRANCE AUTOMOTIVE COMPOSITES MARKET, BY APPLICATION, 2024 - 2033 (KILOTON)
- TABLE 43. UK AUTOMOTIVE COMPOSITES MARKET, BY FIBER TYPE, 2024 - 2033 ($MILLION)
- TABLE 44. UK AUTOMOTIVE COMPOSITES MARKET, BY FIBER TYPE, 2024 - 2033 (KILOTON)
- TABLE 45. UK AUTOMOTIVE COMPOSITES MARKET, BY RESIN TYPE, 2024 - 2033 ($MILLION)
- TABLE 46. UK AUTOMOTIVE COMPOSITES MARKET, BY RESIN TYPE, 2024 - 2033 (KILOTON)
- TABLE 47. UK AUTOMOTIVE COMPOSITES MARKET, BY APPLICATION, 2024 - 2033 ($MILLION)
- TABLE 48. UK AUTOMOTIVE COMPOSITES MARKET, BY APPLICATION, 2024 - 2033 (KILOTON)
- TABLE 49. SPAIN AUTOMOTIVE COMPOSITES MARKET, BY FIBER TYPE, 2024 - 2033 ($MILLION)
- TABLE 50. SPAIN AUTOMOTIVE COMPOSITES MARKET, BY FIBER TYPE, 2024 - 2033 (KILOTON)
- TABLE 51. SPAIN AUTOMOTIVE COMPOSITES MARKET, BY RESIN TYPE, 2024 - 2033 ($MILLION)
- TABLE 52. SPAIN AUTOMOTIVE COMPOSITES MARKET, BY RESIN TYPE, 2024 - 2033 (KILOTON)
- TABLE 53. SPAIN AUTOMOTIVE COMPOSITES MARKET, BY APPLICATION, 2024 - 2033 ($MILLION)
- TABLE 54. SPAIN AUTOMOTIVE COMPOSITES MARKET, BY APPLICATION, 2024 - 2033 (KILOTON)
- TABLE 55. ITALY AUTOMOTIVE COMPOSITES MARKET, BY FIBER TYPE, 2024 - 2033 ($MILLION)
- TABLE 56. ITALY AUTOMOTIVE COMPOSITES MARKET, BY FIBER TYPE, 2024 - 2033 (KILOTON)
- TABLE 57. ITALY AUTOMOTIVE COMPOSITES MARKET, BY RESIN TYPE, 2024 - 2033 ($MILLION)
- TABLE 58. ITALY AUTOMOTIVE COMPOSITES MARKET, BY RESIN TYPE, 2024 - 2033 (KILOTON)
- TABLE 59. ITALY AUTOMOTIVE COMPOSITES MARKET, BY APPLICATION, 2024 - 2033 ($MILLION)
- TABLE 60. ITALY AUTOMOTIVE COMPOSITES MARKET, BY APPLICATION, 2024 - 2033 (KILOTON)
- TABLE 61. REST OF EUROPE AUTOMOTIVE COMPOSITES MARKET, BY FIBER TYPE, 2024 - 2033 ($MILLION)
- TABLE 62. REST OF EUROPE AUTOMOTIVE COMPOSITES MARKET, BY FIBER TYPE, 2024 - 2033 (KILOTON)
- TABLE 63. REST OF EUROPE AUTOMOTIVE COMPOSITES MARKET, BY RESIN TYPE, 2024 - 2033 ($MILLION)
- TABLE 64. REST OF EUROPE AUTOMOTIVE COMPOSITES MARKET, BY RESIN TYPE, 2024 - 2033 (KILOTON)
- TABLE 65. REST OF EUROPE AUTOMOTIVE COMPOSITES MARKET, BY APPLICATION, 2024 - 2033 ($MILLION)
- TABLE 66. REST OF EUROPE AUTOMOTIVE COMPOSITES MARKET, BY APPLICATION, 2024 - 2033 (KILOTON)
- TABLE 67. SGL CARBON: KEY EXECUTIVES
- TABLE 68. SGL CARBON: COMPANY SNAPSHOT
- TABLE 69. SGL CARBON: OPERATING SEGMENTS
- TABLE 70. SGL CARBON: PRODUCT PORTFOLIO
- TABLE 71. SGL CARBON: KEY STRATEGIC MOVES AND DEVELOPMENTS
- TABLE 72. TEIJIN LIMITED: KEY EXECUTIVES
- TABLE 73. TEIJIN LIMITED: COMPANY SNAPSHOT
- TABLE 74. TEIJIN LIMITED: OPERATING SEGMENTS
- TABLE 75. TEIJIN LIMITED: PRODUCT PORTFOLIO
- TABLE 76. TEIJIN LIMITED: KEY STRATEGIC MOVES AND DEVELOPMENTS
- TABLE 77. BASF SE: KEY EXECUTIVES
- TABLE 78. BASF SE: COMPANY SNAPSHOT
- TABLE 79. BASF SE: OPERATING SEGMENTS
- TABLE 80. BASF SE: PRODUCT PORTFOLIO
- TABLE 81. BASF SE: KEY STRATEGIC MOVES AND DEVELOPMENTS
- TABLE 82. SOLVAY S.A.: KEY EXECUTIVES
- TABLE 83. SOLVAY S.A.: COMPANY SNAPSHOT
- TABLE 84. SOLVAY S.A.: OPERATING SEGMENTS
- TABLE 85. SOLVAY S.A.: PRODUCT PORTFOLIO
- TABLE 86. SOLVAY S.A.: KEY STRATEGIC MOVES AND DEVELOPMENTS
- TABLE 87. HEXCEL CORPORATION: KEY EXECUTIVES
- TABLE 88. HEXCEL CORPORATION: COMPANY SNAPSHOT
- TABLE 89. HEXCEL CORPORATION: OPERATING SEGMENTS
- TABLE 90. HEXCEL CORPORATION: PRODUCT PORTFOLIO
- TABLE 91. HEXCEL CORPORATION: KEY STRATEGIC MOVES AND DEVELOPMENTS
- TABLE 92. ZOLTEK CORPORATION: KEY EXECUTIVES
- TABLE 93. ZOLTEK CORPORATION: COMPANY SNAPSHOT
- TABLE 94. ZOLTEK CORPORATION: OPERATING SEGMENTS
- TABLE 95. ZOLTEK CORPORATION: PRODUCT PORTFOLIO
- TABLE 96. ZOLTEK CORPORATION: KEY STRATEGIC MOVES AND DEVELOPMENTS
- TABLE 97. EVONIK INDUSTRIES AG: KEY EXECUTIVES
- TABLE 98. EVONIK INDUSTRIES AG: COMPANY SNAPSHOT
- TABLE 99. EVONIK INDUSTRIES AG: OPERATING SEGMENTS
- TABLE 100. EVONIK INDUSTRIES AG: PRODUCT PORTFOLIO
- TABLE 101. EVONIK INDUSTRIES AG: KEY STRATEGIC MOVES AND DEVELOPMENTS
- TABLE 102. MITSUBISHI CHEMICAL GROUP CORPORATION: KEY EXECUTIVES
- TABLE 103. MITSUBISHI CHEMICAL GROUP CORPORATION: COMPANY SNAPSHOT
- TABLE 104. MITSUBISHI CHEMICAL GROUP CORPORATION: OPERATING SEGMENTS
- TABLE 105. MITSUBISHI CHEMICAL GROUP CORPORATION: PRODUCT PORTFOLIO
- TABLE 106. MITSUBISHI CHEMICAL GROUP CORPORATION: KEY STRATEGIC MOVES AND DEVELOPMENTS
- TABLE 107. COVESTRO AG: KEY EXECUTIVES
- TABLE 108. COVESTRO AG: COMPANY SNAPSHOT
- TABLE 109. COVESTRO AG: OPERATING SEGMENTS
- TABLE 110. COVESTRO AG: PRODUCT PORTFOLIO
- TABLE 111. COVESTRO AG: KEY STRATEGIC MOVES AND DEVELOPMENTS
- TABLE 112. LANXESS: KEY EXECUTIVES
- TABLE 113. LANXESS: COMPANY SNAPSHOT
- TABLE 114. LANXESS: OPERATING SEGMENTS
- TABLE 115. LANXESS: PRODUCT PORTFOLIO
- TABLE 116. LANXESS: KEY STRATEGIC MOVES AND DEVELOPMENTS
- FIGURE 1. EUROPE AUTOMOTIVE COMPOSITES MARKET,2024 - 2033
- FIGURE 2. SEGMENTATION OF EUROPE AUTOMOTIVE COMPOSITES MARKET,2024 - 2033
- FIGURE 3. TOP INVESTMENT POCKET IN EUROPE AUTOMOTIVE COMPOSITES MARKET,2024 - 2033
- FIGURE 4. MODERATE BARGAINING POWER OF BUYERS
- FIGURE 5. MODERATE BARGAINING POWER OF SUPPLIERS
- FIGURE 6. MODERATE THREAT OF NEW ENTRANTS
- FIGURE 7. LOW THREAT OF SUBSTITUTION
- FIGURE 8. HIGH COMPETITIVE RIVALRY
- FIGURE 9. OPPORTUNITIES, RESTRAINTS AND DRIVERS: EUROPE AUTOMOTIVE COMPOSITES MARKET
- FIGURE 10. EUROPE AUTOMOTIVE COMPOSITES MARKET , BY FIBER TYPE,2024 - 2033 ($MILLION)
- FIGURE 11. EUROPE AUTOMOTIVE COMPOSITES MARKET FOR GLASS FIBER, BY COUNTRY, 2024 - 2033 ($MILLION)
- FIGURE 12. EUROPE AUTOMOTIVE COMPOSITES MARKET FOR CARBON FIBER, BY COUNTRY, 2024 - 2033 ($MILLION)
- FIGURE 13. EUROPE AUTOMOTIVE COMPOSITES MARKET FOR OTHERS, BY COUNTRY, 2024 - 2033 ($MILLION)
- FIGURE 14. EUROPE AUTOMOTIVE COMPOSITES MARKET , BY RESIN TYPE,2024 - 2033 ($MILLION)
- FIGURE 15. EUROPE AUTOMOTIVE COMPOSITES MARKET FOR THERMOSET, BY COUNTRY, 2024 - 2033 ($MILLION)
- FIGURE 16. EUROPE AUTOMOTIVE COMPOSITES MARKET FOR THERMOPLASTIC, BY COUNTRY, 2024 - 2033 ($MILLION)
- FIGURE 17. EUROPE AUTOMOTIVE COMPOSITES MARKET , BY APPLICATION,2024 - 2033 ($MILLION)
- FIGURE 18. EUROPE AUTOMOTIVE COMPOSITES MARKET FOR EXTERIOR, BY COUNTRY, 2024 - 2033 ($MILLION)
- FIGURE 19. EUROPE AUTOMOTIVE COMPOSITES MARKET FOR INTERIOR, BY COUNTRY, 2024 - 2033 ($MILLION)
- FIGURE 20. EUROPE AUTOMOTIVE COMPOSITES MARKET FOR OTHERS, BY COUNTRY, 2024 - 2033 ($MILLION)
- FIGURE 21. TOP WINNING STRATEGIES, BY YEAR, 2021-2023*
- FIGURE 22. TOP WINNING STRATEGIES, BY DEVELOPMENT, 2021-2023*
- FIGURE 23. TOP WINNING STRATEGIES, BY COMPANY, 2021-2023*
- FIGURE 24. PRODUCT MAPPING OF TOP 10 PLAYERS
- FIGURE 25. COMPETITIVE DASHBOARD
- FIGURE 26. COMPETITIVE HEATMAP: EUROPE AUTOMOTIVE COMPOSITES MARKET
- FIGURE 27. TOP PLAYER POSITIONING,2023
- FIGURE 28. SGL CARBON: NET SALES, 2021-2023 ($MILLION)
- FIGURE 29. SGL CARBON: REVENUE SHARE, BY SEGMENT, 2023 (%)
- FIGURE 30. SGL CARBON: REVENUE SHARE, BY REGION, 2023 (%)
- FIGURE 31. TEIJIN LIMITED: NET SALES, 2021-2023 ($MILLION)
- FIGURE 32. TEIJIN LIMITED: REVENUE SHARE, BY SEGMENT, 2023 (%)
- FIGURE 33. TEIJIN LIMITED: REVENUE SHARE, BY REGION, 2023 (%)
- FIGURE 34. BASF SE: NET SALES, 2021-2023 ($MILLION)
- FIGURE 35. BASF SE: REVENUE SHARE, BY SEGMENT, 2023 (%)
- FIGURE 36. BASF SE: REVENUE SHARE, BY REGION, 2023 (%)
- FIGURE 37. SOLVAY S.A.: NET SALES, 2021-2023 ($MILLION)
- FIGURE 38. SOLVAY S.A.: REVENUE SHARE, BY SEGMENT, 2023 (%)
- FIGURE 39. SOLVAY S.A.: REVENUE SHARE, BY REGION, 2023 (%)
- FIGURE 40. HEXCEL CORPORATION: NET SALES, 2021-2023 ($MILLION)
- FIGURE 41. HEXCEL CORPORATION: REVENUE SHARE, BY SEGMENT, 2023 (%)
- FIGURE 42. HEXCEL CORPORATION: REVENUE SHARE, BY REGION, 2023 (%)
- FIGURE 43. ZOLTEK CORPORATION: NET SALES, 2021-2023 ($MILLION)
- FIGURE 44. ZOLTEK CORPORATION: REVENUE SHARE, BY SEGMENT, 2023 (%)
- FIGURE 45. ZOLTEK CORPORATION: REVENUE SHARE, BY REGION, 2023 (%)
- FIGURE 46. EVONIK INDUSTRIES AG: NET SALES, 2021-2023 ($MILLION)
- FIGURE 47. EVONIK INDUSTRIES AG: REVENUE SHARE, BY SEGMENT, 2023 (%)
- FIGURE 48. EVONIK INDUSTRIES AG: REVENUE SHARE, BY REGION, 2023 (%)
- FIGURE 49. MITSUBISHI CHEMICAL GROUP CORPORATION: NET SALES, 2021-2023 ($MILLION)
- FIGURE 50. MITSUBISHI CHEMICAL GROUP CORPORATION: REVENUE SHARE, BY SEGMENT, 2023 (%)
- FIGURE 51. MITSUBISHI CHEMICAL GROUP CORPORATION: REVENUE SHARE, BY REGION, 2023 (%)
- FIGURE 52. COVESTRO AG: NET SALES, 2021-2023 ($MILLION)
- FIGURE 53. COVESTRO AG: REVENUE SHARE, BY SEGMENT, 2023 (%)
- FIGURE 54. COVESTRO AG: REVENUE SHARE, BY REGION, 2023 (%)
- FIGURE 55. LANXESS: NET SALES, 2021-2023 ($MILLION)
- FIGURE 56. LANXESS: REVENUE SHARE, BY SEGMENT, 2023 (%)
- FIGURE 57. LANXESS: REVENUE SHARE, BY REGION, 2023 (%)

