
PUBLISHER: Allied Market Research | PRODUCT CODE: 1641749

PUBLISHER: Allied Market Research | PRODUCT CODE: 1641749
UK Foot Care Products Market By Product , By Application By Distribution Channel : Opportunity Analysis and Industry Forecast, 2024-2034
UK Foot Care Products Market
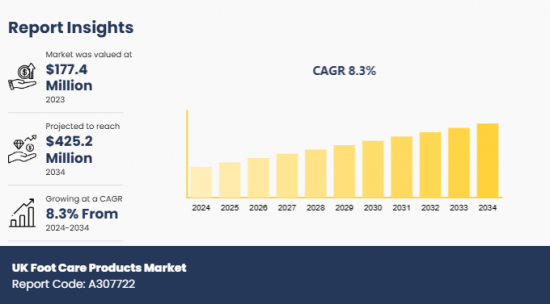
The UK foot care products market was valued at $177.4 million in 2023 and is projected to reach $425.2 million by 2034, growing at a CAGR of 8.3% from 2024 to 2034.
Foot care products involve a broad range of goods that improve the health and appearance of human feet. These products cater to several foot issues such as basic hygiene, infections, dry & dead skin, and foot pain. Proper maintenance of the feet is essential to improve overall foot health and prevent infections or disease conditions.
Increase in focus of individuals toward self-care routines has boosted the demand for foot care products in the UK, which is driving the growth of the market. In addition, rise in the prevalence of several foot conditions such as athlete's foot, plantar fasciitis, bunions, and cracked heels has augmented the development of the market notably. Furthermore, surge in the popularity of e-commerce platforms has propelled the UK foot care products market growth by increasing the awareness and accessibility of these commodities. Currently, the development of products that target certain disease-related foot complications has become a notable trend in the UK. For instance, rise in the incidence of diabetes has resulted in several foot conditions such as blisters, numbness, or ulcers that has fueled the demand for diabetic socks, insoles, diabetic footwear, and wound care products.
However, the high price point of specialty foot care products limits their accessibility to certain consumer groups, which hampers the development of the market. Moreover, rise in the do-it-yourself & home remedies culture hinders the demand for foot care products and restrains the market growth. Contrarily, as the individuals of the country are considerably inclining toward active lifestyle and engaging in foot exercises such as running, the UK foot care products market is anticipated to witness remunerative opportunities. According to Aspire-a London-based sports PR agency-the UK witnessed a sharp rise in the number of runners in 2024 with more than 10.9, which was a 2 million rise from 2023. This surge indicates a bright future for the market due to projected increase in demand for specialized foot care products such as pain-relief balms and ointments to prevent blisters & foot fatigue.
Segment Review
The UK foot care products market is segmented into product, application, and distribution channel. On the basis of product, the market is divided into foot repair ointment, foot creams, foot cleansing lotions, slough scrub products, and others. According to application, it is classified into sports & athletics, medical, and personal comfort. By distribution channel, it is categorized into drug stores & pharmacies, hospitals & specialty clinics, online stores, and others.
Key Findings
On the basis of product, the foot creams segment dominated the market in 2023.
According to application, the medical segment held the highest market share in 2023.
By distribution channel, the hospitals & specialty clinics segment acquired a notable stake in the market in 2023.
Competition Analysis
The major players in the UK Foot care products market include Blistex Inc., Revlon, Inc., Miracle of Aloe, Aetna Foot Products, Alva-Amco Pharmacal Companies, LLC, Combe, Incorporated, HoMedics USA LLC, Scholls Wellness Co., GlaxoSmithKline Plc., and PediFix Inc. These major players have adopted various key development strategies such as business expansion, new product launches, and partnerships to strengthen their foothold in the competitive market.
Additional benefits you will get with this purchase are:
- Quarterly Update and* (only available with a corporate license, on listed price)
- 5 additional Company Profile of client Choice pre- or Post-purchase, as a free update.
- Free Upcoming Version on the Purchase of Five and Enterprise User License.
- 16 analyst hours of support* (post-purchase, if you find additional data requirements upon review of the report, you may receive support amounting to 16 analyst hours to solve questions, and post-sale queries)
- 15% Free Customization* (in case the scope or segment of the report does not match your requirements, 15% is equivalent to 3 working days of free work, applicable once)
- Free data Pack on the Five and Enterprise User License. (Excel version of the report)
- Free Updated report if the report is 6-12 months old or older.
- 24-hour priority response*
- Free Industry updates and white papers.
Possible Customization with this report (with additional cost and timeline, please talk to the sales executive to know more)
- Consumer Buying Behavior Analysis
- Additional company profiles with specific to client's interest
- Additional country or region analysis- market size and forecast
- Brands Share Analysis
- Historic market data
Key Market Segments
By Product
- Foot Repair Ointment
- Foot Creams
- Foot Cleansing Lotions
- Slough Scrub Products
- Others
By Application
- Sports and Athletics
- Medical
- Personal Comfort
By Distribution Channel
- Drug stores and Pharmacies
- Hospitals and Specialty Clinics
- Online Stores
- Others
Key Market Players:
- Blistex Inc.
- Revlon, Inc.
- Miracle of Aloe
- Aetna Foot Products
- Alva-Amco Pharmacal Companies, LLC
- Combe, Incorporated
- HoMedics USA LLC
- Scholls Wellness Co.
- GlaxoSmithKline Plc.
- PediFix Inc
TABLE OF CONTENTS
CHAPTER 1: INTRODUCTION
- 1.1. Report Description
- 1.2. Key Market Segments
- 1.3. Key Benefits
- 1.4. Research Methodology
- 1.4.1. Primary Research
- 1.4.2. Secondary Research
- 1.4.3. Analyst Tools and Models
CHAPTER 2: EXECUTIVE SUMMARY
- 2.1. CXO Perspective
CHAPTER 3: MARKET LANDSCAPE
- 3.1. Market Definition and Scope
- 3.2. Key Findings
- 3.2.1. Top Investment Pockets
- 3.2.2. Top Winning Strategies
- 3.3. Porter's Five Forces Analysis
- 3.3.1. Bargaining Power of Suppliers
- 3.3.2. Threat of New Entrants
- 3.3.3. Threat of Substitutes
- 3.3.4. Competitive Rivalry
- 3.3.5. Bargaining Power among Buyers
- 3.4. Market Dynamics
- 3.4.1. Drivers
- 3.4.2. Restraints
- 3.4.3. Opportunities
CHAPTER 4: UK FOOT CARE PRODUCTS MARKET, BY PRODUCT
- 4.1. Market Overview
- 4.1.1 Market Size and Forecast, By Product
- 4.2. Foot Repair Ointment
- 4.2.1. Key Market Trends, Growth Factors and Opportunities
- 4.3. Foot Creams
- 4.3.1. Key Market Trends, Growth Factors and Opportunities
- 4.4. Foot Cleansing Lotions
- 4.4.1. Key Market Trends, Growth Factors and Opportunities
- 4.5. Slough Scrub Products
- 4.5.1. Key Market Trends, Growth Factors and Opportunities
- 4.6. Others
- 4.6.1. Key Market Trends, Growth Factors and Opportunities
CHAPTER 5: UK FOOT CARE PRODUCTS MARKET, BY APPLICATION
- 5.1. Market Overview
- 5.1.1 Market Size and Forecast, By Application
- 5.2. Sports And Athletics
- 5.2.1. Key Market Trends, Growth Factors and Opportunities
- 5.3. Medical
- 5.3.1. Key Market Trends, Growth Factors and Opportunities
- 5.4. Personal Comfort
- 5.4.1. Key Market Trends, Growth Factors and Opportunities
CHAPTER 6: UK FOOT CARE PRODUCTS MARKET, BY DISTRIBUTION CHANNEL
- 6.1. Market Overview
- 6.1.1 Market Size and Forecast, By Distribution Channel
- 6.2. Drug Stores And Pharmacies
- 6.2.1. Key Market Trends, Growth Factors and Opportunities
- 6.3. Hospitals And Specialty Clinics
- 6.3.1. Key Market Trends, Growth Factors and Opportunities
- 6.4. Online Stores
- 6.4.1. Key Market Trends, Growth Factors and Opportunities
- 6.5. Others
- 6.5.1. Key Market Trends, Growth Factors and Opportunities
CHAPTER 7: COMPETITIVE LANDSCAPE
- 7.1. Introduction
- 7.2. Top Winning Strategies
- 7.3. Product Mapping Of Top 10 Player
- 7.4. Competitive Dashboard
- 7.5. Competitive Heatmap
- 7.6. Top Player Positioning,2023
CHAPTER 8: COMPANY PROFILES
- 8.1. Blistex Inc.
- 8.1.1. Company Overview
- 8.1.2. Key Executives
- 8.1.3. Company Snapshot
- 8.1.4. Operating Business Segments
- 8.1.5. Product Portfolio
- 8.1.6. Business Performance
- 8.1.7. Key Strategic Moves and Developments
- 8.2. Revlon, Inc.
- 8.2.1. Company Overview
- 8.2.2. Key Executives
- 8.2.3. Company Snapshot
- 8.2.4. Operating Business Segments
- 8.2.5. Product Portfolio
- 8.2.6. Business Performance
- 8.2.7. Key Strategic Moves and Developments
- 8.3. Miracle Of Aloe
- 8.3.1. Company Overview
- 8.3.2. Key Executives
- 8.3.3. Company Snapshot
- 8.3.4. Operating Business Segments
- 8.3.5. Product Portfolio
- 8.3.6. Business Performance
- 8.3.7. Key Strategic Moves and Developments
- 8.4. Aetna Foot Products
- 8.4.1. Company Overview
- 8.4.2. Key Executives
- 8.4.3. Company Snapshot
- 8.4.4. Operating Business Segments
- 8.4.5. Product Portfolio
- 8.4.6. Business Performance
- 8.4.7. Key Strategic Moves and Developments
- 8.5. Alva-Amco Pharmacal Companies, LLC
- 8.5.1. Company Overview
- 8.5.2. Key Executives
- 8.5.3. Company Snapshot
- 8.5.4. Operating Business Segments
- 8.5.5. Product Portfolio
- 8.5.6. Business Performance
- 8.5.7. Key Strategic Moves and Developments
- 8.6. Combe, Incorporated
- 8.6.1. Company Overview
- 8.6.2. Key Executives
- 8.6.3. Company Snapshot
- 8.6.4. Operating Business Segments
- 8.6.5. Product Portfolio
- 8.6.6. Business Performance
- 8.6.7. Key Strategic Moves and Developments
- 8.7. HoMedics USA LLC
- 8.7.1. Company Overview
- 8.7.2. Key Executives
- 8.7.3. Company Snapshot
- 8.7.4. Operating Business Segments
- 8.7.5. Product Portfolio
- 8.7.6. Business Performance
- 8.7.7. Key Strategic Moves and Developments
- 8.8. Scholls Wellness Co.
- 8.8.1. Company Overview
- 8.8.2. Key Executives
- 8.8.3. Company Snapshot
- 8.8.4. Operating Business Segments
- 8.8.5. Product Portfolio
- 8.8.6. Business Performance
- 8.8.7. Key Strategic Moves and Developments
- 8.9. GlaxoSmithKline Plc.
- 8.9.1. Company Overview
- 8.9.2. Key Executives
- 8.9.3. Company Snapshot
- 8.9.4. Operating Business Segments
- 8.9.5. Product Portfolio
- 8.9.6. Business Performance
- 8.9.7. Key Strategic Moves and Developments
- 8.10. PediFix Inc
- 8.10.1. Company Overview
- 8.10.2. Key Executives
- 8.10.3. Company Snapshot
- 8.10.4. Operating Business Segments
- 8.10.5. Product Portfolio
- 8.10.6. Business Performance
- 8.10.7. Key Strategic Moves and Developments
- TABLE 1. UK FOOT CARE PRODUCTS MARKET, BY PRODUCT, 2024 - 2034 ($MILLION)
- TABLE 2. UK FOOT CARE PRODUCTS MARKET, BY APPLICATION, 2024 - 2034 ($MILLION)
- TABLE 3. UK FOOT CARE PRODUCTS MARKET, BY DISTRIBUTION CHANNEL, 2024 - 2034 ($MILLION)
- TABLE 4. BLISTEX INC.: KEY EXECUTIVES
- TABLE 5. BLISTEX INC.: COMPANY SNAPSHOT
- TABLE 6. BLISTEX INC.: OPERATING SEGMENTS
- TABLE 7. BLISTEX INC.: PRODUCT PORTFOLIO
- TABLE 8. BLISTEX INC.: KEY STRATEGIC MOVES AND DEVELOPMENTS
- TABLE 9. REVLON, INC.: KEY EXECUTIVES
- TABLE 10. REVLON, INC.: COMPANY SNAPSHOT
- TABLE 11. REVLON, INC.: OPERATING SEGMENTS
- TABLE 12. REVLON, INC.: PRODUCT PORTFOLIO
- TABLE 13. REVLON, INC.: KEY STRATEGIC MOVES AND DEVELOPMENTS
- TABLE 14. MIRACLE OF ALOE: KEY EXECUTIVES
- TABLE 15. MIRACLE OF ALOE: COMPANY SNAPSHOT
- TABLE 16. MIRACLE OF ALOE: OPERATING SEGMENTS
- TABLE 17. MIRACLE OF ALOE: PRODUCT PORTFOLIO
- TABLE 18. MIRACLE OF ALOE: KEY STRATEGIC MOVES AND DEVELOPMENTS
- TABLE 19. AETNA FOOT PRODUCTS: KEY EXECUTIVES
- TABLE 20. AETNA FOOT PRODUCTS: COMPANY SNAPSHOT
- TABLE 21. AETNA FOOT PRODUCTS: OPERATING SEGMENTS
- TABLE 22. AETNA FOOT PRODUCTS: PRODUCT PORTFOLIO
- TABLE 23. AETNA FOOT PRODUCTS: KEY STRATEGIC MOVES AND DEVELOPMENTS
- TABLE 24. ALVA-AMCO PHARMACAL COMPANIES, LLC: KEY EXECUTIVES
- TABLE 25. ALVA-AMCO PHARMACAL COMPANIES, LLC: COMPANY SNAPSHOT
- TABLE 26. ALVA-AMCO PHARMACAL COMPANIES, LLC: OPERATING SEGMENTS
- TABLE 27. ALVA-AMCO PHARMACAL COMPANIES, LLC: PRODUCT PORTFOLIO
- TABLE 28. ALVA-AMCO PHARMACAL COMPANIES, LLC: KEY STRATEGIC MOVES AND DEVELOPMENTS
- TABLE 29. COMBE, INCORPORATED: KEY EXECUTIVES
- TABLE 30. COMBE, INCORPORATED: COMPANY SNAPSHOT
- TABLE 31. COMBE, INCORPORATED: OPERATING SEGMENTS
- TABLE 32. COMBE, INCORPORATED: PRODUCT PORTFOLIO
- TABLE 33. COMBE, INCORPORATED: KEY STRATEGIC MOVES AND DEVELOPMENTS
- TABLE 34. HOMEDICS USA LLC: KEY EXECUTIVES
- TABLE 35. HOMEDICS USA LLC: COMPANY SNAPSHOT
- TABLE 36. HOMEDICS USA LLC: OPERATING SEGMENTS
- TABLE 37. HOMEDICS USA LLC: PRODUCT PORTFOLIO
- TABLE 38. HOMEDICS USA LLC: KEY STRATEGIC MOVES AND DEVELOPMENTS
- TABLE 39. SCHOLLS WELLNESS CO.: KEY EXECUTIVES
- TABLE 40. SCHOLLS WELLNESS CO.: COMPANY SNAPSHOT
- TABLE 41. SCHOLLS WELLNESS CO.: OPERATING SEGMENTS
- TABLE 42. SCHOLLS WELLNESS CO.: PRODUCT PORTFOLIO
- TABLE 43. SCHOLLS WELLNESS CO.: KEY STRATEGIC MOVES AND DEVELOPMENTS
- TABLE 44. GLAXOSMITHKLINE PLC.: KEY EXECUTIVES
- TABLE 45. GLAXOSMITHKLINE PLC.: COMPANY SNAPSHOT
- TABLE 46. GLAXOSMITHKLINE PLC.: OPERATING SEGMENTS
- TABLE 47. GLAXOSMITHKLINE PLC.: PRODUCT PORTFOLIO
- TABLE 48. GLAXOSMITHKLINE PLC.: KEY STRATEGIC MOVES AND DEVELOPMENTS
- TABLE 49. PEDIFIX INC: KEY EXECUTIVES
- TABLE 50. PEDIFIX INC: COMPANY SNAPSHOT
- TABLE 51. PEDIFIX INC: OPERATING SEGMENTS
- TABLE 52. PEDIFIX INC: PRODUCT PORTFOLIO
- TABLE 53. PEDIFIX INC: KEY STRATEGIC MOVES AND DEVELOPMENTS
- FIGURE 1. UK FOOT CARE PRODUCTS MARKET,2024 - 2034
- FIGURE 2. SEGMENTATION OF UK FOOT CARE PRODUCTS MARKET,2024 - 2034
- FIGURE 3. TOP INVESTMENT POCKET IN UK FOOT CARE PRODUCTS MARKET,2024 - 2034
- FIGURE 4. MODERATE BARGAINING POWER OF BUYERS
- FIGURE 5. MODERATE BARGAINING POWER OF SUPPLIERS
- FIGURE 6. MODERATE THREAT OF NEW ENTRANTS
- FIGURE 7. LOW THREAT OF SUBSTITUTION
- FIGURE 8. HIGH COMPETITIVE RIVALRY
- FIGURE 9. OPPORTUNITIES, RESTRAINTS AND DRIVERS: UK FOOT CARE PRODUCTS MARKET
- FIGURE 10. UK FOOT CARE PRODUCTS MARKET , BY PRODUCT,2024 - 2034 ($MILLION)
- FIGURE 11. UK FOOT CARE PRODUCTS MARKET , BY APPLICATION,2024 - 2034 ($MILLION)
- FIGURE 12. UK FOOT CARE PRODUCTS MARKET , BY DISTRIBUTION CHANNEL,2024 - 2034 ($MILLION)
- FIGURE 13. TOP WINNING STRATEGIES, BY YEAR, 2021-2023*
- FIGURE 14. TOP WINNING STRATEGIES, BY DEVELOPMENT, 2021-2023*
- FIGURE 15. TOP WINNING STRATEGIES, BY COMPANY, 2021-2023*
- FIGURE 16. PRODUCT MAPPING OF TOP 10 PLAYERS
- FIGURE 17. COMPETITIVE DASHBOARD
- FIGURE 18. COMPETITIVE HEATMAP: UK FOOT CARE PRODUCTS MARKET
- FIGURE 19. TOP PLAYER POSITIONING,2023
- FIGURE 20. BLISTEX INC.: NET SALES, 2021-2023 ($MILLION)
- FIGURE 21. BLISTEX INC.: REVENUE SHARE, BY SEGMENT, 2023 (%)
- FIGURE 22. BLISTEX INC.: REVENUE SHARE, BY REGION, 2023 (%)
- FIGURE 23. REVLON, INC.: NET SALES, 2021-2023 ($MILLION)
- FIGURE 24. REVLON, INC.: REVENUE SHARE, BY SEGMENT, 2023 (%)
- FIGURE 25. REVLON, INC.: REVENUE SHARE, BY REGION, 2023 (%)
- FIGURE 26. MIRACLE OF ALOE: NET SALES, 2021-2023 ($MILLION)
- FIGURE 27. MIRACLE OF ALOE: REVENUE SHARE, BY SEGMENT, 2023 (%)
- FIGURE 28. MIRACLE OF ALOE: REVENUE SHARE, BY REGION, 2023 (%)
- FIGURE 29. AETNA FOOT PRODUCTS: NET SALES, 2021-2023 ($MILLION)
- FIGURE 30. AETNA FOOT PRODUCTS: REVENUE SHARE, BY SEGMENT, 2023 (%)
- FIGURE 31. AETNA FOOT PRODUCTS: REVENUE SHARE, BY REGION, 2023 (%)
- FIGURE 32. ALVA-AMCO PHARMACAL COMPANIES, LLC: NET SALES, 2021-2023 ($MILLION)
- FIGURE 33. ALVA-AMCO PHARMACAL COMPANIES, LLC: REVENUE SHARE, BY SEGMENT, 2023 (%)
- FIGURE 34. ALVA-AMCO PHARMACAL COMPANIES, LLC: REVENUE SHARE, BY REGION, 2023 (%)
- FIGURE 35. COMBE, INCORPORATED: NET SALES, 2021-2023 ($MILLION)
- FIGURE 36. COMBE, INCORPORATED: REVENUE SHARE, BY SEGMENT, 2023 (%)
- FIGURE 37. COMBE, INCORPORATED: REVENUE SHARE, BY REGION, 2023 (%)
- FIGURE 38. HOMEDICS USA LLC: NET SALES, 2021-2023 ($MILLION)
- FIGURE 39. HOMEDICS USA LLC: REVENUE SHARE, BY SEGMENT, 2023 (%)
- FIGURE 40. HOMEDICS USA LLC: REVENUE SHARE, BY REGION, 2023 (%)
- FIGURE 41. SCHOLLS WELLNESS CO.: NET SALES, 2021-2023 ($MILLION)
- FIGURE 42. SCHOLLS WELLNESS CO.: REVENUE SHARE, BY SEGMENT, 2023 (%)
- FIGURE 43. SCHOLLS WELLNESS CO.: REVENUE SHARE, BY REGION, 2023 (%)
- FIGURE 44. GLAXOSMITHKLINE PLC.: NET SALES, 2021-2023 ($MILLION)
- FIGURE 45. GLAXOSMITHKLINE PLC.: REVENUE SHARE, BY SEGMENT, 2023 (%)
- FIGURE 46. GLAXOSMITHKLINE PLC.: REVENUE SHARE, BY REGION, 2023 (%)
- FIGURE 47. PEDIFIX INC: NET SALES, 2021-2023 ($MILLION)
- FIGURE 48. PEDIFIX INC: REVENUE SHARE, BY SEGMENT, 2023 (%)
- FIGURE 49. PEDIFIX INC: REVENUE SHARE, BY REGION, 2023 (%)

