
PUBLISHER: Allied Market Research | PRODUCT CODE: 1513402

PUBLISHER: Allied Market Research | PRODUCT CODE: 1513402
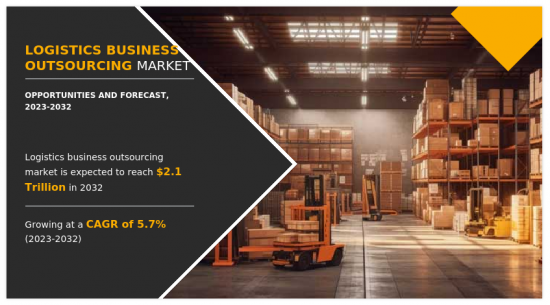
Logistics Business Outsourcing Market By Mode of Transport (Air Freight, Ocean Carriers, Railways, Roadways), By End-user (Pharmaceuticals, Automotive, Food and Beverages, Chemicals, Others): Global Opportunity Analysis and Industry Forecast, 2023-2032
The global logistics business outsourcing market was valued at $1.3 trillion in 2022, and is projected to reach $2.1 trillion by 2032, growing at a CAGR of 5.7% from 2023 to 2032.
Logistics management focuses on the efficiency and effective management of daily activities concerning the production of finished goods and services of the company. This type of management forms a part of the supply chain management; and plans, implements, & controls the efficient, effective forward, reverse flow, and storage of goods. Logistics mainly comprises various services such as Third-Party Logistics (3PL), Fourth-Party Logistics (4PL), inbound logistics, outbound logistics, reverse logistics, green logistics, construction logistics, digital logistics, military logistics, and other logistics services.
Outsourcing transportation management involves contracting with 3PL providers to handle freight forwarding, carrier selection, routing optimization, shipment tracking, and freight auditing. This allows businesses to streamline their transportation operations and leverage the expertise of logistics specialists. Outsourcing warehousing and distribution services involves utilizing third-party warehouse facilities and fulfilment centers to store inventory, manage inventory levels, pick and pack orders, and fulfil customer shipments. This helps businesses optimize their inventory management and reduce logistics costs.
Logistics outsourcing companies assist businesses in optimizing inventory levels, implementing just-in-time (JIT) practices, and managing stock replenishment. This ensures efficient inventory utilization while minimizing carrying costs and stockouts. Outsourcing order fulfillment and e-commerce logistics involves handling online orders, managing returns, and ensuring timely delivery to customers. This is particularly relevant in the context of growing e-commerce activities and the need for fast, reliable shipping services.
The factors, such as growth in e-commerce industry coupled with rise in reverse l logistics operations and rise in trade related agreements, fuel the logistics outsourcing market growth. In addition, the rise of tech-driven logistics services and growth in adoption of IoT-enabled connected devices are also expected to drive the market growth. However, lack of control of manufacturers on logistics service, poor infrastructure, and higher logistics costs hinder the market growth. Furthermore, the emergence of last mile deliveries, logistics automation, and cost cutting & lead time reduction due to adoption of multi-modal system are some of the factors that are anticipated to boost the market growth.
E-commerce refers to the buying and selling of goods by using internet. Third-party logistics service providers encompass shipping of products to consumers. In addition, the e-commerce industry utilizes logistics service to manage and oversee the supply chain of e-commerce companies, which allows these companies to focus on marketing and other business operations. Thus, there has been a rise in adoption of logistics services at a significant rate due to numerous benefits provided by logistics to the e-commerce industry, which has driven the growth of the logistics market. For instance, according to the latest report by the trade and development body (UNCTAD) of the UN released on April 2020, e-commerce sales hit $25.6 trillion globally in 2018, which was equivalent to 30% of the gross domestic product (GDP). The value of global B2B e-commerce in 2018 was $21 trillion, representing 83% of all e-commerce, whereas B2C e-commerce was valued at $4.4 trillion. The growth is attributed to fast growth in consumers and cross-border purchases. According to the report, more than 1.4 billion people shopped online in 2018 while the U.S., China, and Japan dominate e-commerce sales to consumers.
The logistics outsourcing market is segmented on the basis of mode of transport, end user, and region. On the basis of mode of transport, the market is divided into ocean carriers, railways, roadways, and air freight. On the basis of end user, it is divided into pharmaceuticals, automotive, chemicals, food & beverages, and others. Region-wise, it is studied across North America, Europe, Asia-Pacific, and LAMEA.
Key players covered in the report include United Parcel Service of America, Inc., XPO Logistics, Inc., DHL International GmbH, Kuehne + Nagel International AG, FedEx Corporation, Deutsche Bahn AG, Nippon Express Co., Ltd., DSV A/S, SNCF Group, A.P. Moller - Maersk
Additional benefits you will get with this purchase are:
- Quarterly Update and* (only available with a corporate license, on listed price)
- 5 additional Company Profile of client Choice pre- or post-purchase, as a free update.
- Free Upcoming Version on the Purchase of Five and Enterprise User License.
- 16 analyst hours of support* (post-purchase, if you find additional data requirements upon review of the report, you may receive support amounting to 16 analyst hours to solve questions, and post-sale queries)
- 15% Free Customization* (in case the scope or segment of the report does not match your requirements, 15% is equivalent to 3 working days of free work, applicable once)
- Free data Pack on the Five and Enterprise User License. (Excel version of the report)
- Free Updated report if the report is 6-12 months old or older.
- 24-hour priority response*
- Free Industry updates and white papers.
Possible Customization with this report (with additional cost and timeline, please talk to the sales executive to know more)
- Investment Opportunities
- Market share analysis of players by products/segments
- Regulatory Guidelines
- Additional company profiles with specific to client's interest
- Additional country or region analysis- market size and forecast
- Market share analysis of players at global/region/country level
- SWOT Analysis
Key Market Segments
By Mode of Transport
- Air Freight
- Ocean Carriers
- Railways
- Roadways
By End-user
- Pharmaceuticals
- Automotive
- Food and Beverages
- Chemicals
- Others
By Region
- North America
- U.S.
- Canada
- Mexico
- Europe
- Germany
- UK
- France
- Italy
- Rest of Europe
- Asia-Pacific
- China
- Japan
- India
- South Korea
- Rest of Asia-Pacific
- LAMEA
- Brazil
- Argentina
- Colombia
- Rest of Latin America
- Middle East and Africa
- UAE
- Saudi Arabia
- Egypt
- Rest of Middle East and Africa
Key Market Players:
- Inexia (SNCF group)
- UNITED PARCEL SERVICE OF AMERICA, INC.
- XPO Logistics, Inc.
- DHL International GmbH
- Kuehne + Nagel International AG
- FedEx Corporation
- Deutsche Bahn AG
- Nippon Express Co., Ltd.
- DSV A/S
- A.P. Moller - Maersk
TABLE OF CONTENTS
CHAPTER 1: INTRODUCTION
- 1.1. Report Description
- 1.2. Key market segments
- 1.3. Key benefits to the stakeholders
- 1.4. Research methodology
- 1.4.1. Primary research
- 1.4.2. Secondary research
- 1.4.3. Analyst tools and models
CHAPTER 2: EXECUTIVE SUMMARY
- 2.1. CXO perspective
CHAPTER 3: MARKET OVERVIEW
- 3.1. Market definition and scope
- 3.2. Key findings
- 3.2.1. Top impacting factors
- 3.2.2. Top investment pockets
- 3.3. Porter's Five Forces Analysis
- 3.4. Market dynamics
- 3.4.1. Drivers
- 3.4.2. Restraints
- 3.4.3. Opportunities
CHAPTER 4: LOGISTICS BUSINESS OUTSOURCING MARKET, BY MODE OF TRANSPORT
- 4.1. Overview
- 4.1.1. Market size and forecast
- 4.2. Air Freight
- 4.2.1. Key market trends, growth factors and opportunities
- 4.2.2. Market size and forecast, by region
- 4.2.3. Market share analysis by country
- 4.3. Ocean Carriers
- 4.3.1. Key market trends, growth factors and opportunities
- 4.3.2. Market size and forecast, by region
- 4.3.3. Market share analysis by country
- 4.4. Railways
- 4.4.1. Key market trends, growth factors and opportunities
- 4.4.2. Market size and forecast, by region
- 4.4.3. Market share analysis by country
- 4.5. Roadways
- 4.5.1. Key market trends, growth factors and opportunities
- 4.5.2. Market size and forecast, by region
- 4.5.3. Market share analysis by country
CHAPTER 5: LOGISTICS BUSINESS OUTSOURCING MARKET, BY END-USER
- 5.1. Overview
- 5.1.1. Market size and forecast
- 5.2. Pharmaceuticals
- 5.2.1. Key market trends, growth factors and opportunities
- 5.2.2. Market size and forecast, by region
- 5.2.3. Market share analysis by country
- 5.3. Automotive
- 5.3.1. Key market trends, growth factors and opportunities
- 5.3.2. Market size and forecast, by region
- 5.3.3. Market share analysis by country
- 5.4. Food and Beverages
- 5.4.1. Key market trends, growth factors and opportunities
- 5.4.2. Market size and forecast, by region
- 5.4.3. Market share analysis by country
- 5.5. Chemicals
- 5.5.1. Key market trends, growth factors and opportunities
- 5.5.2. Market size and forecast, by region
- 5.5.3. Market share analysis by country
- 5.6. Others
- 5.6.1. Key market trends, growth factors and opportunities
- 5.6.2. Market size and forecast, by region
- 5.6.3. Market share analysis by country
CHAPTER 6: LOGISTICS BUSINESS OUTSOURCING MARKET, BY REGION
- 6.1. Overview
- 6.1.1. Market size and forecast By Region
- 6.2. North America
- 6.2.1. Key market trends, growth factors and opportunities
- 6.2.2. Market size and forecast, by Mode of Transport
- 6.2.3. Market size and forecast, by End-user
- 6.2.4. Market size and forecast, by country
- 6.2.4.1. U.S.
- 6.2.4.1.1. Market size and forecast, by Mode of Transport
- 6.2.4.1.2. Market size and forecast, by End-user
- 6.2.4.2. Canada
- 6.2.4.2.1. Market size and forecast, by Mode of Transport
- 6.2.4.2.2. Market size and forecast, by End-user
- 6.2.4.3. Mexico
- 6.2.4.3.1. Market size and forecast, by Mode of Transport
- 6.2.4.3.2. Market size and forecast, by End-user
- 6.3. Europe
- 6.3.1. Key market trends, growth factors and opportunities
- 6.3.2. Market size and forecast, by Mode of Transport
- 6.3.3. Market size and forecast, by End-user
- 6.3.4. Market size and forecast, by country
- 6.3.4.1. Germany
- 6.3.4.1.1. Market size and forecast, by Mode of Transport
- 6.3.4.1.2. Market size and forecast, by End-user
- 6.3.4.2. UK
- 6.3.4.2.1. Market size and forecast, by Mode of Transport
- 6.3.4.2.2. Market size and forecast, by End-user
- 6.3.4.3. France
- 6.3.4.3.1. Market size and forecast, by Mode of Transport
- 6.3.4.3.2. Market size and forecast, by End-user
- 6.3.4.4. Italy
- 6.3.4.4.1. Market size and forecast, by Mode of Transport
- 6.3.4.4.2. Market size and forecast, by End-user
- 6.3.4.5. Rest of Europe
- 6.3.4.5.1. Market size and forecast, by Mode of Transport
- 6.3.4.5.2. Market size and forecast, by End-user
- 6.4. Asia-Pacific
- 6.4.1. Key market trends, growth factors and opportunities
- 6.4.2. Market size and forecast, by Mode of Transport
- 6.4.3. Market size and forecast, by End-user
- 6.4.4. Market size and forecast, by country
- 6.4.4.1. China
- 6.4.4.1.1. Market size and forecast, by Mode of Transport
- 6.4.4.1.2. Market size and forecast, by End-user
- 6.4.4.2. Japan
- 6.4.4.2.1. Market size and forecast, by Mode of Transport
- 6.4.4.2.2. Market size and forecast, by End-user
- 6.4.4.3. India
- 6.4.4.3.1. Market size and forecast, by Mode of Transport
- 6.4.4.3.2. Market size and forecast, by End-user
- 6.4.4.4. South Korea
- 6.4.4.4.1. Market size and forecast, by Mode of Transport
- 6.4.4.4.2. Market size and forecast, by End-user
- 6.4.4.5. Rest of Asia-Pacific
- 6.4.4.5.1. Market size and forecast, by Mode of Transport
- 6.4.4.5.2. Market size and forecast, by End-user
- 6.5. LAMEA
- 6.5.1. Key market trends, growth factors and opportunities
- 6.5.2. Market size and forecast, by Mode of Transport
- 6.5.3. Market size and forecast, by End-user
- 6.5.4. Market size and forecast, by country
- 6.5.4.1. Brazil
- 6.5.4.1.1. Market size and forecast, by Mode of Transport
- 6.5.4.1.2. Market size and forecast, by End-user
- 6.5.4.2. Argentina
- 6.5.4.2.1. Market size and forecast, by Mode of Transport
- 6.5.4.2.2. Market size and forecast, by End-user
- 6.5.4.3. Colombia
- 6.5.4.3.1. Market size and forecast, by Mode of Transport
- 6.5.4.3.2. Market size and forecast, by End-user
- 6.5.4.4. Rest of Latin America
- 6.5.4.4.1. Market size and forecast, by Mode of Transport
- 6.5.4.4.2. Market size and forecast, by End-user
- 6.6. Middle East and Africa
- 6.6.1. Key market trends, growth factors and opportunities
- 6.6.2. Market size and forecast, by Mode of Transport
- 6.6.3. Market size and forecast, by End-user
- 6.6.4. Market size and forecast, by country
- 6.6.4.1. UAE
- 6.6.4.1.1. Market size and forecast, by Mode of Transport
- 6.6.4.1.2. Market size and forecast, by End-user
- 6.6.4.2. Saudi Arabia
- 6.6.4.2.1. Market size and forecast, by Mode of Transport
- 6.6.4.2.2. Market size and forecast, by End-user
- 6.6.4.3. Egypt
- 6.6.4.3.1. Market size and forecast, by Mode of Transport
- 6.6.4.3.2. Market size and forecast, by End-user
- 6.6.4.4. Rest of Middle East And Africa
- 6.6.4.4.1. Market size and forecast, by Mode of Transport
- 6.6.4.4.2. Market size and forecast, by End-user
CHAPTER 7: COMPETITIVE LANDSCAPE
- 7.1. Introduction
- 7.2. Top winning strategies
- 7.3. Product mapping of top 10 player
- 7.4. Competitive dashboard
- 7.5. Competitive heatmap
- 7.6. Top player positioning, 2022
CHAPTER 8: COMPANY PROFILES
- 8.1. UNITED PARCEL SERVICE OF AMERICA, INC.
- 8.1.1. Company overview
- 8.1.2. Key executives
- 8.1.3. Company snapshot
- 8.1.4. Operating business segments
- 8.1.5. Product portfolio
- 8.1.6. Business performance
- 8.1.7. Key strategic moves and developments
- 8.2. XPO Logistics, Inc.
- 8.2.1. Company overview
- 8.2.2. Key executives
- 8.2.3. Company snapshot
- 8.2.4. Operating business segments
- 8.2.5. Product portfolio
- 8.2.6. Business performance
- 8.2.7. Key strategic moves and developments
- 8.3. DHL International GmbH
- 8.3.1. Company overview
- 8.3.2. Key executives
- 8.3.3. Company snapshot
- 8.3.4. Operating business segments
- 8.3.5. Product portfolio
- 8.3.6. Business performance
- 8.3.7. Key strategic moves and developments
- 8.4. Kuehne + Nagel International AG
- 8.4.1. Company overview
- 8.4.2. Key executives
- 8.4.3. Company snapshot
- 8.4.4. Operating business segments
- 8.4.5. Product portfolio
- 8.4.6. Business performance
- 8.4.7. Key strategic moves and developments
- 8.5. FedEx Corporation
- 8.5.1. Company overview
- 8.5.2. Key executives
- 8.5.3. Company snapshot
- 8.5.4. Operating business segments
- 8.5.5. Product portfolio
- 8.5.6. Business performance
- 8.5.7. Key strategic moves and developments
- 8.6. Deutsche Bahn AG
- 8.6.1. Company overview
- 8.6.2. Key executives
- 8.6.3. Company snapshot
- 8.6.4. Operating business segments
- 8.6.5. Product portfolio
- 8.6.6. Business performance
- 8.6.7. Key strategic moves and developments
- 8.7. Nippon Express Co., Ltd.
- 8.7.1. Company overview
- 8.7.2. Key executives
- 8.7.3. Company snapshot
- 8.7.4. Operating business segments
- 8.7.5. Product portfolio
- 8.7.6. Business performance
- 8.7.7. Key strategic moves and developments
- 8.8. DSV A/S
- 8.8.1. Company overview
- 8.8.2. Key executives
- 8.8.3. Company snapshot
- 8.8.4. Operating business segments
- 8.8.5. Product portfolio
- 8.8.6. Business performance
- 8.8.7. Key strategic moves and developments
- 8.9. Inexia (SNCF group)
- 8.9.1. Company overview
- 8.9.2. Key executives
- 8.9.3. Company snapshot
- 8.9.4. Operating business segments
- 8.9.5. Product portfolio
- 8.9.6. Business performance
- 8.9.7. Key strategic moves and developments
- 8.10. A.P. Moller - Maersk
- 8.10.1. Company overview
- 8.10.2. Key executives
- 8.10.3. Company snapshot
- 8.10.4. Operating business segments
- 8.10.5. Product portfolio
- 8.10.6. Business performance
- 8.10.7. Key strategic moves and developments
LIST OF TABLES
- TABLE 01. GLOBAL LOGISTICS BUSINESS OUTSOURCING MARKET, BY MODE OF TRANSPORT, 2022-2032 ($BILLION)
- TABLE 02. LOGISTICS BUSINESS OUTSOURCING MARKET FOR AIR FREIGHT, BY REGION, 2022-2032 ($BILLION)
- TABLE 03. LOGISTICS BUSINESS OUTSOURCING MARKET FOR OCEAN CARRIERS, BY REGION, 2022-2032 ($BILLION)
- TABLE 04. LOGISTICS BUSINESS OUTSOURCING MARKET FOR RAILWAYS, BY REGION, 2022-2032 ($BILLION)
- TABLE 05. LOGISTICS BUSINESS OUTSOURCING MARKET FOR ROADWAYS, BY REGION, 2022-2032 ($BILLION)
- TABLE 06. GLOBAL LOGISTICS BUSINESS OUTSOURCING MARKET, BY END-USER, 2022-2032 ($BILLION)
- TABLE 07. LOGISTICS BUSINESS OUTSOURCING MARKET FOR PHARMACEUTICALS, BY REGION, 2022-2032 ($BILLION)
- TABLE 08. LOGISTICS BUSINESS OUTSOURCING MARKET FOR AUTOMOTIVE, BY REGION, 2022-2032 ($BILLION)
- TABLE 09. LOGISTICS BUSINESS OUTSOURCING MARKET FOR FOOD AND BEVERAGES, BY REGION, 2022-2032 ($BILLION)
- TABLE 10. LOGISTICS BUSINESS OUTSOURCING MARKET FOR CHEMICALS, BY REGION, 2022-2032 ($BILLION)
- TABLE 11. LOGISTICS BUSINESS OUTSOURCING MARKET FOR OTHERS, BY REGION, 2022-2032 ($BILLION)
- TABLE 12. LOGISTICS BUSINESS OUTSOURCING MARKET, BY REGION, 2022-2032 ($BILLION)
- TABLE 13. NORTH AMERICA LOGISTICS BUSINESS OUTSOURCING MARKET, BY MODE OF TRANSPORT, 2022-2032 ($BILLION)
- TABLE 14. NORTH AMERICA LOGISTICS BUSINESS OUTSOURCING MARKET, BY END-USER, 2022-2032 ($BILLION)
- TABLE 15. NORTH AMERICA LOGISTICS BUSINESS OUTSOURCING MARKET, BY COUNTRY, 2022-2032 ($BILLION)
- TABLE 16. U.S. LOGISTICS BUSINESS OUTSOURCING MARKET, BY MODE OF TRANSPORT, 2022-2032 ($BILLION)
- TABLE 17. U.S. LOGISTICS BUSINESS OUTSOURCING MARKET, BY END-USER, 2022-2032 ($BILLION)
- TABLE 18. CANADA LOGISTICS BUSINESS OUTSOURCING MARKET, BY MODE OF TRANSPORT, 2022-2032 ($BILLION)
- TABLE 19. CANADA LOGISTICS BUSINESS OUTSOURCING MARKET, BY END-USER, 2022-2032 ($BILLION)
- TABLE 20. MEXICO LOGISTICS BUSINESS OUTSOURCING MARKET, BY MODE OF TRANSPORT, 2022-2032 ($BILLION)
- TABLE 21. MEXICO LOGISTICS BUSINESS OUTSOURCING MARKET, BY END-USER, 2022-2032 ($BILLION)
- TABLE 22. EUROPE LOGISTICS BUSINESS OUTSOURCING MARKET, BY MODE OF TRANSPORT, 2022-2032 ($BILLION)
- TABLE 23. EUROPE LOGISTICS BUSINESS OUTSOURCING MARKET, BY END-USER, 2022-2032 ($BILLION)
- TABLE 24. EUROPE LOGISTICS BUSINESS OUTSOURCING MARKET, BY COUNTRY, 2022-2032 ($BILLION)
- TABLE 25. GERMANY LOGISTICS BUSINESS OUTSOURCING MARKET, BY MODE OF TRANSPORT, 2022-2032 ($BILLION)
- TABLE 26. GERMANY LOGISTICS BUSINESS OUTSOURCING MARKET, BY END-USER, 2022-2032 ($BILLION)
- TABLE 27. UK LOGISTICS BUSINESS OUTSOURCING MARKET, BY MODE OF TRANSPORT, 2022-2032 ($BILLION)
- TABLE 28. UK LOGISTICS BUSINESS OUTSOURCING MARKET, BY END-USER, 2022-2032 ($BILLION)
- TABLE 29. FRANCE LOGISTICS BUSINESS OUTSOURCING MARKET, BY MODE OF TRANSPORT, 2022-2032 ($BILLION)
- TABLE 30. FRANCE LOGISTICS BUSINESS OUTSOURCING MARKET, BY END-USER, 2022-2032 ($BILLION)
- TABLE 31. ITALY LOGISTICS BUSINESS OUTSOURCING MARKET, BY MODE OF TRANSPORT, 2022-2032 ($BILLION)
- TABLE 32. ITALY LOGISTICS BUSINESS OUTSOURCING MARKET, BY END-USER, 2022-2032 ($BILLION)
- TABLE 33. REST OF EUROPE LOGISTICS BUSINESS OUTSOURCING MARKET, BY MODE OF TRANSPORT, 2022-2032 ($BILLION)
- TABLE 34. REST OF EUROPE LOGISTICS BUSINESS OUTSOURCING MARKET, BY END-USER, 2022-2032 ($BILLION)
- TABLE 35. ASIA-PACIFIC LOGISTICS BUSINESS OUTSOURCING MARKET, BY MODE OF TRANSPORT, 2022-2032 ($BILLION)
- TABLE 36. ASIA-PACIFIC LOGISTICS BUSINESS OUTSOURCING MARKET, BY END-USER, 2022-2032 ($BILLION)
- TABLE 37. ASIA-PACIFIC LOGISTICS BUSINESS OUTSOURCING MARKET, BY COUNTRY, 2022-2032 ($BILLION)
- TABLE 38. CHINA LOGISTICS BUSINESS OUTSOURCING MARKET, BY MODE OF TRANSPORT, 2022-2032 ($BILLION)
- TABLE 39. CHINA LOGISTICS BUSINESS OUTSOURCING MARKET, BY END-USER, 2022-2032 ($BILLION)
- TABLE 40. JAPAN LOGISTICS BUSINESS OUTSOURCING MARKET, BY MODE OF TRANSPORT, 2022-2032 ($BILLION)
- TABLE 41. JAPAN LOGISTICS BUSINESS OUTSOURCING MARKET, BY END-USER, 2022-2032 ($BILLION)
- TABLE 42. INDIA LOGISTICS BUSINESS OUTSOURCING MARKET, BY MODE OF TRANSPORT, 2022-2032 ($BILLION)
- TABLE 43. INDIA LOGISTICS BUSINESS OUTSOURCING MARKET, BY END-USER, 2022-2032 ($BILLION)
- TABLE 44. SOUTH KOREA LOGISTICS BUSINESS OUTSOURCING MARKET, BY MODE OF TRANSPORT, 2022-2032 ($BILLION)
- TABLE 45. SOUTH KOREA LOGISTICS BUSINESS OUTSOURCING MARKET, BY END-USER, 2022-2032 ($BILLION)
- TABLE 46. REST OF ASIA-PACIFIC LOGISTICS BUSINESS OUTSOURCING MARKET, BY MODE OF TRANSPORT, 2022-2032 ($BILLION)
- TABLE 47. REST OF ASIA-PACIFIC LOGISTICS BUSINESS OUTSOURCING MARKET, BY END-USER, 2022-2032 ($BILLION)
- TABLE 48. LAMEA LOGISTICS BUSINESS OUTSOURCING MARKET, BY MODE OF TRANSPORT, 2022-2032 ($BILLION)
- TABLE 49. LAMEA LOGISTICS BUSINESS OUTSOURCING MARKET, BY END-USER, 2022-2032 ($BILLION)
- TABLE 50. LAMEA LOGISTICS BUSINESS OUTSOURCING MARKET, BY COUNTRY, 2022-2032 ($BILLION)
- TABLE 51. BRAZIL LOGISTICS BUSINESS OUTSOURCING MARKET, BY MODE OF TRANSPORT, 2022-2032 ($BILLION)
- TABLE 52. BRAZIL LOGISTICS BUSINESS OUTSOURCING MARKET, BY END-USER, 2022-2032 ($BILLION)
- TABLE 53. ARGENTINA LOGISTICS BUSINESS OUTSOURCING MARKET, BY MODE OF TRANSPORT, 2022-2032 ($BILLION)
- TABLE 54. ARGENTINA LOGISTICS BUSINESS OUTSOURCING MARKET, BY END-USER, 2022-2032 ($BILLION)
- TABLE 55. COLOMBIA LOGISTICS BUSINESS OUTSOURCING MARKET, BY MODE OF TRANSPORT, 2022-2032 ($BILLION)
- TABLE 56. COLOMBIA LOGISTICS BUSINESS OUTSOURCING MARKET, BY END-USER, 2022-2032 ($BILLION)
- TABLE 57. REST OF LATIN AMERICA LOGISTICS BUSINESS OUTSOURCING MARKET, BY MODE OF TRANSPORT, 2022-2032 ($BILLION)
- TABLE 58. REST OF LATIN AMERICA LOGISTICS BUSINESS OUTSOURCING MARKET, BY END-USER, 2022-2032 ($BILLION)
- TABLE 59. MIDDLE EAST AND AFRICA LOGISTICS BUSINESS OUTSOURCING MARKET, BY MODE OF TRANSPORT, 2022-2032 ($BILLION)
- TABLE 60. MIDDLE EAST AND AFRICA LOGISTICS BUSINESS OUTSOURCING MARKET, BY END-USER, 2022-2032 ($BILLION)
- TABLE 61. MIDDLE EAST AND AFRICA LOGISTICS BUSINESS OUTSOURCING MARKET, BY COUNTRY, 2022-2032 ($BILLION)
- TABLE 62. UAE LOGISTICS BUSINESS OUTSOURCING MARKET, BY MODE OF TRANSPORT, 2022-2032 ($BILLION)
- TABLE 63. UAE LOGISTICS BUSINESS OUTSOURCING MARKET, BY END-USER, 2022-2032 ($BILLION)
- TABLE 64. SAUDI ARABIA LOGISTICS BUSINESS OUTSOURCING MARKET, BY MODE OF TRANSPORT, 2022-2032 ($BILLION)
- TABLE 65. SAUDI ARABIA LOGISTICS BUSINESS OUTSOURCING MARKET, BY END-USER, 2022-2032 ($BILLION)
- TABLE 66. EGYPT LOGISTICS BUSINESS OUTSOURCING MARKET, BY MODE OF TRANSPORT, 2022-2032 ($BILLION)
- TABLE 67. EGYPT LOGISTICS BUSINESS OUTSOURCING MARKET, BY END-USER, 2022-2032 ($BILLION)
- TABLE 68. REST OF MIDDLE EAST AND AFRICA LOGISTICS BUSINESS OUTSOURCING MARKET, BY MODE OF TRANSPORT, 2022-2032 ($BILLION)
- TABLE 69. REST OF MIDDLE EAST AND AFRICA LOGISTICS BUSINESS OUTSOURCING MARKET, BY END-USER, 2022-2032 ($BILLION)
- TABLE 70. UNITED PARCEL SERVICE OF AMERICA, INC.: KEY EXECUTIVES
- TABLE 71. UNITED PARCEL SERVICE OF AMERICA, INC.: COMPANY SNAPSHOT
- TABLE 72. UNITED PARCEL SERVICE OF AMERICA, INC.: PRODUCT SEGMENTS
- TABLE 73. UNITED PARCEL SERVICE OF AMERICA, INC.: SERVICE SEGMENTS
- TABLE 74. UNITED PARCEL SERVICE OF AMERICA, INC.: PRODUCT PORTFOLIO
- TABLE 75. UNITED PARCEL SERVICE OF AMERICA, INC.: KEY STRATEGIES
- TABLE 76. XPO, INC.: KEY EXECUTIVES
- TABLE 77. XPO, INC.: COMPANY SNAPSHOT
- TABLE 78. XPO, INC.: PRODUCT SEGMENTS
- TABLE 79. XPO, INC.: SERVICE SEGMENTS
- TABLE 80. XPO, INC.: PRODUCT PORTFOLIO
- TABLE 81. XPO, INC.: KEY STRATEGIES
- TABLE 82. DHL INTERNATIONAL GMBH: KEY EXECUTIVES
- TABLE 83. DHL INTERNATIONAL GMBH: COMPANY SNAPSHOT
- TABLE 84. DHL INTERNATIONAL GMBH: PRODUCT SEGMENTS
- TABLE 85. DHL INTERNATIONAL GMBH: SERVICE SEGMENTS
- TABLE 86. DHL INTERNATIONAL GMBH: PRODUCT PORTFOLIO
- TABLE 87. DHL INTERNATIONAL GMBH: KEY STRATEGIES
- TABLE 88. KUEHNE + NAGEL: KEY EXECUTIVES
- TABLE 89. KUEHNE + NAGEL: COMPANY SNAPSHOT
- TABLE 90. KUEHNE + NAGEL: PRODUCT SEGMENTS
- TABLE 91. KUEHNE + NAGEL: SERVICE SEGMENTS
- TABLE 92. KUEHNE + NAGEL: PRODUCT PORTFOLIO
- TABLE 93. KUEHNE + NAGEL: KEY STRATEGIES
- TABLE 94. FEDEX CORPORATION: KEY EXECUTIVES
- TABLE 95. FEDEX CORPORATION: COMPANY SNAPSHOT
- TABLE 96. FEDEX CORPORATION: PRODUCT SEGMENTS
- TABLE 97. FEDEX CORPORATION: SERVICE SEGMENTS
- TABLE 98. FEDEX CORPORATION: PRODUCT PORTFOLIO
- TABLE 99. FEDEX CORPORATION: KEY STRATEGIES
- TABLE 100. DEUTSCHE BAHN AG: KEY EXECUTIVES
- TABLE 101. DEUTSCHE BAHN AG: COMPANY SNAPSHOT
- TABLE 102. DEUTSCHE BAHN AG: PRODUCT SEGMENTS
- TABLE 103. DEUTSCHE BAHN AG: SERVICE SEGMENTS
- TABLE 104. DEUTSCHE BAHN AG: PRODUCT PORTFOLIO
- TABLE 105. DEUTSCHE BAHN AG: KEY STRATEGIES
- TABLE 106. NIPPON EXPRESS CO., LTD.: KEY EXECUTIVES
- TABLE 107. NIPPON EXPRESS CO., LTD.: COMPANY SNAPSHOT
- TABLE 108. NIPPON EXPRESS CO., LTD.: PRODUCT SEGMENTS
- TABLE 109. NIPPON EXPRESS CO., LTD.: SERVICE SEGMENTS
- TABLE 110. NIPPON EXPRESS CO., LTD.: PRODUCT PORTFOLIO
- TABLE 111. NIPPON EXPRESS CO., LTD.: KEY STRATEGIES
- TABLE 112. DSV: KEY EXECUTIVES
- TABLE 113. DSV: COMPANY SNAPSHOT
- TABLE 114. DSV: PRODUCT SEGMENTS
- TABLE 115. DSV: SERVICE SEGMENTS
- TABLE 116. DSV: PRODUCT PORTFOLIO
- TABLE 117. DSV: KEY STRATEGIES
- TABLE 118. INEXIA (SNCF GROUP): KEY EXECUTIVES
- TABLE 119. INEXIA (SNCF GROUP): COMPANY SNAPSHOT
- TABLE 120. INEXIA (SNCF GROUP): PRODUCT SEGMENTS
- TABLE 121. INEXIA (SNCF GROUP): SERVICE SEGMENTS
- TABLE 122. INEXIA (SNCF GROUP): PRODUCT PORTFOLIO
- TABLE 123. INEXIA (SNCF GROUP): KEY STRATEGIES
- TABLE 124. A.P. MOLLER-MAERSK: KEY EXECUTIVES
- TABLE 125. A.P. MOLLER-MAERSK: COMPANY SNAPSHOT
- TABLE 126. A.P. MOLLER - MAERSK: PRODUCT SEGMENTS
- TABLE 127. A.P. MOLLER - MAERSK: SERVICE SEGMENTS
- TABLE 128. A.P. MOLLER - MAERSK: PRODUCT PORTFOLIO
- TABLE 129. A.P. MOLLER - MAERSK: KEY STRATEGIES
LIST OF FIGURES
- FIGURE 01. LOGISTICS BUSINESS OUTSOURCING MARKET, 2022-2032
- FIGURE 02. SEGMENTATION OF LOGISTICS BUSINESS OUTSOURCING MARKET,2022-2032
- FIGURE 03. TOP IMPACTING FACTORS IN LOGISTICS BUSINESS OUTSOURCING MARKET
- FIGURE 04. TOP INVESTMENT POCKETS IN LOGISTICS BUSINESS OUTSOURCING MARKET (2023-2032)
- FIGURE 05. BARGAINING POWER OF SUPPLIERS
- FIGURE 06. BARGAINING POWER OF BUYERS
- FIGURE 07. THREAT OF SUBSTITUTION
- FIGURE 08. THREAT OF SUBSTITUTION
- FIGURE 09. COMPETITIVE RIVALRY
- FIGURE 10. GLOBAL LOGISTICS BUSINESS OUTSOURCING MARKET: DRIVERS, RESTRAINTS AND OPPORTUNITIES
- FIGURE 11. LOGISTICS BUSINESS OUTSOURCING MARKET, BY MODE OF TRANSPORT, 2022 AND 2032(%)
- FIGURE 12. COMPARATIVE SHARE ANALYSIS OF LOGISTICS BUSINESS OUTSOURCING MARKET FOR AIR FREIGHT, BY COUNTRY 2022 AND 2032(%)
- FIGURE 13. COMPARATIVE SHARE ANALYSIS OF LOGISTICS BUSINESS OUTSOURCING MARKET FOR OCEAN CARRIERS, BY COUNTRY 2022 AND 2032(%)
- FIGURE 14. COMPARATIVE SHARE ANALYSIS OF LOGISTICS BUSINESS OUTSOURCING MARKET FOR RAILWAYS, BY COUNTRY 2022 AND 2032(%)
- FIGURE 15. COMPARATIVE SHARE ANALYSIS OF LOGISTICS BUSINESS OUTSOURCING MARKET FOR ROADWAYS, BY COUNTRY 2022 AND 2032(%)
- FIGURE 16. LOGISTICS BUSINESS OUTSOURCING MARKET, BY END-USER, 2022 AND 2032(%)
- FIGURE 17. COMPARATIVE SHARE ANALYSIS OF LOGISTICS BUSINESS OUTSOURCING MARKET FOR PHARMACEUTICALS, BY COUNTRY 2022 AND 2032(%)
- FIGURE 18. COMPARATIVE SHARE ANALYSIS OF LOGISTICS BUSINESS OUTSOURCING MARKET FOR AUTOMOTIVE, BY COUNTRY 2022 AND 2032(%)
- FIGURE 19. COMPARATIVE SHARE ANALYSIS OF LOGISTICS BUSINESS OUTSOURCING MARKET FOR FOOD AND BEVERAGES, BY COUNTRY 2022 AND 2032(%)
- FIGURE 20. COMPARATIVE SHARE ANALYSIS OF LOGISTICS BUSINESS OUTSOURCING MARKET FOR CHEMICALS, BY COUNTRY 2022 AND 2032(%)
- FIGURE 21. COMPARATIVE SHARE ANALYSIS OF LOGISTICS BUSINESS OUTSOURCING MARKET FOR OTHERS, BY COUNTRY 2022 AND 2032(%)
- FIGURE 22. LOGISTICS BUSINESS OUTSOURCING MARKET BY REGION, 2022 AND 2032(%)
- FIGURE 23. U.S. LOGISTICS BUSINESS OUTSOURCING MARKET, 2022-2032 ($BILLION)
- FIGURE 24. CANADA LOGISTICS BUSINESS OUTSOURCING MARKET, 2022-2032 ($BILLION)
- FIGURE 25. MEXICO LOGISTICS BUSINESS OUTSOURCING MARKET, 2022-2032 ($BILLION)
- FIGURE 26. GERMANY LOGISTICS BUSINESS OUTSOURCING MARKET, 2022-2032 ($BILLION)
- FIGURE 27. UK LOGISTICS BUSINESS OUTSOURCING MARKET, 2022-2032 ($BILLION)
- FIGURE 28. FRANCE LOGISTICS BUSINESS OUTSOURCING MARKET, 2022-2032 ($BILLION)
- FIGURE 29. ITALY LOGISTICS BUSINESS OUTSOURCING MARKET, 2022-2032 ($BILLION)
- FIGURE 30. REST OF EUROPE LOGISTICS BUSINESS OUTSOURCING MARKET, 2022-2032 ($BILLION)
- FIGURE 31. CHINA LOGISTICS BUSINESS OUTSOURCING MARKET, 2022-2032 ($BILLION)
- FIGURE 32. JAPAN LOGISTICS BUSINESS OUTSOURCING MARKET, 2022-2032 ($BILLION)
- FIGURE 33. INDIA LOGISTICS BUSINESS OUTSOURCING MARKET, 2022-2032 ($BILLION)
- FIGURE 34. SOUTH KOREA LOGISTICS BUSINESS OUTSOURCING MARKET, 2022-2032 ($BILLION)
- FIGURE 35. REST OF ASIA-PACIFIC LOGISTICS BUSINESS OUTSOURCING MARKET, 2022-2032 ($BILLION)
- FIGURE 36. BRAZIL LOGISTICS BUSINESS OUTSOURCING MARKET, 2022-2032 ($BILLION)
- FIGURE 37. ARGENTINA LOGISTICS BUSINESS OUTSOURCING MARKET, 2022-2032 ($BILLION)
- FIGURE 38. COLOMBIA LOGISTICS BUSINESS OUTSOURCING MARKET, 2022-2032 ($BILLION)
- FIGURE 39. REST OF LATIN AMERICA LOGISTICS BUSINESS OUTSOURCING MARKET, 2022-2032 ($BILLION)
- FIGURE 40. UAE LOGISTICS BUSINESS OUTSOURCING MARKET, 2022-2032 ($BILLION)
- FIGURE 41. SAUDI ARABIA LOGISTICS BUSINESS OUTSOURCING MARKET, 2022-2032 ($BILLION)
- FIGURE 42. EGYPT LOGISTICS BUSINESS OUTSOURCING MARKET, 2022-2032 ($BILLION)
- FIGURE 43. REST OF MIDDLE EAST AND AFRICA LOGISTICS BUSINESS OUTSOURCING MARKET, 2022-2032 ($BILLION)
- FIGURE 44. TOP WINNING STRATEGIES, BY YEAR
- FIGURE 45. TOP WINNING STRATEGIES, BY DEVELOPMENT
- FIGURE 46. TOP WINNING STRATEGIES, BY COMPANY
- FIGURE 47. PRODUCT MAPPING OF TOP 10 PLAYERS
- FIGURE 48. COMPETITIVE DASHBOARD
- FIGURE 49. COMPETITIVE HEATMAP: LOGISTICS BUSINESS OUTSOURCING MARKET
- FIGURE 50. TOP PLAYER POSITIONING, 2022

