
PUBLISHER: Allied Market Research | PRODUCT CODE: 1472245

PUBLISHER: Allied Market Research | PRODUCT CODE: 1472245
Barley Flour Market By Product Type (Organic, Conventional), By Application (Household, Commercial, Other), By Distribution Channel (B2B, B2C): Global Opportunity Analysis and Industry Forecast, 2023-2032
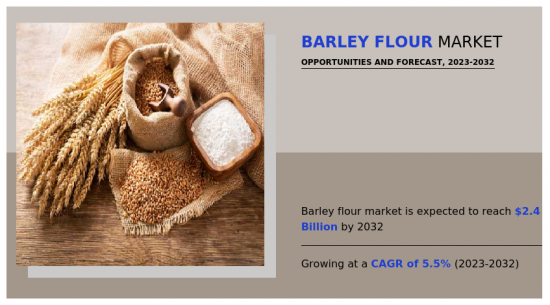
The global barley flour market was valued at $1,384.2 million in 2022, and is projected to reach $2,352.9 million by 2032, registering a CAGR of 5.5% from 2023 to 2032.
Barley flour is a type of flour made by grinding whole barley grains. It possesses a slightly sweet, nutty flavor and a light brown color. Barley flour contains gluten, a protein composite, making it unsuitable for those with celiac disease or gluten sensitivities. However, it is rich in fiber, vitamins, and minerals such as manganese, selenium, and phosphorus, contributing to a balanced diet and promoting digestive health. Barley flour is commonly used in various culinary applications, including baking bread, pancakes, muffins, and cookies, imparting a hearty texture and wholesome taste to baked goods. Its moderate gluten content makes it less suitable for producing bread with a light, airy texture, although it can be combined with wheat flour for a blend that retains both nutritional benefits and baking performance. In addition, barley flour is often utilized in gluten-free recipes as an alternative for those with specific dietary restrictions.
The diverse culinary applications play an important role in surging the demand for barley flour by expanding its usage beyond traditional baking. Barley flour's versatility makes it an ideal ingredient for a wide range of culinary creations, including bread, pancakes, muffins, cookies, and pasta. Its unique flavor profile, characterized by a fine sweetness and nuttiness, enhances the taste and texture of various dishes, appealing to selective taste seeking novel culinary experiences. As chefs, home cooks, and food manufacturers experiment with barley flour in diverse recipes, its popularity grows, driving demand across the food industry.
Furthermore, the rise in popularity of global cuisines and culinary fusion trends provides ample opportunities for barley flour to shine in innovative dishes from around the world. From savory soups and stews to hearty grain bowls and artisanal pastries, barley flour adds depth and complexity to culinary creations, attracting consumers seeking authentic flavors and unique dining experiences. In addition, the rising interest in plant-based and vegetarian diets encourages the use of barley flour as a versatile and nutritious alternative to animal-derived ingredients, further fueling its market demand. As barley flour finds its way into an ever-expanding array of culinary applications, its market potential continues to surge, driven by consumers' desire for diverse, flavorful, and wholesome food choices.
However, the gluten content in barley flour creates a significant restraint on its market demand, particularly in an environment where gluten-free diets are popular. Barley flour contains gluten, a protein composite that can trigger adverse reactions in individuals with celiac disease or gluten sensitivities. As awareness of gluten-related disorders grows, many consumers actively seek out gluten-free alternatives to traditional wheat-based flours, leading to decline in demand for barley flour among this demographic. Despite its nutritional benefits and culinary versatility, the presence of gluten in barley flour limits its appeal to a subset of the population, thus constraining its market potential in gluten-sensitive markets.
Moreover, the widespread presence of gluten-free dietary preferences extends beyond individuals with diagnosed gluten-related disorders, as many consumers perceive gluten-free diets as healthier or more helpful for weight management. This broader cultural shift towards gluten-free eating habits further decreases the market demand for barley flour, as consumers opt for alternative flours perceived as safer or more compatible with their dietary preferences. Thus, the gluten content in barley flour limits its widespread adoption, restricting its market growth and limiting its appeal among health-conscious and gluten-sensitive consumers alike.
In addition, expansion into new markets presents significant opportunities for the barley flour market. As globalization continues to connect diverse cultures and culinary traditions, there is an increasing interest in exploring alternative grains like barley flour in regions where it may not have traditionally been used extensively. By introducing barley flour to new markets, producers can tap into previously untapped consumer demographics and capitalize on the growing demand for nutritious and versatile ingredients. This expansion offers the chance to showcase barley flour's unique flavor profile and nutritional benefits to consumers who may be unfamiliar with its culinary potential.
Moreover, as health and wellness trends gain momentum globally, there is a growing demand for whole-grain products like barley flour among health-conscious consumers in both domestic and international markets. By strategically targeting regions where health and wellness are prioritized, producers can position barley flour as a premium ingredient that caters to the needs of discerning consumers seeking nutritious dietary options. Collaborations with local distributors, retailers, and foodservice providers can facilitate market penetration and raise awareness of barley flour, paving the way for its acceptance and adoption in new markets around the globe.
The barley flour market is analyzed on the basis of type, application, distribution channel, and region. By type, the market is segmented into organic and conventional. By application, the market is divided into household, commercial, and others. Depending on distribution channel, it is classified into B2B and B2C. Region-wise, the market is analyzed across North America (the U.S., Canada, and Mexico), Europe (Germany, the UK, France, Italy, Russia, and the rest of Europe), Asia-Pacific (China, India, Japan, South Korea, Australia, and the rest of Asia-Pacific), Latin America (Brazil, Colombia, Argentina, and the rest of Latin America), and Middle East and Africa (GCC, South Africa, and the rest of MEA).
The major players operating in the global barley flour market are Bob's Red Mill Natural Foods, Inc., Ardent Mills, Cereal & Malt, Bio-Kinetics, Shiloh Farms, Great River Organic Milling, Mirfak Pty Ltd., Richardson Milling (UK) Ltd, FairhavenMill, and To Your Health Sprouted Flour Co.
Key Benefits For Stakeholders
- This report provides a quantitative analysis of the market segments, current trends, estimations, and dynamics of the barley flour market analysis from 2022 to 2032 to identify the prevailing barley flour market opportunities.
- The market research is offered along with information related to key drivers, restraints, and opportunities.
- Porter's five forces analysis highlights the potency of buyers and suppliers to enable stakeholders make profit-oriented business decisions and strengthen their supplier-buyer network.
- In-depth analysis of the barley flour market segmentation assists to determine the prevailing market opportunities.
- Major countries in each region are mapped according to their revenue contribution to the global market.
- Market player positioning facilitates benchmarking and provides a clear understanding of the present position of the market players.
- The report includes the analysis of the regional as well as global barley flour market trends, key players, market segments, application areas, and market growth strategies.
Additional benefits you will get with this purchase are:
- Quarterly Update and* (only available with a corporate license, on listed price)
- 5 additional Company Profile of client Choice pre- or Post-purchase, as a free update.
- Free Upcoming Version on the Purchase of Five and Enterprise User License.
- 16 analyst hours of support* (post-purchase, if you find additional data requirements upon review of the report, you may receive support amounting to 16 analyst hours to solve questions, and post-sale queries)
- 15% Free Customization* (in case the scope or segment of the report does not match your requirements, 15% is equivalent to 3 working days of free work, applicable once)
- Free data Pack on the Five and Enterprise User License. (Excel version of the report)
- Free Updated report if the report is 6-12 months old or older.
- 24-hour priority response*
- Free Industry updates and white papers.
Possible Customization with this report (with additional cost and timeline, please talk to the sales executive to know more)
- Consumer Buying Behavior Analysis
- Investment Opportunities
- Consumer Preference and Product Specifications
- Go To Market Strategy
- Additional company profiles with specific to client's interest
- Additional country or region analysis- market size and forecast
- Expanded list for Company Profiles
- SWOT Analysis
Key Market Segments
By Product Type
- Organic
- Conventional
By Application
- Household
- Commercial
- Other
By Distribution Channel
- B2B
- B2C
By Region
- North America
- U.S.
- Canada
- Mexico
- Europe
- Germany
- UK
- France
- Italy
- Russia
- Rest of Europe
- Asia-Pacific
- China
- India
- Japan
- South Korea
- Australia
- Rest of Asia-Pacific
- Latin America
- Brazil
- Colombia
- Argentina
- Rest of Latin America
- Middle East and Africa
- Gcc
- South Africa
- Rest of Middle East And Africa
Key Market Players:
- Bob's Red Mill Natural Foods, Inc.
- Ardent Mills
- Cereal & Malt
- Bio-Kinetics
- Shiloh Farms
- Great River Organic Milling
- Mirfak Pty Ltd.
- Richardson Milling (UK) Ltd
- FairhavenMill
- To Your Health Sprouted Flour Co.
TABLE OF CONTENTS
CHAPTER 1: INTRODUCTION
- 1.1. Report description
- 1.2. Key market segments
- 1.3. Key benefits to the stakeholders
- 1.4. Research methodology
- 1.4.1. Primary research
- 1.4.2. Secondary research
- 1.4.3. Analyst tools and models
CHAPTER 2: EXECUTIVE SUMMARY
- 2.1. CXO perspective
CHAPTER 3: MARKET OVERVIEW
- 3.1. Market definition and scope
- 3.2. Key findings
- 3.2.1. Top impacting factors
- 3.2.2. Top investment pockets
- 3.3. Porter's five forces analysis
- 3.4. Market dynamics
- 3.4.1. Drivers
- 3.4.2. Restraints
- 3.4.3. Opportunities
CHAPTER 4: BARLEY FLOUR MARKET, BY PRODUCT TYPE
- 4.1. Overview
- 4.1.1. Market size and forecast
- 4.2. Organic
- 4.2.1. Key market trends, growth factors and opportunities
- 4.2.2. Market size and forecast, by region
- 4.2.3. Market share analysis by country
- 4.3. Conventional
- 4.3.1. Key market trends, growth factors and opportunities
- 4.3.2. Market size and forecast, by region
- 4.3.3. Market share analysis by country
CHAPTER 5: BARLEY FLOUR MARKET, BY APPLICATION
- 5.1. Overview
- 5.1.1. Market size and forecast
- 5.2. Household
- 5.2.1. Key market trends, growth factors and opportunities
- 5.2.2. Market size and forecast, by region
- 5.2.3. Market share analysis by country
- 5.3. Commercial
- 5.3.1. Key market trends, growth factors and opportunities
- 5.3.2. Market size and forecast, by region
- 5.3.3. Market share analysis by country
- 5.4. Other
- 5.4.1. Key market trends, growth factors and opportunities
- 5.4.2. Market size and forecast, by region
- 5.4.3. Market share analysis by country
CHAPTER 6: BARLEY FLOUR MARKET, BY DISTRIBUTION CHANNEL
- 6.1. Overview
- 6.1.1. Market size and forecast
- 6.2. B2B
- 6.2.1. Key market trends, growth factors and opportunities
- 6.2.2. Market size and forecast, by region
- 6.2.3. Market share analysis by country
- 6.3. B2C
- 6.3.1. Key market trends, growth factors and opportunities
- 6.3.2. Market size and forecast, by region
- 6.3.3. Market share analysis by country
CHAPTER 7: BARLEY FLOUR MARKET, BY REGION
- 7.1. Overview
- 7.1.1. Market size and forecast By Region
- 7.2. North America
- 7.2.1. Key market trends, growth factors and opportunities
- 7.2.2. Market size and forecast, by Product Type
- 7.2.3. Market size and forecast, by Application
- 7.2.4. Market size and forecast, by Distribution Channel
- 7.2.5. Market size and forecast, by country
- 7.2.5.1. U.S.
- 7.2.5.1.1. Market size and forecast, by Product Type
- 7.2.5.1.2. Market size and forecast, by Application
- 7.2.5.1.3. Market size and forecast, by Distribution Channel
- 7.2.5.2. Canada
- 7.2.5.2.1. Market size and forecast, by Product Type
- 7.2.5.2.2. Market size and forecast, by Application
- 7.2.5.2.3. Market size and forecast, by Distribution Channel
- 7.2.5.3. Mexico
- 7.2.5.3.1. Market size and forecast, by Product Type
- 7.2.5.3.2. Market size and forecast, by Application
- 7.2.5.3.3. Market size and forecast, by Distribution Channel
- 7.3. Europe
- 7.3.1. Key market trends, growth factors and opportunities
- 7.3.2. Market size and forecast, by Product Type
- 7.3.3. Market size and forecast, by Application
- 7.3.4. Market size and forecast, by Distribution Channel
- 7.3.5. Market size and forecast, by country
- 7.3.5.1. Germany
- 7.3.5.1.1. Market size and forecast, by Product Type
- 7.3.5.1.2. Market size and forecast, by Application
- 7.3.5.1.3. Market size and forecast, by Distribution Channel
- 7.3.5.2. UK
- 7.3.5.2.1. Market size and forecast, by Product Type
- 7.3.5.2.2. Market size and forecast, by Application
- 7.3.5.2.3. Market size and forecast, by Distribution Channel
- 7.3.5.3. France
- 7.3.5.3.1. Market size and forecast, by Product Type
- 7.3.5.3.2. Market size and forecast, by Application
- 7.3.5.3.3. Market size and forecast, by Distribution Channel
- 7.3.5.4. Italy
- 7.3.5.4.1. Market size and forecast, by Product Type
- 7.3.5.4.2. Market size and forecast, by Application
- 7.3.5.4.3. Market size and forecast, by Distribution Channel
- 7.3.5.5. Russia
- 7.3.5.5.1. Market size and forecast, by Product Type
- 7.3.5.5.2. Market size and forecast, by Application
- 7.3.5.5.3. Market size and forecast, by Distribution Channel
- 7.3.5.6. Rest of Europe
- 7.3.5.6.1. Market size and forecast, by Product Type
- 7.3.5.6.2. Market size and forecast, by Application
- 7.3.5.6.3. Market size and forecast, by Distribution Channel
- 7.4. Asia-Pacific
- 7.4.1. Key market trends, growth factors and opportunities
- 7.4.2. Market size and forecast, by Product Type
- 7.4.3. Market size and forecast, by Application
- 7.4.4. Market size and forecast, by Distribution Channel
- 7.4.5. Market size and forecast, by country
- 7.4.5.1. China
- 7.4.5.1.1. Market size and forecast, by Product Type
- 7.4.5.1.2. Market size and forecast, by Application
- 7.4.5.1.3. Market size and forecast, by Distribution Channel
- 7.4.5.2. India
- 7.4.5.2.1. Market size and forecast, by Product Type
- 7.4.5.2.2. Market size and forecast, by Application
- 7.4.5.2.3. Market size and forecast, by Distribution Channel
- 7.4.5.3. Japan
- 7.4.5.3.1. Market size and forecast, by Product Type
- 7.4.5.3.2. Market size and forecast, by Application
- 7.4.5.3.3. Market size and forecast, by Distribution Channel
- 7.4.5.4. South Korea
- 7.4.5.4.1. Market size and forecast, by Product Type
- 7.4.5.4.2. Market size and forecast, by Application
- 7.4.5.4.3. Market size and forecast, by Distribution Channel
- 7.4.5.5. Australia
- 7.4.5.5.1. Market size and forecast, by Product Type
- 7.4.5.5.2. Market size and forecast, by Application
- 7.4.5.5.3. Market size and forecast, by Distribution Channel
- 7.4.5.6. Rest of Asia-Pacific
- 7.4.5.6.1. Market size and forecast, by Product Type
- 7.4.5.6.2. Market size and forecast, by Application
- 7.4.5.6.3. Market size and forecast, by Distribution Channel
- 7.5. Latin America
- 7.5.1. Key market trends, growth factors and opportunities
- 7.5.2. Market size and forecast, by Product Type
- 7.5.3. Market size and forecast, by Application
- 7.5.4. Market size and forecast, by Distribution Channel
- 7.5.5. Market size and forecast, by country
- 7.5.5.1. Brazil
- 7.5.5.1.1. Market size and forecast, by Product Type
- 7.5.5.1.2. Market size and forecast, by Application
- 7.5.5.1.3. Market size and forecast, by Distribution Channel
- 7.5.5.2. Colombia
- 7.5.5.2.1. Market size and forecast, by Product Type
- 7.5.5.2.2. Market size and forecast, by Application
- 7.5.5.2.3. Market size and forecast, by Distribution Channel
- 7.5.5.3. Argentina
- 7.5.5.3.1. Market size and forecast, by Product Type
- 7.5.5.3.2. Market size and forecast, by Application
- 7.5.5.3.3. Market size and forecast, by Distribution Channel
- 7.5.5.4. Rest of Latin America
- 7.5.5.4.1. Market size and forecast, by Product Type
- 7.5.5.4.2. Market size and forecast, by Application
- 7.5.5.4.3. Market size and forecast, by Distribution Channel
- 7.6. Middle East and Africa
- 7.6.1. Key market trends, growth factors and opportunities
- 7.6.2. Market size and forecast, by Product Type
- 7.6.3. Market size and forecast, by Application
- 7.6.4. Market size and forecast, by Distribution Channel
- 7.6.5. Market size and forecast, by country
- 7.6.5.1. Gcc
- 7.6.5.1.1. Market size and forecast, by Product Type
- 7.6.5.1.2. Market size and forecast, by Application
- 7.6.5.1.3. Market size and forecast, by Distribution Channel
- 7.6.5.2. South Africa
- 7.6.5.2.1. Market size and forecast, by Product Type
- 7.6.5.2.2. Market size and forecast, by Application
- 7.6.5.2.3. Market size and forecast, by Distribution Channel
- 7.6.5.3. Rest of Middle East And Africa
- 7.6.5.3.1. Market size and forecast, by Product Type
- 7.6.5.3.2. Market size and forecast, by Application
- 7.6.5.3.3. Market size and forecast, by Distribution Channel
CHAPTER 8: COMPETITIVE LANDSCAPE
- 8.1. Introduction
- 8.2. Top winning strategies
- 8.3. Product mapping of top 10 player
- 8.4. Competitive dashboard
- 8.5. Competitive heatmap
- 8.6. Top player positioning, 2022
CHAPTER 9: COMPANY PROFILES
- 9.1. Bob's Red Mill Natural Foods, Inc.
- 9.1.1. Company overview
- 9.1.2. Key executives
- 9.1.3. Company snapshot
- 9.1.4. Operating business segments
- 9.1.5. Product portfolio
- 9.1.6. Business performance
- 9.1.7. Key strategic moves and developments
- 9.2. Ardent Mills
- 9.2.1. Company overview
- 9.2.2. Key executives
- 9.2.3. Company snapshot
- 9.2.4. Operating business segments
- 9.2.5. Product portfolio
- 9.2.6. Business performance
- 9.2.7. Key strategic moves and developments
- 9.3. Cereal & Malt
- 9.3.1. Company overview
- 9.3.2. Key executives
- 9.3.3. Company snapshot
- 9.3.4. Operating business segments
- 9.3.5. Product portfolio
- 9.3.6. Business performance
- 9.3.7. Key strategic moves and developments
- 9.4. Bio-Kinetics
- 9.4.1. Company overview
- 9.4.2. Key executives
- 9.4.3. Company snapshot
- 9.4.4. Operating business segments
- 9.4.5. Product portfolio
- 9.4.6. Business performance
- 9.4.7. Key strategic moves and developments
- 9.5. Shiloh Farms
- 9.5.1. Company overview
- 9.5.2. Key executives
- 9.5.3. Company snapshot
- 9.5.4. Operating business segments
- 9.5.5. Product portfolio
- 9.5.6. Business performance
- 9.5.7. Key strategic moves and developments
- 9.6. Great River Organic Milling
- 9.6.1. Company overview
- 9.6.2. Key executives
- 9.6.3. Company snapshot
- 9.6.4. Operating business segments
- 9.6.5. Product portfolio
- 9.6.6. Business performance
- 9.6.7. Key strategic moves and developments
- 9.7. Mirfak Pty Ltd.
- 9.7.1. Company overview
- 9.7.2. Key executives
- 9.7.3. Company snapshot
- 9.7.4. Operating business segments
- 9.7.5. Product portfolio
- 9.7.6. Business performance
- 9.7.7. Key strategic moves and developments
- 9.8. Richardson Milling (UK) Ltd
- 9.8.1. Company overview
- 9.8.2. Key executives
- 9.8.3. Company snapshot
- 9.8.4. Operating business segments
- 9.8.5. Product portfolio
- 9.8.6. Business performance
- 9.8.7. Key strategic moves and developments
- 9.9. FairhavenMill
- 9.9.1. Company overview
- 9.9.2. Key executives
- 9.9.3. Company snapshot
- 9.9.4. Operating business segments
- 9.9.5. Product portfolio
- 9.9.6. Business performance
- 9.9.7. Key strategic moves and developments
- 9.10. To Your Health Sprouted Flour Co.
- 9.10.1. Company overview
- 9.10.2. Key executives
- 9.10.3. Company snapshot
- 9.10.4. Operating business segments
- 9.10.5. Product portfolio
- 9.10.6. Business performance
- 9.10.7. Key strategic moves and developments
LIST OF TABLES
- TABLE 01. GLOBAL BARLEY FLOUR MARKET, BY PRODUCT TYPE, 2022-2032 ($MILLION)
- TABLE 02. BARLEY FLOUR MARKET FOR ORGANIC, BY REGION, 2022-2032 ($MILLION)
- TABLE 03. BARLEY FLOUR MARKET FOR CONVENTIONAL, BY REGION, 2022-2032 ($MILLION)
- TABLE 04. GLOBAL BARLEY FLOUR MARKET, BY APPLICATION, 2022-2032 ($MILLION)
- TABLE 05. BARLEY FLOUR MARKET FOR HOUSEHOLD, BY REGION, 2022-2032 ($MILLION)
- TABLE 06. BARLEY FLOUR MARKET FOR COMMERCIAL, BY REGION, 2022-2032 ($MILLION)
- TABLE 07. BARLEY FLOUR MARKET FOR OTHER, BY REGION, 2022-2032 ($MILLION)
- TABLE 08. GLOBAL BARLEY FLOUR MARKET, BY DISTRIBUTION CHANNEL, 2022-2032 ($MILLION)
- TABLE 09. BARLEY FLOUR MARKET FOR B2B, BY REGION, 2022-2032 ($MILLION)
- TABLE 10. BARLEY FLOUR MARKET FOR B2C, BY REGION, 2022-2032 ($MILLION)
- TABLE 11. BARLEY FLOUR MARKET, BY REGION, 2022-2032 ($MILLION)
- TABLE 12. NORTH AMERICA BARLEY FLOUR MARKET, BY PRODUCT TYPE, 2022-2032 ($MILLION)
- TABLE 13. NORTH AMERICA BARLEY FLOUR MARKET, BY APPLICATION, 2022-2032 ($MILLION)
- TABLE 14. NORTH AMERICA BARLEY FLOUR MARKET, BY DISTRIBUTION CHANNEL, 2022-2032 ($MILLION)
- TABLE 15. NORTH AMERICA BARLEY FLOUR MARKET, BY COUNTRY, 2022-2032 ($MILLION)
- TABLE 16. U.S. BARLEY FLOUR MARKET, BY PRODUCT TYPE, 2022-2032 ($MILLION)
- TABLE 17. U.S. BARLEY FLOUR MARKET, BY APPLICATION, 2022-2032 ($MILLION)
- TABLE 18. U.S. BARLEY FLOUR MARKET, BY DISTRIBUTION CHANNEL, 2022-2032 ($MILLION)
- TABLE 19. CANADA BARLEY FLOUR MARKET, BY PRODUCT TYPE, 2022-2032 ($MILLION)
- TABLE 20. CANADA BARLEY FLOUR MARKET, BY APPLICATION, 2022-2032 ($MILLION)
- TABLE 21. CANADA BARLEY FLOUR MARKET, BY DISTRIBUTION CHANNEL, 2022-2032 ($MILLION)
- TABLE 22. MEXICO BARLEY FLOUR MARKET, BY PRODUCT TYPE, 2022-2032 ($MILLION)
- TABLE 23. MEXICO BARLEY FLOUR MARKET, BY APPLICATION, 2022-2032 ($MILLION)
- TABLE 24. MEXICO BARLEY FLOUR MARKET, BY DISTRIBUTION CHANNEL, 2022-2032 ($MILLION)
- TABLE 25. EUROPE BARLEY FLOUR MARKET, BY PRODUCT TYPE, 2022-2032 ($MILLION)
- TABLE 26. EUROPE BARLEY FLOUR MARKET, BY APPLICATION, 2022-2032 ($MILLION)
- TABLE 27. EUROPE BARLEY FLOUR MARKET, BY DISTRIBUTION CHANNEL, 2022-2032 ($MILLION)
- TABLE 28. EUROPE BARLEY FLOUR MARKET, BY COUNTRY, 2022-2032 ($MILLION)
- TABLE 29. GERMANY BARLEY FLOUR MARKET, BY PRODUCT TYPE, 2022-2032 ($MILLION)
- TABLE 30. GERMANY BARLEY FLOUR MARKET, BY APPLICATION, 2022-2032 ($MILLION)
- TABLE 31. GERMANY BARLEY FLOUR MARKET, BY DISTRIBUTION CHANNEL, 2022-2032 ($MILLION)
- TABLE 32. UK BARLEY FLOUR MARKET, BY PRODUCT TYPE, 2022-2032 ($MILLION)
- TABLE 33. UK BARLEY FLOUR MARKET, BY APPLICATION, 2022-2032 ($MILLION)
- TABLE 34. UK BARLEY FLOUR MARKET, BY DISTRIBUTION CHANNEL, 2022-2032 ($MILLION)
- TABLE 35. FRANCE BARLEY FLOUR MARKET, BY PRODUCT TYPE, 2022-2032 ($MILLION)
- TABLE 36. FRANCE BARLEY FLOUR MARKET, BY APPLICATION, 2022-2032 ($MILLION)
- TABLE 37. FRANCE BARLEY FLOUR MARKET, BY DISTRIBUTION CHANNEL, 2022-2032 ($MILLION)
- TABLE 38. ITALY BARLEY FLOUR MARKET, BY PRODUCT TYPE, 2022-2032 ($MILLION)
- TABLE 39. ITALY BARLEY FLOUR MARKET, BY APPLICATION, 2022-2032 ($MILLION)
- TABLE 40. ITALY BARLEY FLOUR MARKET, BY DISTRIBUTION CHANNEL, 2022-2032 ($MILLION)
- TABLE 41. RUSSIA BARLEY FLOUR MARKET, BY PRODUCT TYPE, 2022-2032 ($MILLION)
- TABLE 42. RUSSIA BARLEY FLOUR MARKET, BY APPLICATION, 2022-2032 ($MILLION)
- TABLE 43. RUSSIA BARLEY FLOUR MARKET, BY DISTRIBUTION CHANNEL, 2022-2032 ($MILLION)
- TABLE 44. REST OF EUROPE BARLEY FLOUR MARKET, BY PRODUCT TYPE, 2022-2032 ($MILLION)
- TABLE 45. REST OF EUROPE BARLEY FLOUR MARKET, BY APPLICATION, 2022-2032 ($MILLION)
- TABLE 46. REST OF EUROPE BARLEY FLOUR MARKET, BY DISTRIBUTION CHANNEL, 2022-2032 ($MILLION)
- TABLE 47. ASIA-PACIFIC BARLEY FLOUR MARKET, BY PRODUCT TYPE, 2022-2032 ($MILLION)
- TABLE 48. ASIA-PACIFIC BARLEY FLOUR MARKET, BY APPLICATION, 2022-2032 ($MILLION)
- TABLE 49. ASIA-PACIFIC BARLEY FLOUR MARKET, BY DISTRIBUTION CHANNEL, 2022-2032 ($MILLION)
- TABLE 50. ASIA-PACIFIC BARLEY FLOUR MARKET, BY COUNTRY, 2022-2032 ($MILLION)
- TABLE 51. CHINA BARLEY FLOUR MARKET, BY PRODUCT TYPE, 2022-2032 ($MILLION)
- TABLE 52. CHINA BARLEY FLOUR MARKET, BY APPLICATION, 2022-2032 ($MILLION)
- TABLE 53. CHINA BARLEY FLOUR MARKET, BY DISTRIBUTION CHANNEL, 2022-2032 ($MILLION)
- TABLE 54. INDIA BARLEY FLOUR MARKET, BY PRODUCT TYPE, 2022-2032 ($MILLION)
- TABLE 55. INDIA BARLEY FLOUR MARKET, BY APPLICATION, 2022-2032 ($MILLION)
- TABLE 56. INDIA BARLEY FLOUR MARKET, BY DISTRIBUTION CHANNEL, 2022-2032 ($MILLION)
- TABLE 57. JAPAN BARLEY FLOUR MARKET, BY PRODUCT TYPE, 2022-2032 ($MILLION)
- TABLE 58. JAPAN BARLEY FLOUR MARKET, BY APPLICATION, 2022-2032 ($MILLION)
- TABLE 59. JAPAN BARLEY FLOUR MARKET, BY DISTRIBUTION CHANNEL, 2022-2032 ($MILLION)
- TABLE 60. SOUTH KOREA BARLEY FLOUR MARKET, BY PRODUCT TYPE, 2022-2032 ($MILLION)
- TABLE 61. SOUTH KOREA BARLEY FLOUR MARKET, BY APPLICATION, 2022-2032 ($MILLION)
- TABLE 62. SOUTH KOREA BARLEY FLOUR MARKET, BY DISTRIBUTION CHANNEL, 2022-2032 ($MILLION)
- TABLE 63. AUSTRALIA BARLEY FLOUR MARKET, BY PRODUCT TYPE, 2022-2032 ($MILLION)
- TABLE 64. AUSTRALIA BARLEY FLOUR MARKET, BY APPLICATION, 2022-2032 ($MILLION)
- TABLE 65. AUSTRALIA BARLEY FLOUR MARKET, BY DISTRIBUTION CHANNEL, 2022-2032 ($MILLION)
- TABLE 66. REST OF ASIA-PACIFIC BARLEY FLOUR MARKET, BY PRODUCT TYPE, 2022-2032 ($MILLION)
- TABLE 67. REST OF ASIA-PACIFIC BARLEY FLOUR MARKET, BY APPLICATION, 2022-2032 ($MILLION)
- TABLE 68. REST OF ASIA-PACIFIC BARLEY FLOUR MARKET, BY DISTRIBUTION CHANNEL, 2022-2032 ($MILLION)
- TABLE 69. LATIN AMERICA BARLEY FLOUR MARKET, BY PRODUCT TYPE, 2022-2032 ($MILLION)
- TABLE 70. LATIN AMERICA BARLEY FLOUR MARKET, BY APPLICATION, 2022-2032 ($MILLION)
- TABLE 71. LATIN AMERICA BARLEY FLOUR MARKET, BY DISTRIBUTION CHANNEL, 2022-2032 ($MILLION)
- TABLE 72. LATIN AMERICA BARLEY FLOUR MARKET, BY COUNTRY, 2022-2032 ($MILLION)
- TABLE 73. BRAZIL BARLEY FLOUR MARKET, BY PRODUCT TYPE, 2022-2032 ($MILLION)
- TABLE 74. BRAZIL BARLEY FLOUR MARKET, BY APPLICATION, 2022-2032 ($MILLION)
- TABLE 75. BRAZIL BARLEY FLOUR MARKET, BY DISTRIBUTION CHANNEL, 2022-2032 ($MILLION)
- TABLE 76. COLOMBIA BARLEY FLOUR MARKET, BY PRODUCT TYPE, 2022-2032 ($MILLION)
- TABLE 77. COLOMBIA BARLEY FLOUR MARKET, BY APPLICATION, 2022-2032 ($MILLION)
- TABLE 78. COLOMBIA BARLEY FLOUR MARKET, BY DISTRIBUTION CHANNEL, 2022-2032 ($MILLION)
- TABLE 79. ARGENTINA BARLEY FLOUR MARKET, BY PRODUCT TYPE, 2022-2032 ($MILLION)
- TABLE 80. ARGENTINA BARLEY FLOUR MARKET, BY APPLICATION, 2022-2032 ($MILLION)
- TABLE 81. ARGENTINA BARLEY FLOUR MARKET, BY DISTRIBUTION CHANNEL, 2022-2032 ($MILLION)
- TABLE 82. REST OF LATIN AMERICA BARLEY FLOUR MARKET, BY PRODUCT TYPE, 2022-2032 ($MILLION)
- TABLE 83. REST OF LATIN AMERICA BARLEY FLOUR MARKET, BY APPLICATION, 2022-2032 ($MILLION)
- TABLE 84. REST OF LATIN AMERICA BARLEY FLOUR MARKET, BY DISTRIBUTION CHANNEL, 2022-2032 ($MILLION)
- TABLE 85. MIDDLE EAST AND AFRICA BARLEY FLOUR MARKET, BY PRODUCT TYPE, 2022-2032 ($MILLION)
- TABLE 86. MIDDLE EAST AND AFRICA BARLEY FLOUR MARKET, BY APPLICATION, 2022-2032 ($MILLION)
- TABLE 87. MIDDLE EAST AND AFRICA BARLEY FLOUR MARKET, BY DISTRIBUTION CHANNEL, 2022-2032 ($MILLION)
- TABLE 88. MIDDLE EAST AND AFRICA BARLEY FLOUR MARKET, BY COUNTRY, 2022-2032 ($MILLION)
- TABLE 89. GCC BARLEY FLOUR MARKET, BY PRODUCT TYPE, 2022-2032 ($MILLION)
- TABLE 90. GCC BARLEY FLOUR MARKET, BY APPLICATION, 2022-2032 ($MILLION)
- TABLE 91. GCC BARLEY FLOUR MARKET, BY DISTRIBUTION CHANNEL, 2022-2032 ($MILLION)
- TABLE 92. SOUTH AFRICA BARLEY FLOUR MARKET, BY PRODUCT TYPE, 2022-2032 ($MILLION)
- TABLE 93. SOUTH AFRICA BARLEY FLOUR MARKET, BY APPLICATION, 2022-2032 ($MILLION)
- TABLE 94. SOUTH AFRICA BARLEY FLOUR MARKET, BY DISTRIBUTION CHANNEL, 2022-2032 ($MILLION)
- TABLE 95. REST OF MIDDLE EAST AND AFRICA BARLEY FLOUR MARKET, BY PRODUCT TYPE, 2022-2032 ($MILLION)
- TABLE 96. REST OF MIDDLE EAST AND AFRICA BARLEY FLOUR MARKET, BY APPLICATION, 2022-2032 ($MILLION)
- TABLE 97. REST OF MIDDLE EAST AND AFRICA BARLEY FLOUR MARKET, BY DISTRIBUTION CHANNEL, 2022-2032 ($MILLION)
- TABLE 98. BOB'S RED MILL NATURAL FOODS, INC.: KEY EXECUTIVES
- TABLE 99. BOB'S RED MILL NATURAL FOODS, INC.: COMPANY SNAPSHOT
- TABLE 100. BOB'S RED MILL NATURAL FOODS, INC.: PRODUCT SEGMENTS
- TABLE 101. BOB'S RED MILL NATURAL FOODS, INC.: SERVICE SEGMENTS
- TABLE 102. BOB'S RED MILL NATURAL FOODS, INC.: PRODUCT PORTFOLIO
- TABLE 103. BOB'S RED MILL NATURAL FOODS, INC.: KEY STRATERGIES
- TABLE 104. ARDENT MILLS: KEY EXECUTIVES
- TABLE 105. ARDENT MILLS: COMPANY SNAPSHOT
- TABLE 106. ARDENT MILLS: PRODUCT SEGMENTS
- TABLE 107. ARDENT MILLS: SERVICE SEGMENTS
- TABLE 108. ARDENT MILLS: PRODUCT PORTFOLIO
- TABLE 109. ARDENT MILLS: KEY STRATERGIES
- TABLE 110. CEREAL & MALT: KEY EXECUTIVES
- TABLE 111. CEREAL & MALT: COMPANY SNAPSHOT
- TABLE 112. CEREAL & MALT: PRODUCT SEGMENTS
- TABLE 113. CEREAL & MALT: SERVICE SEGMENTS
- TABLE 114. CEREAL & MALT: PRODUCT PORTFOLIO
- TABLE 115. CEREAL & MALT: KEY STRATERGIES
- TABLE 116. BIO-KINETICS: KEY EXECUTIVES
- TABLE 117. BIO-KINETICS: COMPANY SNAPSHOT
- TABLE 118. BIO-KINETICS: PRODUCT SEGMENTS
- TABLE 119. BIO-KINETICS: SERVICE SEGMENTS
- TABLE 120. BIO-KINETICS: PRODUCT PORTFOLIO
- TABLE 121. BIO-KINETICS: KEY STRATERGIES
- TABLE 122. SHILOH FARMS: KEY EXECUTIVES
- TABLE 123. SHILOH FARMS: COMPANY SNAPSHOT
- TABLE 124. SHILOH FARMS: PRODUCT SEGMENTS
- TABLE 125. SHILOH FARMS: SERVICE SEGMENTS
- TABLE 126. SHILOH FARMS: PRODUCT PORTFOLIO
- TABLE 127. SHILOH FARMS: KEY STRATERGIES
- TABLE 128. GREAT RIVER ORGANIC MILLING: KEY EXECUTIVES
- TABLE 129. GREAT RIVER ORGANIC MILLING: COMPANY SNAPSHOT
- TABLE 130. GREAT RIVER ORGANIC MILLING: PRODUCT SEGMENTS
- TABLE 131. GREAT RIVER ORGANIC MILLING: SERVICE SEGMENTS
- TABLE 132. GREAT RIVER ORGANIC MILLING: PRODUCT PORTFOLIO
- TABLE 133. GREAT RIVER ORGANIC MILLING: KEY STRATERGIES
- TABLE 134. MIRFAK PTY LTD.: KEY EXECUTIVES
- TABLE 135. MIRFAK PTY LTD.: COMPANY SNAPSHOT
- TABLE 136. MIRFAK PTY LTD.: PRODUCT SEGMENTS
- TABLE 137. MIRFAK PTY LTD.: SERVICE SEGMENTS
- TABLE 138. MIRFAK PTY LTD.: PRODUCT PORTFOLIO
- TABLE 139. MIRFAK PTY LTD.: KEY STRATERGIES
- TABLE 140. RICHARDSON MILLING (UK) LTD: KEY EXECUTIVES
- TABLE 141. RICHARDSON MILLING (UK) LTD: COMPANY SNAPSHOT
- TABLE 142. RICHARDSON MILLING (UK) LTD: PRODUCT SEGMENTS
- TABLE 143. RICHARDSON MILLING (UK) LTD: SERVICE SEGMENTS
- TABLE 144. RICHARDSON MILLING (UK) LTD: PRODUCT PORTFOLIO
- TABLE 145. RICHARDSON MILLING (UK) LTD: KEY STRATERGIES
- TABLE 146. FAIRHAVENMILL: KEY EXECUTIVES
- TABLE 147. FAIRHAVENMILL: COMPANY SNAPSHOT
- TABLE 148. FAIRHAVENMILL: PRODUCT SEGMENTS
- TABLE 149. FAIRHAVENMILL: SERVICE SEGMENTS
- TABLE 150. FAIRHAVENMILL: PRODUCT PORTFOLIO
- TABLE 151. FAIRHAVENMILL: KEY STRATERGIES
- TABLE 152. TO YOUR HEALTH SPROUTED FLOUR CO.: KEY EXECUTIVES
- TABLE 153. TO YOUR HEALTH SPROUTED FLOUR CO.: COMPANY SNAPSHOT
- TABLE 154. TO YOUR HEALTH SPROUTED FLOUR CO.: PRODUCT SEGMENTS
- TABLE 155. TO YOUR HEALTH SPROUTED FLOUR CO.: SERVICE SEGMENTS
- TABLE 156. TO YOUR HEALTH SPROUTED FLOUR CO.: PRODUCT PORTFOLIO
- TABLE 157. TO YOUR HEALTH SPROUTED FLOUR CO.: KEY STRATERGIES
LIST OF FIGURES
- FIGURE 01. BARLEY FLOUR MARKET, 2022-2032
- FIGURE 02. SEGMENTATION OF BARLEY FLOUR MARKET,2022-2032
- FIGURE 03. TOP IMPACTING FACTORS IN BARLEY FLOUR MARKET
- FIGURE 04. TOP INVESTMENT POCKETS IN BARLEY FLOUR MARKET (2023-2032)
- FIGURE 05. BARGAINING POWER OF SUPPLIERS
- FIGURE 06. BARGAINING POWER OF BUYERS
- FIGURE 07. THREAT OF SUBSTITUTION
- FIGURE 08. THREAT OF SUBSTITUTION
- FIGURE 09. COMPETITIVE RIVALRY
- FIGURE 10. GLOBAL BARLEY FLOUR MARKET:DRIVERS, RESTRAINTS AND OPPORTUNITIES
- FIGURE 11. BARLEY FLOUR MARKET, BY PRODUCT TYPE, 2022 AND 2032(%)
- FIGURE 12. COMPARATIVE SHARE ANALYSIS OF BARLEY FLOUR MARKET FOR ORGANIC, BY COUNTRY 2022 AND 2032(%)
- FIGURE 13. COMPARATIVE SHARE ANALYSIS OF BARLEY FLOUR MARKET FOR CONVENTIONAL, BY COUNTRY 2022 AND 2032(%)
- FIGURE 14. BARLEY FLOUR MARKET, BY APPLICATION, 2022 AND 2032(%)
- FIGURE 15. COMPARATIVE SHARE ANALYSIS OF BARLEY FLOUR MARKET FOR HOUSEHOLD, BY COUNTRY 2022 AND 2032(%)
- FIGURE 16. COMPARATIVE SHARE ANALYSIS OF BARLEY FLOUR MARKET FOR COMMERCIAL, BY COUNTRY 2022 AND 2032(%)
- FIGURE 17. COMPARATIVE SHARE ANALYSIS OF BARLEY FLOUR MARKET FOR OTHER, BY COUNTRY 2022 AND 2032(%)
- FIGURE 18. BARLEY FLOUR MARKET, BY DISTRIBUTION CHANNEL, 2022 AND 2032(%)
- FIGURE 19. COMPARATIVE SHARE ANALYSIS OF BARLEY FLOUR MARKET FOR B2B, BY COUNTRY 2022 AND 2032(%)
- FIGURE 20. COMPARATIVE SHARE ANALYSIS OF BARLEY FLOUR MARKET FOR B2C, BY COUNTRY 2022 AND 2032(%)
- FIGURE 21. BARLEY FLOUR MARKET BY REGION, 2022 AND 2032(%)
- FIGURE 22. U.S. BARLEY FLOUR MARKET, 2022-2032 ($MILLION)
- FIGURE 23. CANADA BARLEY FLOUR MARKET, 2022-2032 ($MILLION)
- FIGURE 24. MEXICO BARLEY FLOUR MARKET, 2022-2032 ($MILLION)
- FIGURE 25. GERMANY BARLEY FLOUR MARKET, 2022-2032 ($MILLION)
- FIGURE 26. UK BARLEY FLOUR MARKET, 2022-2032 ($MILLION)
- FIGURE 27. FRANCE BARLEY FLOUR MARKET, 2022-2032 ($MILLION)
- FIGURE 28. ITALY BARLEY FLOUR MARKET, 2022-2032 ($MILLION)
- FIGURE 29. RUSSIA BARLEY FLOUR MARKET, 2022-2032 ($MILLION)
- FIGURE 30. REST OF EUROPE BARLEY FLOUR MARKET, 2022-2032 ($MILLION)
- FIGURE 31. CHINA BARLEY FLOUR MARKET, 2022-2032 ($MILLION)
- FIGURE 32. INDIA BARLEY FLOUR MARKET, 2022-2032 ($MILLION)
- FIGURE 33. JAPAN BARLEY FLOUR MARKET, 2022-2032 ($MILLION)
- FIGURE 34. SOUTH KOREA BARLEY FLOUR MARKET, 2022-2032 ($MILLION)
- FIGURE 35. AUSTRALIA BARLEY FLOUR MARKET, 2022-2032 ($MILLION)
- FIGURE 36. REST OF ASIA-PACIFIC BARLEY FLOUR MARKET, 2022-2032 ($MILLION)
- FIGURE 37. BRAZIL BARLEY FLOUR MARKET, 2022-2032 ($MILLION)
- FIGURE 38. COLOMBIA BARLEY FLOUR MARKET, 2022-2032 ($MILLION)
- FIGURE 39. ARGENTINA BARLEY FLOUR MARKET, 2022-2032 ($MILLION)
- FIGURE 40. REST OF LATIN AMERICA BARLEY FLOUR MARKET, 2022-2032 ($MILLION)
- FIGURE 41. GCC BARLEY FLOUR MARKET, 2022-2032 ($MILLION)
- FIGURE 42. SOUTH AFRICA BARLEY FLOUR MARKET, 2022-2032 ($MILLION)
- FIGURE 43. REST OF MIDDLE EAST AND AFRICA BARLEY FLOUR MARKET, 2022-2032 ($MILLION)
- FIGURE 44. TOP WINNING STRATEGIES, BY YEAR
- FIGURE 45. TOP WINNING STRATEGIES, BY DEVELOPMENT
- FIGURE 46. TOP WINNING STRATEGIES, BY COMPANY
- FIGURE 47. PRODUCT MAPPING OF TOP 10 PLAYERS
- FIGURE 48. COMPETITIVE DASHBOARD
- FIGURE 49. COMPETITIVE HEATMAP: BARLEY FLOUR MARKET
- FIGURE 50. TOP PLAYER POSITIONING, 2022

