
PUBLISHER: Roots Analysis | PRODUCT CODE: 1682718

PUBLISHER: Roots Analysis | PRODUCT CODE: 1682718
Next Generation Drug Conjugates Market by Type of Next Generation Drug Conjugates, Type of Targeting Ligand, Type of Payload, and Key Geographical Regions: Industry Trends and Global Forecasts, Till 2035
Next Generation Drug Conjugates Market: OVERVIEW
As per Roots Analysis, the global next generation drug conjugates market is estimated to grow from USD 3.3 billion in the current year to USD 15.47 billion by 2035, at a CAGR of 15.07% during the forecast period, till 2035.
The market sizing and opportunity analysis has been segmented across the following parameters:
Type of Next Generation Drug Conjugates
- Peptide Receptor Radionuclide Therapy (Peptide Radionuclide Conjugate)
- Ligand Mediated RNAi Conjugate
- Ligand Conjugated Anti Sense Medicine
- Peptide Drug Conjugate
Type of Targeting Ligand
- Amino Sugar
- Lipid
- Peptide
Type of Payload
- Si-RNA
- Antisense Oligonucleotide
- Radionuclide
- Drug
Type of Therapy
- Monotherapy
- Combination Therapy
Route of Administration
- Intravenous
- Subcutaneous
Key Target Indications
- Gastroenteropancreatic Neuroendocrine Tumors
- Prostate Cancer
- Leptomeningeal Carcinomatosis caused by Breast Cancer Brain Metastases
- Hereditary Transthyretin Amyloidosis
- Atherosclerotic Cardiovascular Diseases
- Severe Hypertriglyceridemia
- Hereditary Angioedema
- Acute Hepatic Porphyria
- Primary Hyperoxaluria
- Heterozygous Familial Hypercholesterolemia
- Hemophilia
- Low-Risk Myelodysplastic Syndrome
- Myelofibrosis
- Alpha-1 Antitrypsin Deficiency Liver Disease
- Familial Chylomicronemia Syndrome
Key Geographical Regions
- North America
- Europe
- Asia-Pacific
- Rest of the World
NEXT GENERATION DRUG CONJUGATES MARKET: GROWTH AND TRENDS
Owing to their non-immunogenic nature, structural stability, better clinical profile, targeted delivery of payload, limited side effects, permeability and deeper cellular penetration, next generation drug conjugates have emerged as viable targeted therapeutics for rare disease indications, including cancers. Similar to antibody drug conjugates (ADCs), these advanced versions boast superior clinical efficacy and stability while employing diverse non-antibody targeting agents, such as peptides, amino sugars, lipids, and small molecules. Instead of traditional drugs, they use payloads, such as oligonucleotides, antisense oligonucleotides, si-RNA, drugs, and radionuclides for targeted delivery. This fusion of targeting ligands and payloads has spawned various types of next generation drug conjugates, including peptide drug conjugates, peptide receptor radionuclide therapy, GalNac conjugates, si-RNA conjugates, all proving effective against diseases, such as solid tumors, metabolic disorders, and hematological disorders.
The USFDA has approved six next generation drug conjugates for therapeutic use, including Lutathera(R), Pluvicto(R), Givlaari(R), Oxlumo(R), Leqvio(R), and Amvuttra(R). These approvals underscore the clinical triumphs of these advanced therapies and their potential across a wide range of medical conditions. With ongoing innovation, promising trial outcomes, expedited approvals, and collaborative efforts, the market for next generation drug conjugates anticipates significant growth in the forecast period.
NEXT GENERATION DRUG CONJUGATES MARKET: KEY INSIGHTS
The report delves into the current state of the next generation drug conjugates market and identifies potential growth opportunities within the industry. Some key findings from the report include:
1. The pipeline features more than 200 next generation drug conjugates with small molecules, peptides, lipids, amino sugars and virus like particles as the targeting ligands for therapeutic purposes.
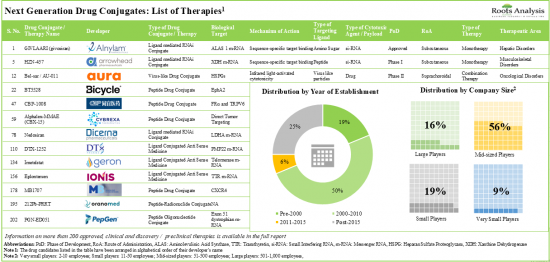
2. Close to 60% of the next generation drug conjugates use peptides as targeting ligands; of these, the majority are being evaluated in clinical trials for the treatment of oncological disorders.
3. Over 260 clinical trials have been registered in the past few years to evaluate the safety and efficacy of various next generation drug conjugates; majority of these studies have been conducted across sites in the US.
4. Over the past few years, partnership activity in this field has increased for the development of effective drug conjugate therapies.
5. Lack of clinical efficacy has been the common reason for drug failure, accounting for the discontinuation of more than 55% of clinical trials, while several non-drug related issues caused the failure of more than 30% of trials.
6. With growing focus on the development pipeline and encouraging clinical results, the market is anticipated to witness an annualized growth rate of over 20%, during the next decade.
NEXT GENERATION DRUG CONJUGATES MARKET: KEY SEGMENTS
Ligand Mediated RNAi Conjugate Occupies the Largest Share of the Next Generation Drug Conjugates Market
Based on the type of next generation drug conjugates, the market is segmented into ligand mediated RNAi conjugate, peptide-radionuclide conjugate, ligand conjugated anti sense medicine and peptide drug conjugate. Currently, ligand mediated RNAi conjugate holds the maximum share of the next generation drug conjugates market. It is worth highlighting that the next generation drug conjugates for ligand conjugated anti sense medicine is likely to grow at a relatively higher CAGR.
Amino Sugar is Likely to Dominate the Next Generation Drug Conjugates Market in the Coming Decade
Based on the targeting ligand, the market is segmented into amino sugar, lipids and peptide. At present, peptide captures the highest portion of the next generation drug conjugates market. However, in the near future, the next generation drug conjugates market is likely to be driven by amino sugar.
Radionuclides Occupy the Largest Share of the Next Generation Drug Conjugates
Based on payload, the market is segmented into si-RNA, radionuclide, antisense oligonucleotide and drug. At present, radionuclide holds the maximum share of the next generation drug conjugates market. It is worth highlighting that the next generation drug conjugates for si-RNA is likely to grow at a relatively higher CAGR.
Combination Therapies are Likely to Dominate the Next Generation Drug Conjugates Market During the Forecast Period
Based on the type of therapy, the market is segmented into monotherapy and combination therapy. Currently, combination therapy holds the maximum share of the next generation drug conjugates market. This trend is unlikely to change in the coming decades.
Intravenous Route Occupies the Largest Share of the Next Generation Drug Conjugates Market
Based on the route of administration, the market is segmented into intravenous and subcutaneous. The intravenous mode of drug delivery captures the highest share of the current next generation drug conjugates market. However, the next generation drug conjugates market for subcutaneous route is likely to grow at a relatively higher CAGR in the coming decade.
The Hemophilia Segment is the Fastest Growing Segment of the Next Generation Drug Conjugates Market During the Forecast Period
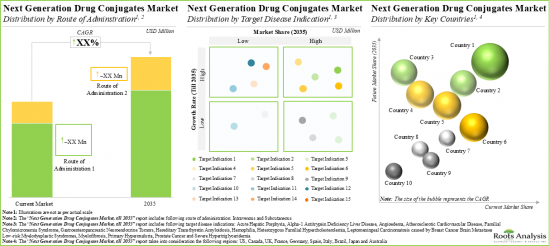
Based on the key target disease indication, the market is segmented into gastroenteropancreatic neuroendocrine tumors, prostate cancer, leptomeningeal carcinomatosis caused by breast cancer brain metastases, hereditary transthyretin amyloidosis, atherosclerotic cardiovascular diseases, severe hypertriglyceridemia, hereditary angioedema, acute hepatic porphyria, primary hyperoxaluria, heterozygous familial hypercholesterolemia, hemophilia, low-risk myelodysplastic syndrome, myelofibrosis, alpha-1 antitrypsin deficiency liver disease and familial chylomicronemia syndrome. It is worth highlighting that, at present, prostate cancer holds a higher share of the next generation drug conjugates market. However, the next generation drug conjugates market for hemophilia is likely to grow at a relatively higher CAGR.
North America Accounts for the Largest Share of the Market
Based on key geographical regions, the market is segmented into North America, Europe, and Asia-Pacific and the Rest of the World. The majority share is expected to be captured by players based in North America. It is worth highlighting that, over the years, the market in Asia-Pacific and the Rest of the World is expected to grow at a higher CAGR.
Example Players in the Next Generation Drug Conjugates Market
- Advanced Accelerator Applications
- Alnylam Pharmaceuticals
- Arrowhead Pharmaceuticals
- Dicerna Pharmaceuticals
- Geron Corporation
- Ionis Pharmaceuticals
NEXT GENERATION DRUG CONJUGATES MARKET: RESEARCH COVERAGE
- Market Sizing and Opportunity Analysis: The report features an in-depth analysis of the next generation drug conjugates market, focusing on key market segments, including [A] type of targeting ligand, [B] type of payload, [C] type of therapy, [D] route of administration, [E] target disease indication and [F] key geographical regions.
- Market Landscape: A comprehensive evaluation of next generation drug conjugates / next generation targeted therapeutics that are either approved or being evaluated in different stages of development, considering various parameters, such as [A] type of conjugate, [B] type of targeting ligand, [C] type of payload, [D] type of biological target, [E] mechanism of action, [F] stage of development, [G] phase of development, [H] type of therapy, [I] route of administration, [J] target disease indication, [K] therapeutic area and [L] target population. Further, the chapter includes information on various next generation drug conjugate developers, based on their [M] year of establishment, [N] company size, [O] location of headquarters and [P] most active players (in terms of number of drug candidates).
- Company Profiles: In-depth profiles of key industry players involved in the development of next generation drug conjugates, focusing on [A] company overviews, [B] product portfolio, [C] detailed information on the drug candidates which are either approved or are in phase III of clinical development, [D] recent developments and [E] an informed future outlook.
- Clinical Trials: Examination of completed, ongoing, and planned clinical studies of various drug conjugates based on parameters like [A] trial registration year, [B] trial phase, [C] trial status, [D] enrolled patient population, [E] type of sponsor, [F] age group, [G] most active industry players, [H] leading drug candidate, [I] primary purpose, [J] therapeutic area and [K] key geographical regions.
- Partnerships and Collaborations: An analysis of partnerships established in this sector, since 2018, covering acquisitions, research and development agreements, product development and commercialization agreements, platform / technology licensing agreement, service agreements, clinical trial agreements, joint ventures and others.
- Academic Grant Analysis: A comprehensive evaluation of various grants that have been awarded to research institutes engaged in conducting research related to next generation drug conjugates, since 2018, based on various important parameters, such as [A] year of grant award, [B] amount awarded, [C] funding institute center, [D] support period, [E] type of grant application, [F] purpose of grant award, [G] activity code, [H] study section involved, [I] popular NIH departments (based on number of grants awarded), [J] prominent program officers, [K] leading recipient organizations and [L] key regions.
- Publication Analysis: An in-depth analysis of scientific articles focused on next generation drug conjugates based on [A] year of publication, [B] type of publication, [C] type of conjugate, [D] target indication, [C] copyright holders, [D] focus area, [E] leading publishers and [F] key journals (in terms of number of articles published and impact factor).
- Drug Failure Analysis: An in-depth analysis of next generation drug conjugates that failed to progress to later stages of development, based on various relevant parameters, such as trial status of discontinuation, trial phase of discontinuation, average trial year, type of therapy, target indication and reason for drug failure.
- Success Protocol Analysis: An insightful success protocol analysis of recently approved and commercialized next generation drug conjugates, based on several relevant parameters, such as dosing frequency, drug efficacy, drug exclusivity, drug designation, fatality rate, geographical reach, intra-class competition, line of treatment, prevalence, price, type of therapy, and existing competition among developers.
KEY QUESTIONS ANSWERED IN THIS REPORT
- How many companies are currently engaged in this market?
- Which are the leading companies in this market?
- What kind of partnership models are commonly adopted by industry stakeholders?
- What factors are likely to influence the evolution of this market?
- What is the current and future market size?
- What is the CAGR of this market?
- How is the current and future market opportunity likely to be distributed across key market segments?
REASONS TO BUY THIS REPORT
- The report provides a comprehensive market analysis, offering detailed revenue projections of the overall market and its specific sub-segments. This information is valuable to both established market leaders and emerging entrants.
- Stakeholders can leverage the report to gain a deeper understanding of the competitive dynamics within the market. By analyzing the competitive landscape, businesses can make informed decisions to optimize their market positioning and develop effective go-to-market strategies.
- The report offers stakeholders a comprehensive overview of the market, including key drivers, barriers, opportunities, and challenges. This information empowers stakeholders to stay abreast of market trends and make data-driven decisions to capitalize on growth prospects.
ADDITIONAL BENEFITS
- Complimentary PPT Insights Packs
- Complimentary Excel Data Packs for all Analytical Modules in the Report
- 10% Free Content Customization
- Detailed Report Walkthrough Session with Research Team
- Free Updated report if the report is 6-12 months old or older
TABLE OF CONTENTS
1. PREFACE
- 1.1. Next Generation Drug Conjugates Market Overview
- 1.2. Key Market Insights
- 1.3. Scope of the Report
- 1.4. Research Methodology
- 1.5. Frequently Asked Questions
- 1.6. Chapter Outlines
2. EXECUTIVE SUMMARY
3. INTRODUCTION
- 3.1. Overview of Next Generation Drug Conjugates
- 3.2. Key Historical Events
- 3.3. Structure of Next Generation Drug Conjugates
- 3.4. Biochemical Interaction and Mechanism of Action
- 3.5.Key Target Indications
- 3.6. Advantages of Next Generation Drug Conjugates
- 3.7 Challenges associated with Next Generation Drug Conjugates
- 3.8. Future Perspectives
4. MARKET LANDSCAPE
- 4.1. Methodology
- 4.2. Next Generation Drug Conjugates: List of Therapies
- 4.2.1. Analysis by Type of Conjugate
- 4.2.2. Analysis by Type of Targeting Ligand
- 4.2.3. Analysis by Type of Payload
- 4.2.4. Analysis by Biological Target
- 4.2.5. Analysis by Mechanism of Action
- 4.2.6. Analysis by Stage of Development
- 4.2.7. Analysis by Phase of Development
- 4.2.8. Analysis by Type of Therapy
- 4.2.9. Analysis by Route of Administration
- 4.2.10. Analysis by Target Disease Indication
- 4.2.11. Analysis by Therapeutic Area
- 4.2.12. Analysis by Type of Conjugate and Stage of Development
- 4.2.13. Analysis by Type of Conjugate and Target Population
- 4.3. Next Generation Drug Conjugates: Developer Landscape
- 4.3.1. Analysis by Year of Establishment
- 4.3.2. Analysis by Company Size
- 4.3.3. Analysis by Location of Headquarters (Region-wise)
- 4.3.4. Analysis by Location of Headquarters (Country-wise)
- 4.3.5.Analysis by Year of Establishment, Company Size and Location of Headquarters (Region-wise)
- 4.3.6. Most Active Players: Analysis by Number of Drug Candidates
5. COMPANY AND DRUG PROFILES
- 5.1. Advanced Accelerator Applications
- 5.1.1. Company Overview
- 5.1.2. Management Team
- 5.1.3. Product Portfolio
- 5.1.3.1. Lutathera(R)
- 5.1.3.1.1. Drug Overview
- 5.1.3.1.2. Clinical Trial Information
- 5.1.3.1.3. Clinical Trial Results
- 5.1.3.1.4. Dosing Regimen
- 5.1.3.2. Pluvicto(R)
- 5.1.3.2.1. Drug Overview
- 5.1.3.2.2. Clinical Trial Information
- 5.1.3.2.3. Clinical Trial Results
- 5.1.3.2.4. Dosing Regimen
- 5.1.3.1. Lutathera(R)
- 5.1.4. Recent Developments and Future Outlook
- 5.2. Alnylam Pharmaceuticals
- 5.2.1. Company Overview
- 5.2.2. Management Team
- 5.2.3. Product Portfolio
- 5.2.3.1. Givlaari(R)
- 5.2.3.1.1. Drug Overview
- 5.2.3.1.2. Clinical Trial Information
- 5.2.3.1.3. Clinical Trial Results
- 5.2.3.1.4. Dosing Regimen
- 5.2.3.2. Oxlumo(R)
- 5.2.3.2.1. Drug Overview
- 5.2.3.2.2. Clinical Trial Information
- 5.2.3.2.3. Clinical Trial Results
- 5.2.3.2.4. Dosing Regimen
- 5.2.3.3. Leqvio(R)
- 5.2.3.3.1. Drug Overview
- 5.2.3.3.2. Clinical Trial Information
- 5.2.3.3.3. Clinical Trial Results
- 5.2.3.3.4. Dosing Regimen
- 5.2.3.4. Amvuttra(R)
- 5.2.3.4.1. Drug Overview
- 5.2.3.4.2. Clinical Trial Information
- 5.2.3.4.3. Clinical Trial Results
- 5.2.3.4.4. Dosing Regimen
- 5.2.3.1. Givlaari(R)
- 5.2.4. Recent Developments and Future Outlook
- 5.3. Arrowhead Pharmaceuticals
- 5.3.1. Company Overview
- 5.3.2. Management Team
- 5.3.3. Product Portfolio
- 5.3.3.1. Olpasiran
- 5.3.3.1.1. Drug Overview
- 5.3.3.1.2. Clinical Trial Information
- 5.3.3.1.3. Clinical Trial Results
- 5.3.3.1.4. Dosing Regimen
- 5.3.3.2. ARO-AAT
- 5.3.3.2.1. Drug Overview
- 5.3.3.2.2. Clinical Trial Information
- 5.3.3.2.3. Clinical Trial Results
- 5.3.3.2.4. Dosing Regimen
- 5.3.3.3. ARO-APOC3
- 5.3.3.3.1. Drug Overview
- 5.3.3.3.2. Clinical Trial Information
- 5.3.3.3.3. Clinical Trial Results
- 5.3.3.3.4. Dosing Regimen
- 5.3.3.1. Olpasiran
- 5.3.4. Recent Developments and Future Outlook
- 5.4. Dicerna Pharmaceuticals
- 5.4.1. Company Overview
- 5.4.2. Management Team
- 5.4.3. Product Portfolio
- 5.4.3.1. Nedosiran
- 5.4.3.1.1. Drug Overview
- 5.4.3.1.2. Clinical Trial Information
- 5.4.3.1.3. Clinical Trial Results
- 5.4.3.1.4. Dosing Regimen
- 5.4.3.1. Nedosiran
- 5.4.4. Recent Developments and Future Outlook
- 5.5. Geron
- 5.5.1. Company Overview
- 5.5.2. Management Team
- 5.5.3. Product Portfolio
- 5.5.3.1. Imtelstat
- 5.5.3.1.1. Drug Overview
- 5.5.3.1.2. Clinical Trial Information
- 5.5.3.1.3. Clinical Trial Results
- 5.5.3.1.4. Dosing Regimen
- 5.5.3.1. Imtelstat
- 5.5.4. Recent Developments and Future Outlook
- 5.6. Ionis Pharmaceuticals
- 5.6.1. Company Overview
- 5.6.2. Management Team
- 5.6.3. Product Portfolio
- 5.6.3.1. Eplontersen
- 5.6.3.1.1. Drug Overview
- 5.6.3.1.2. Clinical Trial Information
- 5.6.3.1.3. Clinical Trial Results
- 5.6.3.1.4. Dosing Regimen
- 5.6.3.2. Olezarsen
- 5.6.3.2.1. Drug Overview
- 5.6.3.2.2. Clinical Trial Information
- 5.6.3.2.3. Clinical Trial Results
- 5.6.3.2.4. Dosing Regimen
- 5.6.3.3. Pelacarsen
- 5.6.3.3.1. Drug Overview
- 5.6.3.3.2. Clinical Trial Information
- 5.6.3.3.3. Clinical Trial Results
- 5.6.3.3.4. Dosing Regimen
- 5.6.3.3.5. Estimated Sales
- 5.6.3.4. Donidalorsen
- 5.6.3.4.1. Drug Overview
- 5.6.3.4.2. Clinical Trial Information
- 5.6.3.4.3. Clinical Trial Results
- 5.6.3.4.4. Dosing Regimen
- 5.6.3.1. Eplontersen
- 5.6.4. Recent Developments and Future Outlook
6. CLINICAL TRIAL ANALYSIS
- 6.1. Analysis Methodology and Key Parameters
- 6.2. Next Generation Drug Conjugates: Clinical Trial Analysis
- 6.2.1. Analysis by Trial Registration Year
- 6.2.2. Analysis by Trial Phase
- 6.2.3. Analysis by Trial Status
- 6.2.4. Analysis by Therapeutic Area
- 6.2.5. Analysis by Primary Purpose
- 6.2.6. Analysis by Age Group
- 6.2.7. Analysis by Type of Sponsor
- 6.2.8. Most Active Industry Players: Analysis by Number of Trials
- 6.2.9. Leading Drug Candidates: Analysis by Number of Trials
- 6.2.10. Analysis by Trial Registration Year and Trial Location
- 6.2.11. Analysis by Trial Registration Year and Enrolled Patient Population
- 6.2.12. Analysis by Trial Phase and Enrolled Patient Population
- 6.2.13. Analysis by Trial Status and Trial Registration Year
- 6.2.14. Analysis by Trial Location and Enrolled Patient Population
- 6.2.15. Analysis by Trial Status and Trial Location
7. PARTNERSHIPS AND COLLABORATIONS
- 7.1. Partnership Models
- 7.2. Next Generation Drug Conjugates: Partnerships and Collaborations
- 7.2.1. Analysis by Year of Partnership
- 7.2.2. Analysis by Type of Partnership
- 7.2.3. Analysis by Year and Type of Partnership
- 7.2.4. Analysis by Type of Partner
- 7.2.5. Analysis by Year of Partnership and Type of Partner
- 7.2.6. Analysis by Type of Partnership and Type of Partner
- 7.2.7. Analysis by Type of Partner and Parent Company Size
- 7.2.8. Analysis by Therapeutic Area
- 7.2.9. Most Active Players: Analysis by Number of Partnerships
- 7.2.10. Analysis by Geography
- 7.2.10.1. Analysis by Type of Geography (Region-wise)
- 7.2.10.2. Analysis by Type of Geography (Country-wise)
- 7.2.10.3. Intercontinental and Intracontinental Agreements
8. ACADEMIC GRANTS ANALYSIS
- 8.1. Methodology and Key Parameters
- 8.2. Next Generation Drug Conjugates: Academic Grants Analysis
- 8.2.1. Analysis by Year of Grant Award
- 8.2.2. Analysis by Amount Awarded
- 8.2.3. Analysis by Funding Institute Center
- 8.2.4. Analysis by Support Period
- 8.2.5. Analysis by Funding Institute Center and Support Period
- 8.2.6. Analysis by Type of Grant Application
- 8.2.7. Analysis by Purpose of Grant
- 8.2.8. Analysis by Activity Code
- 8.2.9. Analysis by Study Section
- 8.2.10. Popular NIH Departments: Analysis by Number of Grants
- 8.2.11. Analysis by Type of Recipient Organization
- 8.2.11.1. Popular Recipient Organizations: Analysis by Number of Grants
- 8.2.11.2. Popular Recipient Organizations: Analysis by Amount Awarded
- 8.2.12. Prominent Program Officers: Analysis by Number of Grants
- 8.2.13. Analysis by Location of Recipient Organizations
9. PUBLICATION ANALYSIS
- 9.1. Analysis Methodology and Key Parameters
- 9.2. Next Generation Drug Conjugates: Publication Analysis
- 9.2.1. Analysis by Year of Publication
- 9.2.2. Analysis by Type of Publication
- 9.2.3. Analysis by Type of Conjugate
- 9.2.4. Analysis by Target Indication
- 9.2.5. Analysis by Copyright Holder
- 9.2.6. Word Cloud: Emerging Focus Area
- 9.2.7. Most Active Publishers: Analysis by Number of Publications
- 9.2.8. Key Journals: Analysis by Number of Publications
- 9.2.9. Key Journals: Analysis by Impact Factor
10. DRUG FAILURE ANALYSIS
- 10.1. Analysis Methodology and Key Parameters
- 10.2. Next Generation Drug Conjugates: Drug Failure Analysis
- 10.2.1. Analysis by Status of Discontinuation
- 10.2.2. Analysis by Phase of Discontinuation
- 10.2.3. Analysis by Average Trial Year
- 10.2.4. Analysis by Type of Therapy
- 10.2.5. Analysis by Target Indication
- 10.2.6. Analysis by Reason for Drug Failure
11. SUCCESS PROTOCOL ANALYSIS
- 11.1. Methodology and Key Parameters
- 11.2. Key Assumptions and Scoring Criteria
- 11.3. Success Protocol Analysis
- 11.4. Assessment of Approved Next Generation Drug Conjugates: Harvey Ball Analysis
12. MARKET FORECAST AND OPPORTUNITY ANALYSIS
- 12.1. Key Assumptions and Forecast Methodology
- 12.2. Next Generation Drug Conjugates Market, till 2035
- 12.2.1. Next Generation Drug Conjugates Market: Distribution by Type of Conjugate, Current Year and 2035
- 12.2.1.1. Next Generation Drug Conjugates Market for Peptide Radionuclide Conjugates, till 2035
- 12.2.1.2. Next Generation Drug Conjugates Market for Ligand Conjugated Anti Sense Medicine, till 2035
- 12.2.1.3. Next Generation Drug Conjugates Market for Ligand Mediated RNAi Conjugates, till 2035
- 12.2.1.4. Next Generation Drug Conjugates Market for Peptide Drug Conjugates, till 2035
- 12.2.2. Next Generation Drug Conjugates Market: Distribution by Targeting Ligand
- 12.2.2.1. Next Generation Drug Conjugates Market for Amino Sugars, till 2035
- 12.2.2.2. Next Generation Drug Conjugates Market for Peptides, till 2035
- 12.2.2.3. Next Generation Drug Conjugates Market for Lipids, till 2035
- 12.2.3. Next Generation Drug Conjugates Market: Distribution by Payload
- 12.2.3.1. Next Generation Drug Conjugates Market for Radionuclides, till 2035
- 12.2.3.2. Next Generation Drug Conjugates Market for Drugs, till 2035
- 12.2.3.3. Next Generation Drug Conjugates Market for Antisense Oligonucleotides, till 2035
- 12.2.3.4. Next Generation Drug Conjugates Market for si-RNAs, till 2035
- 12.2.4. Next Generation Drug Conjugates Market: Distribution by Therapy
- 12.2.4.1. Next Generation Drug Conjugates Market for Monotherapy, till 2035
- 12.2.4.2. Next Generation Drug Conjugates Market for Combination Therapy, till 2035
- 12.2.5. Next Generation Drug Conjugates Market: Distribution by Route of Administration
- 12.2.5.1. Next Generation Intravenous Drug Conjugates Market, till 2035
- 12.2.5.2. Next Generation Subcutaneous Drug Conjugates Market, till 2035
- 12.2.6. Next Generation Drug Conjugates Market: Distribution by Target Disease Indication, Current Year and 2035
- 12.2.6.1. Next Generation Drug Conjugates Market for Gastroenteropancreatic Neuroendocrine Tumors, till 2035
- 12.2.6.2. Next Generation Drug Conjugates Market for Prostate Cancer, till 2035
- 12.2.6.3. Next Generation Drug Conjugates Market for Acute Hepatic Porphyria, till 2035
- 12.2.6.4. Next Generation Drug Conjugates Market for Heterozygous Familial Hypercholesterolemia, till 2035
- 12.2.6.5. Next Generation Drug Conjugates Market for Hereditary Transthyretin Amyloidosis, till 2035
- 12.2.6.6. Next Generation Drug Conjugates Market for Primary Hyperoxaluria, till 2035
- 12.2.6.7. Next Generation Drug Conjugates Market for Leptomeningeal Carcinomatosis, till 2035
- 12.2.6.8. Next Generation Drug Conjugates Market for Atherosclerotic Cardiovascular Diseases, till 2035
- 12.2.6.9. Next Generation Drug Conjugates Market for Severe Hypertriglyceridemia, till 2035
- 12.2.6.10. Next Generation Drug Conjugates Market for Hereditary Angioedema, till 2035
- 12.2.6.11. Next Generation Drug Conjugates Market for Hemophilia, till 2035
- 12.2.6.12. Next Generation Drug Conjugates Market for Low-Risk Myelodysplastic Syndrome, till 2035
- 12.2.6.13. Next Generation Drug Conjugates Market for Myelofibrosis, till 2035
- 12.2.6.14. Next Generation Drug Conjugates Market for Alpha-1 Antitrypsin Deficiency Liver Disease, till 2035
- 12.2.6.15. Next Generation Drug Conjugates Market for Familial Chylomicronemia Syndrome, till 2035
- 12.2.6.16. Next Generation Drug Conjugates Market for Cardiovascular Diseases due to HLP, till 2035
- 12.2.7. Next Generation Drug Conjugates Market: Distribution by Key Geographical Regions, Current Year and 2035
- 12.2.7.1. Next Generation Drug Conjugates Market in North America, till 2035
- 12.2.7.1.1. Next Generation Drug Conjugates Market in the US, till 2035
- 12.2.7.1.2. Next Generation Drug Conjugates Market in Canada, till 2035
- 12.2.7.2. Next Generation Drug Conjugates Market in Europe, till 2035
- 12.2.7.2.1. Next Generation Drug Conjugates Market in France, till 2035
- 12.2.7.2.2. Next Generation Drug Conjugates Market in the UK, till 2035
- 12.2.7.2.3. Next Generation Drug Conjugates Market in Germany, till 2035
- 12.2.7.2.4. Next Generation Drug Conjugates Market in Italy, till 2035
- 12.2.7.2.5. Next Generation Drug Conjugates Market in Spain, till 2035
- 12.2.7.2.6. Next Generation Drug Conjugates Market in Rest of the Europe, till 2035
- 12.2.7.3. Next Generation Drug Conjugates Market in Asia-Pacific, till 2035
- 12.2.7.3.1. Next Generation Drug Conjugates Market in Japan, till 2035
- 12.2.7.3.2. Next Generation Drug Conjugates Market in Australia, till 2035
- 12.2.7.3.3. Next Generation Drug Conjugates Market in Brazil, till 2035
- 12.2.7.4. Next Generation Drug Conjugates Market in Rest of the World, till 2035
- 12.2.7.1. Next Generation Drug Conjugates Market in North America, till 2035
- 12.2.1. Next Generation Drug Conjugates Market: Distribution by Type of Conjugate, Current Year and 2035
- 12.3. Next Generation Drug Conjugates Market: Product-wise Sales Forecast, till 2035
- 12.3.1. Lutathera(R)
- 12.3.1.1. Sales Forecast (USD Million)
- 12.3.2. Pluvicto(R)
- 12.3.2.1. Sales Forecast (USD Million)
- 12.3.3. Givlaari(R)
- 12.3.3.1. Sales Forecast (USD Million)
- 12.3.4. Oxlumo(R)
- 12.3.4.1. Sales Forecast (USD Million)
- 12.3.5. Leqvio(R)
- 12.3.5.1. Sales Forecast (USD Million)
- 12.3.6. Amvuttra(R)
- 12.3.6.1. Sales Forecast (USD Million)
- 12.3.7. Eplontersen
- 12.3.7.1. Sales Forecast (USD Million)
- 12.3.8. Olezarsen
- 12.3.8.1. Sales Forecast (USD Million)
- 12.3.9. Pelacarsen
- 12.3.9.1. Sales Forecast (USD Million)
- 12.3.10. Donidalorsen
- 12.3.10.1. Sales Forecast (USD Million)
- 12.3.11. Fitusiran
- 12.3.11.1. Sales Forecast (USD Million)
- 12.3.12. Nedosiran
- 12.3.12.1. Sales Forecast (USD Million)
- 12.3.13. Imetlestat
- 12.3.13.1. Sales Forecast (USD Million)
- 12.3.14. Olpasiran
- 12.3.14.1. Sales Forecast (USD Million)
- 12.3.15. ARO-AAT
- 12.3.15.1. Sales Forecast (USD Million)
- 12.3.16. ARO-APOC3
- 12.3.16.1. Sales Forecast (USD Million)
- 12.3.17. ANG-1005
- 12.3.17.1. Sales Forecast (USD Million)
- 12.3.1. Lutathera(R)
13. APPENDIX 1: TABULATED DATA
14. APPENDIX 2: LIST OF COMPANIES AND ORGANIZATIONS
List of Tables
- Table 4.1. Next Generation Drug Conjugates: Therapy Pipeline
- Table 4.2. Next Generation Drug Conjugates: List of Developers
- Table 5.1. Advance Accelerator Applications: Product Portfolio
- Table 5.2. Lutathera(R): Drug Overview
- Table 5.3. Lutathera(R): Clinical Trial Information
- Table 5.4 Lutathera(R): Dosing Regimen
- Table 5.5 Pluvicto(R): Drug Overview
- Table 5.6 Pluvicto(R): Clinical Trial Information
- Table 5.7 Pluvicto(R): Dosing Regimen
- Table 5.8 Advance Accelerator Applications: Recent Developments and Future Outlook
- Table 5.9. Alnylam Pharmaceuticals: Product Portfolio
- Table 5.10. Givlaari(R): Drug Overview
- Table 5.11. Givlaari(R): Clinical Trial Information
- Table 5.12 Givlaari(R): Dosing Regimen
- Table 5.13. Oxlumo(R): Drug Overview
- Table 5.14. Oxlumo(R): Clinical Trial Information
- Table 5.15 Oxlumo(R): Dosing Regimen
- Table 5.16. Leqvio(R): Drug Overview
- Table 5.17. Leqvio(R): Clinical Trial Information
- Table 5.18. Leqvio(R): Dosing Regimen
- Table 5.19. Amvuttra(R): Drug Overview
- Table 5.20. Amvuttra(R): Clinical Trial Information
- Table 5.21. Amvuttra(R): Dosing Regimen
- Table 5.22. Alnylam Pharmaceuticals: Recent Developments and Future Outlook
- Table 5.23. Arrowhead Pharmaceuticals: Product Portfolio
- Table 5.24. Olapsiran: Drug Overview
- Table 5.25. Olpasiran: Clinical Trial Information
- Table 5.26 Olapsiran: Dosing Regimen
- Table 5.27. ARO-AAT: Drug Overview
- Table 5.28. ARO-AAT: Clinical Trial Information
- Table 5.29 ARO-AAT: Dosing Regimen
- Table 5.30. ARO-APOC3: Drug Overview
- Table 5.31. ARO-APOC3: Clinical Trial Information
- Table 5.32 ARO-APOC3: Dosing Regimen
- Table 5.33. Arrowhead Pharmaceuticals: Recent Developments and Future Outlook
- Table 5.34. Dicerna Pharmaceuticals: Product Portfolio
- Table 5.35. Nedosiran: Drug Overview
- Table 5.36. Nedosiran: Clinical Trial Information
- Table 5.37 Nedosiran: Dosing Regimen
- Table 5.38. Dicerna Pharmaceuticals: Recent Developments and Future Outlook
- Table 5.39. Geron: Product Portfolio
- Table 5.40. Imtelstat: Drug Overview
- Table 5.41. Imtelstat: Clinical Trial Information
- Table 5.42 Imtelstat: Dosing Regimen
- Table 5.43. Geron: Recent Developments and Future Outlook
- Table 5.44. Ionis Pharmaceuticals: Product Portfolio
- Table 5.45. Eplontersen (Transthyretin-Mediated Amyloidosis - Polyneuropathy): Drug Overview
- Table 5.46. Eplontersen (Transthyretin-Mediated Amyloidosis - Polyneuropathy): Clinical Trial Information
- Table 5.47 Eplontersen (Transthyretin-Mediated Amyloidosis - Polyneuropathy): Dosing Regimen
- Table 5.48. Eplontersen (Transthyretin-Mediated Amyloidosis - Cardiomyopathy): Drug Overview
- Table 5.49. Eplontersen (Transthyretin-Mediated Amyloidosis - Cardiomyopathy): Clinical Trial Information
- Table 5.50. Eplontersen (Transthyretin-Mediated Amyloidosis - Cardiomyopathy): Dosing Regimen
- Table 5.51. Olezarsen: Drug Overview
- Table 5.52. Olezarsen: Clinical Trial Information
- Table 5.53. Olezarsen: Dosing Regimen
- Table 5.54. Pelacarsen: Drug Overview
- Table 5.55. Pelacarsen: Clinical Trial Information
- Table 5.56. Pelacarsen: Dosing Regimen
- Table 5.57. Donidalorsen: Drug Overview
- Table 5.58. Donidalorsen: Clinical Trial Information
- Table 5.59. Donidalorsen: Dosing Regimen
- Table 5.60. Ionis Pharmaceuticals: Recent Developments and Future Outlook
- Table 6.1. Next Generation Drug Conjugates: List of Clinical Trials (Sample Data, Pre-2017-2023)
- Table 7.1. Next Generation Drug Conjugates: List of Partnerships and Collaborations (2018-2023)
- Table 8.1. Next Generation Drug Conjugates: List of Academic Grants (Sample Data, Pre-2021-2023)
- Table 9.1. Next Generation Drug Conjugates: List of Publications (Sample Data, 2018-2023)
- Table 10.1. Next Generation Drug Conjugates: List of Failed Drugs
- Table 12.1. Next Generation Drug Conjugates Market: List of Forecasted Drugs
- Table 13.1 Next Generation Drug Conjugates: Distribution by Type of Conjugate
- Table 13.2. Next Generation Drug Conjugates: Distribution by Type of Targeting Ligand
- Table 13.3. Next Generation Drug Conjugates: Distribution by Type of Payload
- Table 13.4. Next Generation Drug Conjugates: Distribution by Biological Target
- Table 13.5. Next Generation Drug Conjugates: Distribution by Mechanism of Action
- Table 13.6. Next Generation Drug Conjugates: Distribution by Stage of Development
- Table 13.7. Next Generation Drug Conjugates: Distribution by Phase of Development
- Table 13.8. Next Generation Drug Conjugates: Distribution by Type of Therapy
- Table 13.9. Next Generation Drug Conjugates: Distribution by Route of Administration
- Table 13.10. Next Generation Drug Conjugates: Distribution by Target Disease Indication
- Table 13.11. Next Generation Drug Conjugates: Distribution by Therapeutic Area
- Table 13.12. Next Generation Drug Conjugates: Distribution by Type of Conjugate and Stage of Development
- Table 13.13. Next Generation Drug Conjugates: Distribution by Type of Conjugate and Target Population
- Table 13.14. Next Generation Drug Conjugate Developers: Distribution by Year of Establishment
- Table 13.15. Next Generation Drug Conjugate Developers: Distribution by Company Size
- Table 13.16. Next Generation Drug Conjugate Developers: Distribution by Location of Headquarters (Region-wise)
- Table 13.17. Next Generation Drug Conjugate Developers: Distribution by Location of Headquarters (Country-wise)
- Table 13.18. Next Generation Drug Conjugate Developers: Distribution by Year of Establishment, Company Size and Location of Headquarters (Region-wise)
- Table 13.19. Most Active Players: Distribution by Number of Drug Candidates
- Table 13.20. Clinical Trial Analysis: Distribution by Trial Registration Year
- Table 13.21. Clinical Trial Analysis: Distribution by Trial Phase
- Table 13.22. Clinical Trial Analysis: Distribution by Trial Status
- Table 13.23. Clinical Trial Analysis: Distribution by Therapeutic Area
- Table 13.24. Clinical Trial Analysis: Distribution by Primary Purpose
- Table 13.25. Clinical Trial Analysis: Distribution by Patient Age Group
- Table 13.26. Clinical Trial Analysis: Distribution by Type of Sponsor
- Table 13.27. Most Active Industry Players: Distribution by Number of Trials
- Table 13.28. Leading Drug Candidates: Distribution by Number of Trials
- Table 13.29. Clinical Trial Analysis: Distribution by Trial Registration Year and Trial Location
- Table 13.30. Clinical Trial Analysis: Distribution by Trial Registration Year and Enrolled Patient Population
- Table 13.31. Clinical Trial Analysis: Distribution by Trial Phase and Enrolled Patient Population
- Table 13.32. Clinical Trial Analysis: Distribution by Trial Status and Trial Registration Year
- Table 13.33. Clinical Trial Analysis: Distribution by Trial Location and Enrolled Patient Population
- Table 13.34. Clinical Trial Analysis: Distribution by Trial Phase and Trial Location
- Table 13.35. Partnerships and Collaborations: Distribution by Year of Partnership
- Table 13.36. Partnerships and Collaborations: Distribution by Type of Partnership
- Table 13.37. Partnerships and Collaborations: Distribution by Year and Type of Partnership
- Table 13.38. Partnerships and Collaborations: Distribution by Type of Partner
- Table 13.39. Partnerships and Collaborations: Distribution by Year of Partnership and Type of Partner
- Table 13.40. Partnerships and Collaborations: Distribution by Type of Partnership and Type of Partner
- Table 13.41. Partnerships and Collaborations: Distribution by Parent Company Size and Type of Partner
- Table 13.42. Partnerships and Collaborations: Distribution by Therapeutic Area
- Table 13.43. Most Active Players: Analysis by Number of Partnerships
- Table 13.44. Partnerships and Collaborations: Distribution by Type of Geography
(Region-wise)
- Table 13.45. Partnerships and Collaborations: Distribution by Type of Geography
(Country-wise)
- Table 13.46. Partnerships and Collaborations: Intercontinental and Intracontinental Agreements
- Table 13.47. Academic Grants Analysis: Distribution by Year of Grant Award
- Table 13.48. Academic Grants Analysis: Distribution by Amount Awarded
- Table 13.49 Academic Grants Analysis: Distribution by Funding Institute Center
- Table 13.50. Academic Grants Analysis: Distribution by Support Period
- Table 13.51. Academic Grants Analysis: Distribution by Funding Institute Center and Support Period
- Table 13.52. Academic Grants Analysis: Distribution by Type of Grant Application
- Table 13.53. Academic Grants Analysis: Distribution by Purpose of Grant
- Table 13.54. Academic Grants Analysis: Distribution by Activity Code
- Table 13.55. Academic Grants Analysis: Distribution by Study Section
- Table 13.56 Popular NIH Departments: Distribution by Number of Grants
- Table 13.57 Academic Grant Analysis: Distribution by Type of Recipient Organization
- Table 13.58. Popular Recipient Organizations: Distribution by Number of Grants
- Table 13.59. Popular Recipient Organizations: Distribution by Amount Awarded
- Table 13.60 Prominent Program Officers: Analysis by Number of Grants
- Table 13.61. Academic Grants Analysis: Distribution by Location of Recipient Organizations
- Table 13.62. Publication Analysis: Distribution by Year of Publication
- Table 13.63. Publication Analysis: Distribution by Type of Publication
- Table 13.64. Publication Analysis: Distribution by Type of Conjugate
- Table 13.65. Publication Analysis: Distribution by Target Indication
- Table 13.66. Publication Analysis: Distribution by Copyright Holder
- Table 13.67. Word Cloud: Emerging Focus Area
- Table 13.68. Most Active Publishers: Distribution by Number of Publications
- Table 13.69. Key Journals: Distribution by Number of Publications
- Table 13.70. Key Journals: Distribution by Impact Factor
- Table 13.71. Drug Failure Analysis: Distribution by Status of Discontinuation
- Table 13.72. Drug Failure Analysis: Distribution by Phase of Discontinuation
- Table 13.73. Drug Failure Analysis: Distribution by Average Trial Year
- Table 13.74. Drug Failure Analysis: Distribution by Type of Therapy
- Table 13.75. Drug Failure Analysis: Distribution by Target Indication
- Table 13.76 Drug Failure Analysis: Distribution by Reason of Drug Failure
- Table 13.77. Global Next Generation Drug Conjugates Market, Conservative, Base and Optimistic Scenarios, till 2035 (USD Million)
- Table 13.78. Next Generation Drug Conjugates Market for Peptide Radionuclide Conjugates, Conservative, Base and Optimistic Scenarios, till 2035 (USD Million)
- Table 13.79. Next Generation Drug Conjugates Market for Ligand Conjugated Anti Sense Medicines, Conservative, Base and Optimistic Scenarios, till 2035 (USD Million)
- Table 13.80. Next Generation Drug Conjugates: Distribution for Ligand mediated RNAi Conjugates, Conservative, Base and Optimistic Scenarios, till 2035 (USD Million)
- Table 13.81. Next Generation Drug Conjugates Market for by Peptide Drug Conjugates, Conservative, Base and Optimistic Scenarios, till 2035 (USD Million)
- Table 13.82. Next Generation Drug Conjugates Market: Distribution for Amino Sugars, Conservative, Base and Optimistic Scenarios, till 2035 (USD Million)
- Table 13.83. Next Generation Drug Conjugates Market for Peptides, Conservative, Base and Optimistic Scenarios, till 2035 (USD Million)
- Table 13.84. Next Generation Drug Conjugates Market for Lipids, Conservative, Base and Optimistic Scenarios, till 2035 (USD Million)
- Table 13.85. Next Generation Drug Conjugates Market for Radionuclides, Conservative, Base and Optimistic Scenarios, till 2035 (USD Million)
- Table 13.86. Next Generation Drug Conjugates Market for Drugs, Conservative, Base and Optimistic Scenarios, till 2035 (USD Million)
- Table 13.87. Next Generation Drug Conjugates Market for Antisense Oligonucleotides, Conservative, Base and Optimistic Scenarios, till 2035 (USD Million)
- Table 13.88. Next Generation Drug Conjugates Market for si-RNAs, Conservative, Base and Optimistic Scenarios, till 2035 (USD Million)
- Table 13.89. Next Generation Drug Conjugates Market for Monotherapy, Conservative, Base and Optimistic Scenario, Current Year and 2035 (USD Million)
- Table 13.90. Next Generation Drug Conjugates Market for Combination Therapy, Conservative, Base and Optimistic Scenario, Current Year and 2035 (USD Million)
- Table 13.91. Next Generation Intravenous Drug Conjugates Market, Conservative, Base and Optimistic Scenarios, till 2035 (USD Million)
- Table 13.92. Next Generation Subcutaneous Drug Conjugates Market, Conservative, Base and Optimistic Scenarios, till 2035 (USD Million)
- Table 13.93. Next Generation Drug Conjugates Market for Gastroenteropancreatic Neuroendocrine Tumors, Conservative, Base and Optimistic Scenarios, till 2035 (USD Million)
- Table 13.94. Next Generation Drug Conjugates Market for Prostate Cancer, Conservative, Base and Optimistic Scenarios, till 2035 (USD Million)
- Table 13.95. Next Generation Drug Conjugates Market for Acute Hepatic Porphyria , Conservative, Base and Optimistic Scenarios, till 2035 (USD Million)
- Table 13.96. Next Generation Drug Conjugates Market for Hereditary Transthyretin Amyloidosis , Conservative, Base and Optimistic Scenarios, till 2035 (USD Million)
- Table 13.97. Next Generation Drug Conjugates Market for Primary Hyperoxaluria , Conservative, Base and Optimistic Scenarios, till 2035 (USD Million)
- Table 13.98. Next Generation Drug Conjugates Market for Heterozygous Familial Hypercholesterolemia , Conservative, Base and Optimistic Scenarios, till 2035 (USD Million)
- Table 13.99. Next Generation Drug Conjugates Market for Leptomeningeal Carcinomatosis, Conservative, Base and Optimistic Scenarios, till 2035 (USD Million)
- Table 13.100. Next Generation Drug Conjugates Market for Atherosclerotic Cardiovascular Diseases , Conservative, Base and Optimistic Scenarios, till 2035 (USD Million)
- Table 13.101. Next Generation Drug Conjugates Market for Severe Hypertriglyceridemia, Conservative, Base and Optimistic Scenarios, till 2035 (USD Million)
- Table 13.102. Next Generation Drug Conjugates Market for Hereditary Angioedema, Conservative, Base and Optimistic Scenarios, till 2035 (USD Million)
- Table 13.103. Next Generation Drug Conjugates Market for Hemophilia, Conservative, Base and Optimistic Scenarios, till 2035 (USD Million)
- Table 13.104. Next Generation Drug Conjugates Market for Low-Risk Myelodysplastic Syndrome, Conservative, Base and Optimistic Scenarios, till 2035 (USD Million)
- Table 13.105. Next Generation Drug Conjugates Market for Myelofibrosis, Conservative, Base and Optimistic Scenarios, till 2035 (USD Million)
- Table 13.106. Next Generation Drug Conjugates Market for Alpha-1 Antitrypsin Deficiency Liver Disease, Conservative, Base and Optimistic Scenarios, till 2035 (USD Million)
- Table 13.107. Next Generation Drug Conjugates Market for Familial Chylomicronemia Syndrome, Conservative, Base and Optimistic Scenarios, till 2035 (USD Million)
- Table 13.108. Next Generation Drug Conjugates Market for Cardiovascular Diseases complications due to Hyperlipoproteinemia, Conservative, Base and Optimistic Scenarios, till 2035 (USD Million)
- Table 13.109. Next Generation Drug Conjugates Market in North America, Conservative, Base and Optimistic Scenarios, till 2035 (USD Million)
- Table 13.110. Next Generation Drug Conjugates Market in the US, Conservative, Base and Optimistic Scenarios, till 2035 (USD Million)
- Table 13.111. Next Generation Drug Conjugates Market in Canada, Conservative, Base and Optimistic Scenarios, till 2035 (USD Million)
- Table 13.112. Next Generation Drug Conjugates Market in Europe, Conservative, Base and Optimistic Scenarios, till 2035 (USD Million)
- Table 13.113. Next Generation Drug Conjugates Market in the UK, Conservative, Base and Optimistic Scenarios, till 2035 (USD Million)
- Table 13.114. Next Generation Drug Conjugates Market in France, Conservative, Base and Optimistic Scenarios, till 2035 (USD Million)
- Table 13.115. Next Generation Drug Conjugates Market in Germany, Conservative, Base and Optimistic Scenarios, till 2035 (USD Million)
- Table 13.116. Next Generation Drug Conjugates Market in Spain, Conservative, Base and Optimistic Scenarios, till 2035 (USD Million)
- Table 13.117. Next Generation Drug Conjugates Market in Italy, Conservative, Base and Optimistic Scenarios, till 2035 (USD Million)
- Table 13.118. Next Generation Drug Conjugates Market in Rest of the Europe, Conservative, Base and Optimistic Scenarios, till 2035 (USD Million)
- Table 13.119. Next Generation Drug Conjugates Market in Asia-Pacific, Conservative, Base and Optimistic Scenarios, till 2035 (USD Million)
- Table 13.120. Next Generation Drug Conjugates Market in Japan, Conservative, Base and Optimistic Scenarios, till 2035 (USD Million)
- Table 13.121. Next Generation Drug Conjugates Market in Australia, Conservative, Base and Optimistic Scenarios, till 2035 (USD Million)
- Table 13.122. Next Generation Drug Conjugates Market in Brazil, Conservative, Base and Optimistic Scenarios, till 2035 (USD Million)
- Table 13.123. Next Generation Drug Conjugates Market in Rest of the World, Conservative, Base and Optimistic Scenarios, till 2035 (USD Million)
- Table 13.124. Lutathera(R): Sales Forecast, Conservative, Base and Optimistic Scenarios, till 2035 (USD Million)
- Table 13.125. Pluvicto(R): Sales Forecast, Conservative, Base and Optimistic Scenarios, till 2035 (USD Million)
- Table 13.126. Givlaari(R): Sales Forecast, Conservative, Base and Optimistic Scenarios, till 2035 (USD Million)
- Table 13.127. Oxlumo(R): Sales Forecast, Conservative, Base and Optimistic Scenarios, till 2035 (USD Million)
- Table 13.128. Leqvio(R): Sales Forecast, Conservative, Base and Optimistic Scenarios, till 2035 (USD Million)
- Table 13.129. Amvuttra(R): Sales Forecast, Conservative, Base and Optimistic Scenarios, till 2035 (USD Million)
- Table 13.130. Eplontersen: Sales Forecast, Conservative, Base and Optimistic Scenarios, till 2035 (USD Million)
- Table 13.131. Olezarsen: Sales Forecast, Conservative, Base and Optimistic Scenarios, till 2035 (USD Million)
- Table 13.132. Pelacarsen: Sales Forecast, Conservative, Base and Optimistic Scenarios, till 2035 (USD Million)
- Table 13.133. Donidalorsen: Sales Forecast, Conservative, Base and Optimistic Scenarios, till 2035 (USD Million)
- Table 13.134. Fitusiran: Sales Forecast, Conservative, Base and Optimistic Scenarios, till 2035 (USD Million)
- Table 13.135. Nedosiran: Sales Forecast, Conservative, Base and Optimistic Scenarios, till 2035 (USD Million)
- Table 13.136. Imetlestat: Sales Forecast, Conservative, Base and Optimistic Scenarios, 20232035 (USD Million)
- Table 13.137. Olpasiran: Sales Forecast, Conservative, Base and Optimistic Scenarios, till 2035 (USD Million)
- Table 13.138. ARO-AAT: Sales Forecast, Conservative, Base and Optimistic Scenarios, till 2035 (USD Million)
- Table 13.139. ARO-APOC3: Sales Forecast, Conservative, Base and Optimistic Scenarios, till 2035 (USD Million)
- Table 13.140. ANG-1005: Sales Forecast, Conservative, Base and Optimistic Scenarios, till 2035 (USD Million)
List of Figures
- Figure 3.1. Key Historical Events
- Figure 3.2. Structure of Next Generation Drug Conjugates
- Figure 3.3. Biochemical Interaction and Mechanism of Action
- Figure 3.4. Key Target Indications
- Figure 4.1 Next Generation Drug Conjugates: Distribution by Type of Conjugate
- Figure 4.2. Next Generation Drug Conjugates: Distribution by Type of Targeting Ligand
- Figure 4.3. Next Generation Drug Conjugates: Distribution by Type of Payload
- Figure 4.4. Next Generation Drug Conjugates: Distribution by Biological Target
- Figure 4.5. Next Generation Drug Conjugates: Distribution by Mechanism of Action
- Figure 4.6. Next Generation Drug Conjugates: Distribution by Stage of Development
- Figure 4.7. Next Generation Drug Conjugates: Distribution by Phase of Development
- Figure 4.8. Next Generation Drug Conjugates: Distribution by Type of Therapy
- Figure 4.9. Next Generation Drug Conjugates: Distribution by Route of Administration
- Figure 4.10. Next Generation Drug Conjugates: Distribution by Target Disease Indication
- Figure 4.11. Next Generation Drug Conjugates: Distribution by Therapeutic Area
- Figure 4.12. Next Generation Drug Conjugates: Distribution by Type of Conjugate and Stage of Development
- Figure 4.13. Next Generation Drug Conjugates: Distribution by Type of Conjugate and Target Population
- Figure 4.14. Next Generation Drug Conjugate Developers: Distribution by Year of Establishment
- Figure 4.15. Next Generation Drug Conjugate Developers: Distribution by Company Size
- Figure 4.16. Next Generation Drug Conjugate Developers: Distribution by Location of Headquarters (Region-wise)
- Figure 4.17. Next Generation Drug Conjugate Developers: Distribution by Location of Headquarters (Country-wise)
- Figure 4.18. Next Generation Drug Conjugate Developers: Distribution by Year of Establishment, Company Size and Location of Headquarters (Region-wise)
- Figure 4.19. Most Active Players: Distribution by Number of Drug Candidates
- Figure 6.1. Clinical Trial Analysis: Distribution by Trial Registration Year
- Figure 6.2. Clinical Trial Analysis: Distribution by Trial Phase
- Figure 6.3. Clinical Trial Analysis: Distribution by Trial Status
- Figure 6.4. Clinical Trial Analysis: Distribution by Therapeutic Area
- Figure 6.5. Clinical Trial Analysis: Distribution by Primary Purpose
- Figure 6.6. Clinical Trial Analysis: Distribution by Age Group
- Figure 6.7. Clinical Trial Analysis: Distribution by Type of Sponsor
- Figure 6.8. Most Active Industry Players: Distribution by Number of Trials
- Figure 6.9. Leading Drug Candidates: Distribution by Number of Trials
- Figure 6.10. Clinical Trial Analysis: Distribution by Trial Registration Year and Trial Location
- Figure 6.11. Clinical Trial Analysis: Distribution by Trial Registration Year and Enrolled Patient Population
- Figure 6.12. Clinical Trial Analysis: Distribution by Trial Phase and Enrolled Patient Population
- Figure 6.13. Clinical Trial Analysis: Distribution by Trial Registration Year and Trial Status
- Figure 6.14. Clinical Trial Analysis: Distribution by Trial Location and Enrolled Patient Population
- Figure 6.15. Clinical Trial Analysis: Distribution by Trial Status and Trial Location
- Figure 7.1. Partnerships and Collaborations: Distribution by Year of Partnership
- Figure 7.2. Partnerships and Collaborations: Distribution by Type of Partnership
- Figure 7.3. Partnerships and Collaborations: Distribution by Year and Type of Partnership
- Figure 7.4. Partnerships and Collaborations: Distribution by Type of Partner
- Figure 7.5. Partnerships and Collaborations: Distribution by Year of Partnership and Type of Partner
- Figure 7.6. Partnerships and Collaborations: Distribution by Type of Partnership and Type of Partner
- Figure 7.7. Partnerships and Collaborations: Distribution by Type of Partner and Parent Company Size
- Figure 7.8. Partnerships and Collaborations: Distribution by Therapeutic Area
- Figure 7.9. Most Active Players: Distribution by Number of Partnerships
- Figure 7.10. Partnerships and Collaborations: Distribution by Type of Geography (Region-wise)
- Figure 7.11. Partnerships and Collaborations: Distribution by Type of Geography (Country-wise)
- Figure 7.12. Partnerships and Collaborations: Intercontinental and Intracontinental Deals
- Figure 8.1. Academic Grants Analysis: Distribution by Year of Grant Award
- Figure 8.2. Academic Grants Analysis: Distribution by Amount Awarded
- Figure 8.3. Academic Grants Analysis: Distribution by Funding Institute Center
- Figure 8.4. Academic Grants Analysis: Distribution by Support Period
- Figure 8.5. Academic Grants Analysis: Distribution by Funding Institute Center and Support Period
- Figure 8.6. Academic Grants Analysis: Distribution by Type of Grant Application
- Figure 8.7. Academic Grants Analysis: Distribution by Purpose of Grant
- Figure 8.8. Academic Grants Analysis: Distribution by Activity Code
- Figure 8.9. Academic Grants Analysis: Distribution by Study Section
- Figure 8.10 Popular NIH Departments: Distribution by Number of Grants
- Figure 8.11 Academic Grants Analysis: Distribution by Type of Recipient Organization
- Figure 8.12. Popular Recipient Organization: Distribution by Number of Grants
- Figure 8.13. Popular Recipient Organization: Distribution by Amount Awarded
- Figure 8.14 Prominent Program Officers: Distribution by Number of Grants
- Figure 8.15. Academic Grants Analysis: Distribution by Location of Recipient Organizations
- Figure 9.1. Publication Analysis: Distribution by Year of Publication
- Figure 9.2. Publication Analysis: Distribution by Type of Publication
- Figure 9.3. Publication Analysis: Distribution by Type of Conjugate
- Figure 9.4. Publication Analysis: Distribution by Target Indication
- Figure 9.5. Publication Analysis: Distribution by Copyright Holder
- Figure 9.6. Word Cloud: Emerging Focus Area
- Figure 9.7. Most Active Publishers: Distribution by Number of Publications
- Figure 9.8. Key Journals: Distribution by Number of Publications
- Figure 9.9. Key Journals: Distribution by Impact Factor
- Figure 10.1. Drug Failure Analysis: Distribution by Status of Discontinuation
- Figure 10.2. Drug Failure Analysis: Distribution by Phase of Discontinuation
- Figure 10.3. Drug Failure Analysis: Distribution by Average Trial Year
- Figure 10.4. Drug Failure Analysis: Distribution by Type of Therapy
- Figure 10.5. Drug Failure Analysis: Distribution by Target Indication
- Figure 10.6. Drug Failure Analysis: Distribution by Reason for Drug Failure
- Figure 11.1. Success Protocol Analysis: Lutathera(R) (Gastroenteropancreatic Neuroendocrine Tumor)
- Figure 11.2. Success Protocol Analysis: Pluvicto(R) (Prostate Cancer)
- Figure 11.3. Success Protocol Analysis: Givlaari(R) (Acute Hepatic Porphyria)
- Figure 11.4 Success Protocol Analysis: Oxlumo(R) (Primary Hyperoxaluria)
- Figure 11.5 Success Protocol Analysis: Amvuttra(R) (Hereditary ATTR Amyloidosis)
- Figure 11.6 Success Protocol Analysis: Leqvio(R) (Heterozygous Familial Hypercholesterolemia)
- Figure 11.7 Harvey ball Analysis: Overall Assessment of Approved Next Generation Drug Conjugates
- Figure 12.1. Global Next Generation Drug Conjugates Market, till 2035 (USD Million), Base Scenario
- Figure 12.2. Global Next Generation Drug Conjugates Market, till 2035 (USD Million), Conservative Scenario
- Figure 12.3. Global Next Generation Drug Conjugates Market, till 2035 (USD Million), Optimistic Scenario
- Figure 12.4. Next Generation Drug Conjugates Market for Peptide Radionuclide Conjugates, till 2035 (USD Million)
- Figure 12.5. Next Generation Drug Conjugates Market for Ligand Conjugated Anti Sense Medicine, till 2035 (USD Million)
- Figure 12.6 Next Generation Drug Conjugates Market for Ligand mediated RNAi Conjugates, till 2035 (USD Million)
- Figure 12.7. Next Generation Drug Conjugates Market for Peptide Drug Conjugates, till 2035 (USD Million)
- Figure 12.8. Next Generation Drug Conjugates Market for Amino Sugars, till 2035 (USD Million)
- Figure 12.9 Next Generation Drug Conjugates Market for Peptides, till 2035 (USD Million)
- Figure 12.10. Next Generation Drug Conjugates Market for Lipids, till 2035 (USD Million)
- Figure 12.11. Next Generation Drug Conjugates Market for Radionuclides, till 2035 (USD Million)
- Figure 12.12. Next Generation Drug Conjugates Market for Drugs, till 2035 (USD Million)
- Figure 12.13. Next Generation Drug Conjugates Market for Antisense Oligonucleotides, till 2035 (USD Million)
- Figure 12.14. Next Generation Drug Conjugates Market for si-RNAs, till 2035 (USD Million)
- Figure 12.15 Next Generation Drug Conjugates Market for Monotherapy, till 2035 (USD Million)
- Figure 12.16. Next Generation Drug Conjugates Market for Combination Therapy till 2035 (USD Million)
- Figure 12.17. Next Generation Intravenous Drug Conjugates Market, till 2035 (USD Million)
- Figure 12.18. Next Generation Subcutaneous Drug Conjugates Market, till 2035 (USD Million)
- Figure 12.19. Next Generation Drug Conjugates Market for Gastroenteropancreatic Neuroendocrine Tumors, till 2035 (USD Million)
- Figure 12.20. Next Generation Drug Conjugates Market for Prostate Cancer, till 2035 (USD Million)
- Figure 12.21. Next Generation Drug Conjugates Market for Acute Hepatic Porphyria, till 2035 (USD Million)
- Figure 12.22. Next Generation Drug Conjugates Market for Heterozygous Familial Hypercholesterolemia, till 2035 (USD Million)
- Figure 12.23. Next Generation Drug Conjugates Market for Hereditary Transthyretin Amyloidosis, till 2035 (USD Million)
- Figure 12.24. Next Generation Drug Conjugates Market for Primary Hyperoxaluria, till 2035 (USD Million)
- Figure 12.25. Next Generation Drug Conjugates Market for Leptomeningeal Carcinomatosis, till 2035 (USD Million)
- Figure 12.26. Next Generation Drug Conjugates Market for Atherosclerotic Cardiovascular Diseases, till 2035 (USD Million)
- Figure 12.27. Next Generation Drug Conjugates Market for Severe Hypertriglyceridemia, till 2035 (USD Million)
- Figure 12.28. Next Generation Drug Conjugates Market for Hereditary Angioedema, till 2035 (USD Million)
- Figure 12.29. Next Generation Drug Conjugates Market for Hemophilia, till 2035 (USD Million)
- Figure 12.30. Next Generation Drug Conjugates Market for Low-Risk Myelodysplastic Syndrome, till 2035 (USD Million)
- Figure 12.31. Next Generation Drug Conjugates Market for Myelofibrosis, till 2035 (USD Million)
- Figure 12.32. Next Generation Drug Conjugates Market for Alpha-1 Antitrypsin Deficiency Liver Disease, till 2035 (USD Million)
- Figure 12.33. Next Generation Drug Conjugates Market for Familial Chylomicronemia Syndrome, till 2035 (USD Million)
- Figure 12.34. Next Generation Drug Conjugates Market for Cardiovascular Diseases due to HLP, till 2035 (USD Million)
- Figure 12.35. Next Generation Drug Conjugates Market in North America, till 2035 (USD Million)
- Figure 12.36. Next Generation Drug Conjugates Market in the US, till 2035 (USD Million)
- Figure 12.37. Next Generation Drug Conjugates Market in Canada, till 2035 (USD Million)
- Figure 12.38. Next Generation Drug Conjugates Market in Europe, till 2035 (USD Million)
- Figure 12.39. Next Generation Drug Conjugates Market in France, till 2035 (USD Million)
- Figure 12.40. Next Generation Drug Conjugates Market in the UK, till 2035 (USD Million)
- Figure 12.41. Next Generation Drug Conjugates Market in Germany, till 2035 (USD Million)
- Figure 12.42. Next Generation Drug Conjugates Market in Italy, till 2035 (USD Million)
- Figure 12.43. Next Generation Drug Conjugates Market in Spain, till 2035 (USD Million)
- Figure 12.44. Next Generation Drug Conjugates Market in Rest of the Europe, till 2035 (USD Million)
- Figure 12.45. Next Generation Drug Conjugates Market in Asia-Pacific, till 2035 (USD Million)
- Figure 12.46. Next Generation Drug Conjugates Market in Japan, till 2035 (USD Million)
- Figure 12.47. Next Generation Drug Conjugates Market in Brazil, till 2035 (USD Million)
- Figure 12.48. Next Generation Drug Conjugates Market in Australia, till 2035 (USD Million)
- Figure 12.49. Next Generation Drug Conjugates Market in Rest of the World, till 2035 (USD Million)
- Figure 12.50. Lutathera(R): Sales Forecast (USD Million)
- Figure 12.51. Pluvicto(R): Sales Forecast (USD Million)
- Figure 12.52. Givlaari(R): Sales Forecast (USD Million)
- Figure 12.53. Oxlumo(R): Sales Forecast (USD Million)
- Figure 12.54. Leqvio(R): Sales Forecast (USD Million)
- Figure 12.55. Amvuttra(R): Sales Forecast (USD Million)
- Figure 12.56. Eplontersen: Sales Forecast (USD Million)
- Figure 12.57. Olezarsen: Sales Forecast (USD Million)
- Figure 12.58. Pelacarsen: Sales Forecast (USD Million)
- Figure 12.59. Donidalorsen: Sales Forecast (USD Million)
- Figure 12.60. Fitusiran: Sales Forecast (USD Million)
- Figure 12.61. Nedosiran: Sales Forecast (USD Million)
- Figure 12.62. Imetlestat: Sales Forecast (USD Million)
- Figure 12.63. Olpasiran: Sales Forecast (USD Million)
- Figure 12.64. ARO-AAT: Sales Forecast (USD Million)
- Figure 12.65. ARO-APOC3: Sales Forecast (USD Million)
- Figure 12.66. ANG-1005: Sales Forecast (USD Million)

