
PUBLISHER: Roots Analysis | PRODUCT CODE: 1682706

PUBLISHER: Roots Analysis | PRODUCT CODE: 1682706
Cell and Gene Therapy Supply Chain Software Market by Process Component, Type of Software, Mode of Deployment, Scale of Operation, Type of End-User and Key Geographical Regions : Industry Trends and Global Forecasts, Till 2035
CELL AND GENE THERAPY SUPPLY CHAIN SOFTWARE MARKET: OVERVIEW
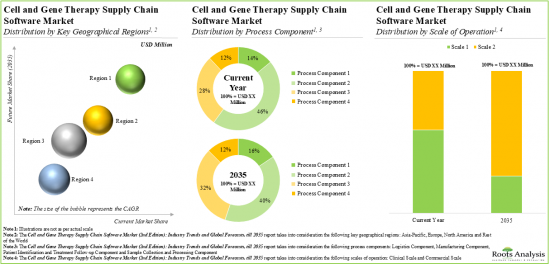
As per Roots Analysis, the global cell and gene therapy supply chain software market is estimated to grow from USD 0.27 billion in the current year to USD 1.32 billion by 2035, at a CAGR of 15.2% during the forecast period, till 2035.
The market opportunity for cell and gene therapy supply chain software has been distributed across the following segments:
Process Component
- Sample Collection and Processing Component
- Manufacturing Component
- Logistics Component
- Patient Identification and Treatment Follow-up Component
Type of Software
- Enterprise Manufacturing System (EMS)
- Laboratory Information Management System (LIMS)
- Inventory Management System (IMS)
- Cell Orchestration Platform (COP)
- Quality Management System (QMS)
- Logistics Management System (LMS)
- Patient Management System (PMS)
Mode of Deployment
- On-premises Deployment
- Cloud-based Deployment
Type of End-User
- Pharmaceutical Companies
- Cell Therapy Labs
- Hospitals / Medical Centers
- Research Institutes / Biobanks
Scale of Operation
- Clinical Scale
- Commercial Scale
Key Geographical Regions
- North America
- Europe
- Asia-Pacific
- Rest of the World
CELL AND GENE THERAPY SUPPLY CHAIN SOFTWARE MARKET: GROWTH AND TRENDS
Advanced therapies are gradually evolving the face of modern healthcare. These new regenerative and immunotherapy modalities have the potential to improve treatment outcomes by providing viable therapy solutions to patients who currently have limited or no treatment options. Given the nature of these treatment modalities, these therapies have a limited lifespan, even when shipped under temperature-controlled conditions. It becomes increasingly important to track the source of the sample from the time of its collection, current location and manufacturing processes. Following this fact, for the commercial success of such therapies, an effective manufacturing platform and a robust supply chain model are imperative. It is worth mentioning that a sustainable supply chain enables further reductions in the cost of goods and, in turn, prices of such therapies.
The supply chain for innovative therapies is complicated from the outset and given the interdependencies amongst multiple stakeholders, it becomes challenging to manage and streamline the overall process. This has reinforced the need for bespoke and integrated software solutions to help innovators manage the critical intricacies of the supply chain. These software systems have huge potential to manage a multitude of events, maintain the chain of identity and custody, and enable stakeholders to optimize the complex supply chains, while also ensuring compliance with global regulatory standards. Driven by the growing demand for cell and gene therapies and the availability of easy to integrate software solutions to manage cell and gene therapy supply chain, this market is expected to grow significantly in the foreseen future.
CELL AND GENE THERAPY SUPPLY CHAIN SOFTWARE MARKET: KEY INSIGHTS
The report delves into the current state of the cell and gene therapy supply chain software market and identifies potential growth opportunities within the industry. Some key findings from the report include:
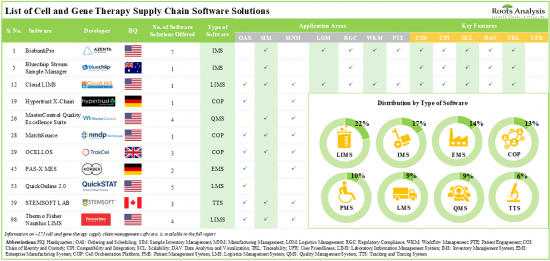
- Presently, close to 175 cell and gene therapy supply chain software solutions are available in the market; of these, 22% are laboratory information management systems.
- Over 20% of the cell and gene therapy supply chain software solutions can be deployed both on-premises and over the cloud, offering flexibility as well as contact-less options for the end-users.
- The current market landscape of cell and gene therapy supply chain software providers is fragmented, featuring the presence of both new entrants and established players; majority of these players are based in the US.
- The growing interest in this domain is evident from the rise in partnership activity; in fact, 40 partnership deals related to cell and gene therapy supply chain software were inked in 2023.
- Several investors, having realized the opportunities associated within supply chain management software domain, have invested USD 3 billion across various funding rounds in the past 10 years.
- Driven by the increasing pace of innovation and partnership activity, the market for cell and gene therapy supply chain software is poised to witness steady growth in the foreseeable future.
- The cell and gene therapy supply chain software market is anticipated to grow at a CAGR of 15.2%, till 2035; North America is expected to capture the majority share (over 45%) of the market by 2035.
CELL AND GENE THERAPY SUPPLY CHAIN SOFTWARE MARKET: KEY SEGMENTS
Manufacturing of Cell and Gene Therapies Occupy the Largest Share of the Overall Market
Based on the process components, the market is segmented into sample collection and processing, manufacturing, logistics, and patient identification and treatment follow-up. At present, the manufacturing component holds the maximum share of the cell and gene therapy supply chain software market. This trend is unlikely to change in the near future.
Currently, Enterprise Manufacturing System (EMS) Occupies the Largest Share of the Cell and Gene Therapy Supply Chain Software Market
Based on the type of software, the market is segmented into enterprise manufacturing system, laboratory information management system, inventory management system, cell orchestration platform, quality management system, logistics management system and patient management system. At present, enterprise manufacturing system holds the maximum share of the cell and gene therapy supply chain software market. It is worth highlighting that the cell and gene therapy supply chain software market for cell orchestration platforms (COPs) is anticipated to grow at a relatively faster CAGR. This can be attributed to the fact that COPs can be easily integrated with the existing supply chain systems in order to provide end-to-end view of the entire supply chain.
Cloud-Based Software is the Fastest Growing Segment of the Cell and Gene Therapy Supply Chain Software Market During the Forecast Period
Based on the mode of deployment, the market is segmented into on-premises deployment and cloud-based deployment. It is worth highlighting that, at present, on-premises deployment holds a larger share in the cell and gene therapy supply chain software market. However, in the coming years, the market for cloud-based deployment is expected to grow at a relatively faster CAGR.
Software Solutions Used to Manage Clinical Operations Occupies the Largest Share of the Cell and Gene Therapy Supply Chain Software Market
Based on the scale of operation, the market is segmented into clinical and commercial scales. At present, software solutions used to manage clinical operations hold the maximum share of the cell and gene therapy supply chain software market. However, in the coming years, the software solutions used to manage commercial operations are anticipated to grow at a relatively faster pace. This can be attributed to the expected increase in the market approval of cell and gene therapies which are currently in the clinical stages of development.
Pharmaceutical Companies are Likely to Dominate the Cell and Gene Therapy Supply Chain Software Market During the Forecast Period
Based on the type of end-user, the market is segmented into pharmaceutical companies, cell therapy labs, hospitals / medical centers and research institutes / biobanks. Majority of the current cell and gene therapy supply chain software market is captured by the pharmaceutical companies. It is worth highlighting that the cell and gene therapy supply chain software market for cell therapy labs is anticipated to grow at a relatively faster pace.
North America Accounts for the Largest Share of the Market
Based on key geographical regions, the market is segmented into North America, Europe, Asia-Pacific and Rest of the world. Majority of the share is expected to be captured by software solution providers based in North America. It is worth highlighting that, over the years, the market in Asia-Pacific is expected to grow at a higher CAGR.
Example Players in the Cell and Gene Therapy Supply Chain Software Market
- Azenta Life Sciences
- Biocair
- BioLife Solutions
- CareDx
- Cryoport
- Lonza
- NMDP BioTherapies
- TraceLink
- TrakCel
- Veeva Systems
- Emerson
- LabVantage Solutions
- Marken
- MasterControl
- QuickSTAT
- Siemens
- Stafa Cellular Therapy
- Steiner
- STEMSOFT Software
- TECHNIDATA
- Thermo Fisher Scientific
Primary Research Overview
The opinions and insights presented in this study were influenced by discussions conducted with multiple stakeholders. The research report features detailed transcripts of interviews held with the following industry stakeholders:
- Former Chief Business Officer, Mid-sized Company, UK
- Chief Clinical Officer, Mid-sized Company, UK
- Former Senior Director, Corporate Strategy and Business Development, Very Large Company, US
- International Sales and Transfusion Manager, Small Company, France
- Former General Manager, Cell Therapy, Very Large Company, US
CELL AND GENE THERAPY SUPPLY CHAIN SOFTWARE MARKET: RESEARCH COVERAGE
- Market Sizing and Opportunity Analysis: The report features an in-depth analysis of the cell and gene therapy supply chain software market, focusing on key market segments, including [A] process component, [B] type of software, [C] mode of deployment, [D] scale of operation and [E] key geographical regions.
- Market Landscape: A comprehensive evaluation of cell and gene therapy supply chain software solutions, considering various parameters, such as [A] type of software, [B] key features, [C] application area, [D] mode of deployment, [E] scale of operation, [F] regulatory guidelines followed and [G] type of end-user. Additionally, it includes a detailed list of developers providing cell and gene therapy supply chain software solutions, along with analysis based on various parameters, such as [H] year of establishment, [I] company size (in terms of employee count), [J] location of headquarters (North America, Europe, Asia-Pacific, and rest of the world) and [K] most active players based on the number of software solutions offered.
- Company Competitiveness Analysis: A comprehensive competitive analysis of cell and gene therapy supply chain software solution providers, examining factors, such as [A] developer strength and [B] product portfolio strength.
- Company Profiles: In-depth profiles of key cell and gene therapy supply chain software solution providers, focusing on [A] company overviews, [B] software solutions portfolio, [C] financial information, [D] recent developments and [E] an informed future outlook.
- Funding and Investment Analysis: A detailed evaluation of the investments made in this domain, encompassing seed funding, venture capital, debt financing, grants / awards, capital raised from IPOs and subsequent offerings.
- Partnerships and Collaborations: An analysis of partnerships established in this sector, since 2019, covering acquisitions, platform utilization agreements, service alliances, platform integration agreements, product development agreements, service agreements and other agreements.
- Platform Utilization Agreements in Supply Chain Software Solutions Market: An in-depth analysis of the platform utilization agreements inked in this domain since 2019, providing information on the different types of software utilized by end-users in the cell and gene therapy supply chain.
- Stakeholder Need Analysis: A qualitative evaluation of the current and future needs of various stakeholders in the cell and gene therapy supply chain, including patients, healthcare providers, collection centers, manufacturers, logistics service providers and regulators. This section provides a summary of the distinct needs of these stakeholders and presents our opinion (drawn from historical and current trends) on the impact of these needs on the supply chain and how the industry is preparing to cater to these needs.
- Market Impact Analysis: The report analyzes various factors such as drivers, restraints, opportunities, and challenges affecting the market growth.
KEY QUESTIONS ANSWERED IN THIS REPORT
- How many companies are currently engaged in this market?
- Which are the leading companies in this market?
- What kind of partnership models are commonly adopted by industry stakeholders?
- What are the factors that are likely to influence the evolution of this market?
- What is the current and future market size?
- What is the CAGR of this market?
- How is the current and future market opportunity likely to be distributed across key market segments?
REASONS TO BUY THIS REPORT
- The report provides a comprehensive market analysis, offering detailed revenue projections of the overall market and its specific sub-segments. This information is valuable to both established market leaders and emerging entrants.
- Stakeholders can leverage the report to gain a deeper understanding of the competitive dynamics within the market. By analyzing the competitive landscape, businesses can make informed decisions to optimize their market positioning and develop effective go-to-market strategies.
- The report offers stakeholders a comprehensive overview of the market, including key drivers, barriers, opportunities, and challenges. This information empowers stakeholders to stay abreast of market trends and make data-driven decisions to capitalize on growth prospects.
ADDITIONAL BENEFITS
- Complimentary PPT Insights Packs
- Complimentary Excel Data Packs for all Analytical Modules in the Report
- 10% Free Content Customization
- Detailed Report Walkthrough Session with Research Team
- Free Updated report if the report is 6-12 months old or older
TABLE OF CONTENTS
1. PREFACE
- 1.1. Introduction
- 1.2. Market Share Insights
- 1.3. Key Market Insights
- 1.4. Report Coverage
- 1.5. Key Questions Answered
- 1.6. Chapter Outlines
2. RESEARCH METHODOLOGY
- 2.1. Chapter Overview
- 2.2. Research Assumptions
- 2.3. Project Methodology
- 2.4. Forecast Methodology
- 2.5. Robust Quality Control
- 2.6. Key Market Segmentations
- 2.7. Key Considerations
- 2.7.1. Demographics
- 2.7.2. Economic Factors
- 2.7.3. Government Regulations
- 2.7.4. Supply Chain
- 2.7.5. COVID Impact
- 2.7.6. Market Access
- 2.7.7. Healthcare Policies
- 2.7.8. Industry Consolidation
3. ECONOMIC AND OTHER PROJECT SPECIFIC CONSIDERATIONS
- 3.1. Chapter Overview
- 3.2. Market Dynamics
- 3.2.1. Time Period
- 3.2.1.1. Historical Trends
- 3.2.1.2. Current and Future Estimates
- 3.2.2. Currency Coverage and Foreign Exchange Rate
- 3.2.2.1. Major Currencies Affecting the Market
- 3.2.2.2. Factors Affecting Currency Fluctuations and Foreign Exchange Rates
- 3.2.2.3. Impact of Foreign Exchange Rate Volatility on the Market
- 3.2.2.4. Strategies for Mitigating Foreign Exchange Risks
- 3.2.3. Trade Policies
- 3.2.3.1. Impact of Trade Barriers on the Market
- 3.2.3.2. Strategies for Mitigating the Risks associated with Trade Barriers
- 3.2.4. Recession
- 3.2.4.1. Historical Analysis of Past Recessions and Lessons Learnt
- 3.2.4.2. Assessment of Current Economic Conditions and Potential Impact on the Market
- 3.2.5. Inflation
- 3.2.5.1. Measurement and Analysis of Inflationary Pressures in the Economy
- 3.2.5.2. Potential Impact of Inflation on the Market Evolution
- 3.2.1. Time Period
4. EXECUTIVE SUMMARY
5. INTRODUCTION
- 5.1. Chapter Overview
- 5.2. Overview of Cell Therapies
- 5.3. Advanced Therapy Medicinal Products (ATMPs)
- 5.3.1. Difference between Cell / Advanced Therapies and Other Biotechnology Products
- 5.4. Overview of Cell and Gene Therapy Supply Chain
- 5.4.1. Software Solutions for Cell and Gene Therapy Supply Chain
- 5.4.1.1. Enterprise Manufacturing System (EMS)
- 5.4.1.2. Laboratory Information Management System (LIMS)
- 5.4.1.3. Inventory Management System (IMS)
- 5.4.1.4. Quality Management System (QMS)
- 5.4.1.5. Logistics Management System (LMS)
- 5.4.1.6. Patient Management System (PMS)
- 5.4.1.7. Cell Orchestration Platform (COP)
- 5.4.2. Challenges in Cell and Advanced Therapy Supply Chain
- 5.4.1. Software Solutions for Cell and Gene Therapy Supply Chain
- 5.5. Recent Developments and Future Outlook
6. MARKET LANDSCAPE
- 6.1. Chapter Overview
- 6.2. Cell and Gene Therapy Supply Chain Software: Overall Market Landscape
- 6.2.1. Analysis by Type of Software
- 6.2.2. Analysis by Key Features
- 6.2.3. Analysis by Application Area
- 6.2.4. Analysis by Mode of Deployment
- 6.2.5. Analysis by Type of Software and Mode of Deployment
- 6.2.6. Analysis by Scale of Operation
- 6.2.7. Analysis by Type of Software and Scale of Operation
- 6.2.8. Analysis by Regulatory Guidelines Followed
- 6.2.9. Analysis by Type of End-User
- 6.2.10. Analysis by Type of Software and End-User
- 6.3. Cell and Gene Therapy Supply Chain Software: Developer Landscape
- 6.3.1. Analysis by Year of Establishment
- 6.3.2. Analysis by Company Size
- 6.3.3. Analysis by Year of Establishment and Company Size
- 6.3.4. Analysis by Location of Headquarters
- 6.3.5. Analysis by Number of Software Solutions Offered
- 6.3.6. Most Active Players: Analysis by Number of Software Solutions Offered
7. COMPANY COMPETITIVENESS ANALYSIS
- 7.1. Chapter Overview
- 7.2. Assumptions and Key Parameters
- 7.3. Methodology
- 7.4. Company Competitiveness Analysis: Cell and Gene Therapy Supply Chain Software Providers
- 7.4.1. COP Developers
- 7.4.2. EMS Developers
- 7.4.3. IMS Developers
- 7.4.4. LIMS Developers
- 7.4.5. LMS Developers
- 7.4.6. PMS Developers
- 7.4.7. QMS Developers
- 7.4.8. TTS Developers
8. COMPANY PROFILES
- 8.1. Chapter Overview
- 8.2. Leading Players in Cell and Gene Therapy Supply Chain Software Market
- 8.2.1. Azenta Life Sciences
- 8.2.1.1. Company Overview
- 8.2.1.2. Supply Chain Management Solutions Portfolio
- 8.2.1.3. Financial Information
- 8.2.1.4. Recent Developments and Future Outlook
- 8.2.2. NMDP BioTherapies
- 8.2.2.1. Company Overview
- 8.2.2.2. Supply Chain Management Solutions Portfolio
- 8.2.2.3. Financial Information
- 8.2.2.4. Recent Developments and Future Outlook
- 8.2.3. Biocair
- 8.2.3.1. Company Overview
- 8.2.3.2. Supply Chain Management Solutions Portfolio
- 8.2.3.3. Recent Developments and Future Outlook
- 8.2.4. BioLife Solutions
- 8.2.4.1. Company Overview
- 8.2.4.2. Supply Chain Management Solutions Portfolio
- 8.2.4.3. Financial Information
- 8.2.4.4. Recent Developments and Future Outlook
- 8.2.5. CareDx
- 8.2.5.1. Company Overview
- 8.2.5.2. Supply Chain Management Solutions Portfolio
- 8.2.5.3. Financial Information
- 8.2.5.4. Recent Developments and Future Outlook
- 8.2.6. Cryoport
- 8.2.6.1. Company Overview
- 8.2.6.2. Supply Chain Management Solutions Portfolio
- 8.2.6.3. Financial Information
- 8.2.6.4. Recent Developments and Future Outlook
- 8.2.7. Lonza
- 8.2.7.1. Company Overview
- 8.2.7.2. Supply Chain Management Solutions Portfolio
- 8.2.7.3. Financial Information
- 8.2.7.4. Recent Developments and Future Outlook
- 8.2.8. TraceLink
- 8.2.8.1. Company Overview
- 8.2.8.2. Supply Chain Management Solutions Portfolio
- 8.2.8.3. Recent Developments and Future Outlook
- 8.2.9. TrakCel
- 8.2.9.1. Company Overview
- 8.2.9.2. Supply Chain Management Solutions Portfolio
- 8.2.9.3. Recent Developments and Future Outlook
- 8.2.10. Veeva Systems
- 8.2.10.1. Company Overview
- 8.2.10.2. Supply Chain Management Solutions Portfolio
- 8.2.10.3. Financial Information
- 8.2.10.4. Recent Developments and Future Outlook
- 8.2.1. Azenta Life Sciences
- 8.3. Other Leading Players in Cell and Gene Therapy Supply Chain Software Market
- 8.3.1. Emerson
- 8.3.1.1. Company Overview
- 8.3.1.2. Supply Chain Management Solutions Portfolio
- 8.3.2. LabVantage Solutions
- 8.3.2.1. Company Overview
- 8.3.2.2. Supply Chain Management Solutions Portfolio
- 8.3.3. Marken
- 8.3.3.1. Company Overview
- 8.3.3.2. Supply Chain Management Solutions Portfolio
- 8.3.4. MasterControl
- 8.3.4.1. Company Overview
- 8.3.4.2. Supply Chain Management Solutions Portfolio
- 8.3.5. QuickSTAT
- 8.3.5.1. Company Overview
- 8.3.5.2. Supply Chain Management Solutions Portfolio
- 8.3.6. Siemens
- 8.3.6.1. Company Overview
- 8.3.6.2. Supply Chain Management Solutions Portfolio
- 8.3.7. Stafa Cellular Therapy
- 8.3.7.1. Company Overview
- 8.3.7.2. Supply Chain Management Solutions Portfolio
- 8.3.8. Steiner
- 8.3.8.1. Company Overview
- 8.3.8.2. Supply Chain Management Solutions Portfolio
- 8.3.9. STEMSOFT Software
- 8.3.9.1. Company Overview
- 8.3.9.2. Supply Chain Management Solutions Portfolio
- 8.3.10. TECHNIDATA
- 8.3.10.1. Company Overview
- 8.3.10.2. Supply Chain Management Solutions Portfolio
- 8.3.11. Thermo Fisher Scientific
- 8.3.11.1. Company Overview
- 8.3.11.2. Supply Chain Management Solutions Portfolio
- 8.3.1. Emerson
9. FUNDING AND INVESTMENT ANALYSIS
- 9.1. Chapter Overview
- 9.2. Funding Models
- 9.3. Cell and Gene Therapy Supply Chain Software: Funding and Investment Analysis
- 9.3.1. Analysis by Year of Funding
- 9.3.2. Analysis by Amount Invested
- 9.3.3. Analysis by Type of Funding
- 9.3.4. Analysis by Type of Funding and Amount Invested
- 9.3.5. Analysis of Amount Invested by Year and Type of Funding
- 9.3.6. Analysis by Geography
- 9.3.7. Most Active Players: Analysis by Number of Instances
- 9.3.8. Most Active Players: Analysis by Amount Raised
- 9.3.9. Key Investors: Analysis by Number of Funding Instances
- 9.3.10. Analysis by Type of Investor
- 9.4. Concluding Remarks
10. PARTNERSHIPS AND COLLABORATIONS
- 10.1. Chapter Overview
- 10.2. Partnership Models
- 10.3. Cell and Gene Therapy Supply Chain Software: Partnerships and Collaborations
- 10.3.1. Analysis by Year of Partnership
- 10.3.2. Analysis by Type of Partnership
- 10.3.3. Analysis by Year and Type of Partnership
- 10.3.4. Analysis by Type of Partnership and Company Size
- 10.3.5. Analysis by Type of Partner
- 10.3.6. Analysis by Type of Software Involved
- 10.3.7. Most Active Players: Analysis by Number of Partnerships
- 10.3.8. Analysis by Geography
- 10.3.8.1. Local and International Agreements
- 10.3.8.2. Intracontinental and Intercontinental Agreements
11. PLATFORM UTILIZATION AGREEMENTS IN SUPPLY CHAIN SOFTWARE SOLUTIONS MARKET
- 11.1. Chapter Overview
- 11.2. Platform Utilization Agreements in Supply Chain Software Solutions Market: List of Agreements
- 11.2.1. Analysis by Year of Agreement
- 11.2.2. Analysis by Type of Partner
- 11.2.3. Analysis by Type of Software Involved
- 11.2.4. Analysis by Type of Partner and Type of Software Involved
- 11.2.5. Analysis of Partners by Geography
- 11.2.6. Most Active Players: Analysis by Number of Platform Utilization Agreements
12. STAKEHOLDER NEEDS ANALYSIS
- 12.1. Chapter Overview
- 12.2. Cell and Gene Therapy Supply Chain: Needs of Different Stakeholders
- 12.2.1. Comparison of Stakeholder Needs
- 12.2.2. Conclusion
13. MARKET IMPACT ANALYSIS: DRIVERS, RESTRAINTS, OPPORTUNITIES AND CHALLENGES
- 13.1. Chapter Overview
- 13.2. Market Drivers
- 13.3. Market Restraints
- 13.4. Market Opportunities
- 13.5. Market Challenges
- 13.6. Conclusion
14. GLOBAL CELL AND GENE THERAPY SUPPLY CHAIN SOFTWARE MARKET
- 14.1. Chapter Overview
- 14.2. Assumptions and Methodology
- 14.3. Global Cell and Gene Therapy Supply Chain Software Market, Historical Trends (since 2018) and Forecasted Estimates (till 2035)
- 14.3.1. Scenario Analysis
- 14.3.1.1. Conservative Scenario
- 14.3.1.2. Optimistic Scenario
- 14.3.1. Scenario Analysis
- 14.4. Key Market Segmentations
- 14.5. Dynamic Dashboard
15. CELL AND GENE THERAPY SUPPLY CHAIN SOFTWARE MARKET, BY PROCESS COMPONENT
- 15.1. Chapter Overview
- 15.2. Key Assumptions and Methodology
- 15.3. Cell and Gene Therapy Supply Chain Software Market: Distribution by Process Component, 2018, 2024 and 2035
- 15.3.1. Cell and Gene Therapy Supply Chain Software Market for Sample Collection and Processing Component: Historical Trends (since 2018) and Forecasted Estimates (till 2035) (USD Million)
- 15.3.2. Cell and Gene Therapy Supply Chain Software Market for Manufacturing Component: Historical Trends (since 2018) and Forecasted Estimates (till 2035)
- 15.3.3. Cell and Gene Therapy Supply Chain Software Market for Logistics Component: Historical Trends (since 2018) and Forecasted Estimates (till 2035)
- 15.3.4. Cell and Gene Therapy Supply Chain Software Market for Patient Identification and Treatment Follow-Up Component: Historical Trends (since 2018) and Forecasted Estimates (till 2035)
- 15.4. Data Triangulation and Validation
16. CELL AND GENE THERAPY SUPPLY CHAIN SOFTWARE MARKET, BY TYPE OF SOFTWARE
- 16.1. Chapter Overview
- 16.2. Key Assumptions and Methodology
- 16.3. Cell and Gene Therapy Supply Chain Software Market: Distribution by Type of Software, 2018, 2024 and 2035
- 16.3.1. Cell and Gene Therapy Supply Chain Software Market for EMS: Historical Trends (since 2018) and Forecasted Estimates (till 2035)
- 16.3.2. Cell and Gene Therapy Supply Chain Software Market for LIMS: Historical Trends (since 2018) and Forecasted Estimates (till 2035)
- 16.3.3. Cell and Gene Therapy Supply Chain Software Market for IMS: Historical Trends (since 2018) and Forecasted Estimates (till 2035)
- 16.3.4. Cell and Gene Therapy Supply Chain Software Market for COP: Historical Trends (since 2018) and Forecasted Estimates (till 2035)
- 16.3.5. Cell and Gene Therapy Supply Chain Software Market for QMS: Historical Trends (since 2018) and Forecasted Estimates (till 2035)
- 16.3.6. Cell and Gene Therapy Supply Chain Software Market for LMS: Historical Trends (since 2018) and Forecasted Estimates (till 2035)
- 16.3.7. Cell and Gene Therapy Supply Chain Software Market for PMS: Historical Trends (since 2018) and Forecasted Estimates (till 2035)
- 16.4. Data Triangulation and Validation
17. CELL AND GENE THERAPY SUPPLY CHAIN SOFTWARE MARKET, BY MODE OF DEPLOYMENT
- 17.1. Chapter Overview
- 17.2. Key Assumptions and Methodology
- 17.3. Cell and Gene Therapy Supply Chain Software Market: Distribution by Mode of Deployment, 2018, 2024 and 2035
- 17.3.1. Cell and Gene Therapy Supply Chain Software Market for On-premise Deployment: Historical Trends (since 2018) and Forecasted Estimates (till 2035)
- 17.3.2. Cell and Gene Therapy Supply Chain Software Market for Cloud-based Deployment: Historical Trends (since 2018) and Forecasted Estimates (till 2035)
- 17.4. Data Triangulation and Validation
18. CELL AND GENE THERAPY SUPPLY CHAIN SOFTWARE MARKET, BY SCALE OF OPERATION
- 18.1. Chapter Overview
- 18.2. Key Assumptions and Methodology
- 18.3. Cell and Gene Therapy Supply Chain Software Market: Distribution by Scale of Operation, 2018, 2024 and 2035
- 18.3.1. Cell and Gene Therapy Supply Chain Software Market for Clinical Scale: Historical Trends (since 2018) and Forecasted Estimates (till 2035)
- 18.3.2. Cell and Gene Therapy Supply Chain Software Market for Commercial Scale: Historical Trends (since 2018) and Forecasted Estimates (till 2035)
- 18.4. Data Triangulation and Validation
19. CELL AND GENE THERAPY SUPPLY CHAIN SOFTWARE MARKET, BY TYPE OF END-USER
- 19.1. Chapter Overview
- 19.2. Key Assumptions and Methodology
- 19.3. Cell and Gene Therapy Supply Chain Software Market: Distribution by Type of End-User, 2018, 2024 and 2035
- 19.3.1. Cell and Gene Therapy Supply Chain Software Market for Pharmaceutical Companies: Historical Trends (since 2018) and Forecasted Estimates (till 2035)
- 19.3.2. Cell and Gene Therapy Supply Chain Software Market for Cell Therapy Labs: Historical Trends (since 2018) and Forecasted Estimates (till 2035)
- 19.3.3. Cell and Gene Therapy Supply Chain Software Market for Hospitals / Medical Centers: Historical Trends (since 2018) and Forecasted Estimates (till 2035)
- 19.3.4. Cell and Gene Therapy Supply Chain Software Market for Research Institutes / Biobanks: Historical Trends (since 2018) and Forecasted Estimates (till 2035)
- 19.4. Data Triangulation and Validation
20. CELL AND GENE THERAPY SUPPLY CHAIN SOFTWARE MARKET, BY KEY GEOGRAPHICAL REGIONS
- 20.1. Chapter Overview
- 20.2. Key Assumptions and Methodology
- 20.3. Cell and Gene Therapy Supply Chain Software Market: Distribution by Key Geographical Regions, 2018, 2024 and 2035
- 20.3.1. Cell and Gene Therapy Supply Chain Software Market in North America: Historical Trends (since 2018) and Forecasted Estimates (till 2035)
- 20.3.1.1. Cell and Gene Therapy Supply Chain Software Market in the US: Historical Trends (since 2018) and Forecasted Estimates (till 2035)
- 20.3.1.2. Cell and Gene Therapy Supply Chain Software Market in Canada: Historical Trends (since 2018) and Forecasted Estimates (till 2035)
- 20.3.2. Cell and Gene Therapy Supply Chain Software Market in Europe: Historical Trends (since 2018) and Forecasted Estimates (till 2035)
- 20.3.2.1. Cell and Gene Therapy Supply Chain Software Market in the UK: Historical Trends (since 2018) and Forecasted Estimates (till 2035)
- 20.3.2.2. Cell and Gene Therapy Supply Chain Software Market in Germany: Historical Trends (since 2018) and Forecasted Estimates (till 2035)
- 20.3.2.3. Cell and Gene Therapy Supply Chain Software Market in France: Historical Trends (since 2018) and Forecasted Estimates (till 2035)
- 20.3.2.4. Cell and Gene Therapy Supply Chain Software Market in Italy: Historical Trends (since 2018) and Forecasted Estimates (till 2035)
- 20.3.2.5. Cell and Gene Therapy Supply Chain Software Market in Switzerland: Historical Trends (since 2018) and Forecasted Estimates (till 2035)
- 20.3.2.6. Cell and Gene Therapy Supply Chain Software Market in Rest of Europe: Historical Trends (since 2018) and Forecasted Estimates (till 2035)
- 20.3.3. Cell and Gene Therapy Supply Chain Software Market in Asia-Pacific: Historical Trends (since 2018) and Forecasted Estimates (till 2035)
- 20.3.3.1. Cell and Gene Therapy Supply Chain Software Market in Australia: Historical Trends (since 2018) and Forecasted Estimates (till 2035)
- 20.3.3.2. Cell and Gene Therapy Supply Chain Software Market in China: Historical Trends (since 2018) and Forecasted Estimates (till 2035)
- 20.3.3.3. Cell and Gene Therapy Supply Chain Software Market in Japan: Historical Trends (since 2018) and Forecasted Estimates (till 2035)
- 20.3.3.4. Cell and Gene Therapy Supply Chain Software Market in India: Historical Trends (since 2018) and Forecasted Estimates (till 2035)
- 20.3.3.5. Cell and Gene Therapy Supply Chain Software Market in South Korea: Historical Trends (since 2018) and Forecasted Estimates (till 2035)
- 20.3.3.6. Cell and Gene Therapy Supply Chain Software Market in Rest of Asia-Pacific: Historical Trends (since 2018) and Forecasted Estimates (till 2035)
- 20.3.4. Cell and Gene Therapy Supply Chain Software Market in Rest of the World: Historical Trends (since 2018) and Forecasted Estimates (till 2035)
- 20.3.4.1. Cell and Gene Therapy Supply Chain Software Market in New Zealand: Historical Trends (since 2018) and Forecasted Estimates (till 2035)
- 20.3.4.2. Cell and Gene Therapy Supply Chain Software Market in Brazil: Historical Trends (since 2018) and Forecasted Estimates (till 2035)
- 20.3.4.3. Cell and Gene Therapy Supply Chain Software Market in Israel: Historical Trends (since 2018) and Forecasted Estimates (till 2035)
- 20.3.4.4. Cell and Gene Therapy Supply Chain Software Market in Other Countries: Historical Trends (since 2018) and Forecasted Estimates (till 2035)
- 20.3.1. Cell and Gene Therapy Supply Chain Software Market in North America: Historical Trends (since 2018) and Forecasted Estimates (till 2035)
- 20.4. Data Triangulation and Validation
21. CONCLUSION
22. EXECUTIVE INSIGHTS
- 22.1. Chapter Overview
- 22.2. Company A
- 22.2.1. Company Snapshot
- 22.2.2. Interview Transcript: Former Chief Business Officer
- 22.3. Company B
- 22.3.1. Company Snapshot
- 22.3.2. Interview Transcript: Chief Clinical Officer
- 22.4. Company C
- 22.4.1. Company Snapshot
- 22.4.2. Interview Transcript: Former Senior Director, Corporate Strategy and Business Development
- 22.5. Company D
- 22.5.1. Company Snapshot
- 22.5.2. Interview Transcript: International Sales and Transfusion Manager
- 22.6. Company E
- 22.6.1. Company Snapshot
- 22.6.2. Interview Transcript: Former General Manager, Cell and Gene Therapy
23. APPENDIX 1: TABULATED DATA
24. APPENDIX 2: LIST OF COMPANIES AND ORGANIZATIONS
List of Tables
- Table 5.1 Therapeutic Applications of Cell Therapies
- Table 6.1 Cell and Gene Therapy Supply Chain Software: Information on Type of Software and Key Features Offered
- Table 6.3 Cell and Gene Therapy Supply Chain Software: Information on Application Area
- Table 6.4 Cell and Gene Therapy Supply Chain Software: Information on Mode of Deployment and Scale of Operation
- Table 6.5 Cell and Gene Therapy Supply Chain Software: Information on Regulatory Guidelines Followed
- Table 6.6 Cell and Gene Therapy Supply Chain Software: Information on Type of End-User
- Table 6.7 List of Cell and Gene Therapy Supply Chain Software Developers
- Table 8.1 Cell and Gene Therapy Supply Chain Software: List of Companies Profiled
- Table 8.2 Cell and Gene Therapy Supply Chain Software: List of Other Leading Players
- Table 8.3 Azenta Life Sciences: Company Overview
- Table 8.4 Azenta Life Sciences: Supply Chain Management Solutions Portfolio
- Table 8.5 Azenta Life Sciences: Recent Developments and Future Outlook
- Table 8.6 NMDP BioTherapies: Company Overview
- Table 8.7 NMDP BioTherapies: Supply Chain Management Solutions Portfolio
- Table 8.8 NMDP BioTherapies: Recent Developments and Future Outlook
- Table 8.9 Biocair: Company Overview
- Table 8.10 Biocair: Supply Chain Management Solutions Portfolio
- Table 8.11 Biocair: Recent Developments and Future Outlook
- Table 8.12 BioLife Solutions: Company Overview
- Table 8.13 BioLife Solutions: Supply Chain Management Solutions Portfolio
- Table 8.14 BioLife Solutions: Recent Developments and Future Outlook
- Table 8.15 CareDx: Company Overview
- Table 8.16 CareDx: Supply Chain Management Solutions Portfolio
- Table 8.17 CareDX: Recent Developments and Future Outlook
- Table 8.18 Cryoport: Company Overview
- Table 8.19 Cryoport: Supply Chain Management Solutions Portfolio
- Table 8.20 Cryoport: Recent Developments and Future Outlook
- Table 8.21 Lonza: Company Overview
- Table 8.22 Lonza: Supply Chain Management Solutions Portfolio
- Table 8.23 Lonza: Recent Developments and Future Outlook
- Table 8.24 TraceLink: Company Overview
- Table 8.25 TraceLink: Supply Chain Management Solutions Portfolio
- Table 8.26 TraceLink: Recent Developments and Future Outlook
- Table 8.27 TrakCel: Company Overview
- Table 8.28 TrakCel: Supply Chain Management Solutions Portfolio
- Table 8.29 TrakCel: Recent Developments and Future Outlook
- Table 8.30 Veeva Systems: Company Overview
- Table 8.31 Veeva Systems: Supply Chain Management Solutions Portfolio
- Table 8.32 Veeva Systems: Recent Developments and Future Outlook
- Table 8.33 Emerson: Company Overview
- Table 8.34 Emerson: Supply Chain Management Solutions Portfolio
- Table 8.35 LabVantage Solutions: Company Overview
- Table 8.36 LabVantage Solutions: Supply Chain Management Solutions Portfolio
- Table 8.37 Marken: Company Overview
- Table 8.38 Marken: Supply Chain Management Solutions Portfolio
- Table 8.39 MasterControl: Company Overview
- Table 8.40 MasterControl: Supply Chain Management Solutions Portfolio
- Table 8.41 QuickSTAT: Company Overview
- Table 8.42 QuickSTAT: Supply Chain Management Solutions Portfolio
- Table 8.43 Siemens: Company Overview
- Table 8.44 Siemens: Supply Chain Management Solutions Portfolio
- Table 8.45 Stafa Cellular Therapy: Company Overview
- Table 8.46 Stafa Cellular Therapy: Supply Chain Management Solutions Portfolio
- Table 8.47 Steiner: Company Overview
- Table 8.48 Steiner: Supply Chain Management Solutions Portfolio
- Table 8.49 STEMSOFT Software: Company Overview
- Table 8.50 STEMSOFT Software: Supply Chain Management Solutions Portfolio
- Table 8.51 TECHNIDATA: Company Overview
- Table 8.52 TECHNIDATA: Supply Chain Management Solutions Portfolio
- Table 8.53 Thermo Fisher Scientific: Company Overview
- Table 8.54 Thermo Fisher Scientific: Supply Chain Management Solutions Portfolio
- Table 9.1 Cell and Gene Therapy Supply Chain Software: List of Funding and Investments, since 2014
- Table 10.1 Cell and Gene Therapy Supply Chain Software: List of Partnerships and Collaborations, since 2019
- Table 11.1 Cell and Gene Therapy Supply Chain Software: List of Platform Utilization Agreements, since 2019
- Table 22.1 TrakCel: Company Snapshot
- Table 22.2 Cell and Gene Therapy Catapult: Company Snapshot
- Table 22.3 McKesson: Company Snapshot
- Table 22.4 Inlog: Company Snapshot
- Table 22.5 Thermo Fisher Scientific: Company Snapshot
- Table 23.1 Cell and Gene Therapy Supply Chain Software: Distribution by Type of Software
- Table 23.2 Cell and Gene Therapy Supply Chain Software: Distribution by Key Features
- Table 23.3 Cell and Gene Therapy Supply Chain Software: Distribution by Application Area
- Table 23.4 Cell and Gene Therapy Supply Chain Software: Distribution by Mode of Deployment
- Table 23.5 Cell and Gene Therapy Supply Chain Software: Distribution by Type of Software and Mode of Deployment
- Table 23.6 Cell and Gene Therapy Supply Chain Software: Distribution by Scale of Operation
- Table 23.7 Cell and Gene Therapy Supply Chain Software: Distribution by Type of Software and Scale of Operation
- Table 23.8 Cell and Gene Therapy Supply Chain Software: Distribution by Regulatory Guidelines Followed
- Table 23.9 Cell and Advanced Therapies Supply Chain Management Software: Distribution by Type of End-User
- Table 23.10 Cell and Gene Therapy Supply Chain Software: Distribution by Type of Software and Type of End-User
- Table 23.11 Cell and Gene Therapy Supply Chain Software Developers: Distribution by Year of Establishment
- Table 23.12 Cell and Gene Therapy Supply Chain Software Developers: Distribution by Company Size
- Table 23.13 Cell and Gene Therapy Supply Chain Software Developers: Distribution by Year of Establishment and Company Size
- Table 23.14 Cell and Gene Therapy Supply Chain Software Developers: Distribution by Location of Headquarters (Region)
- Table 23.15 Cell and Gene Therapy Supply Chain Software Developers: Distribution by Location of Headquarters (Country)
- Table 23.16 Cell and Gene Therapy Supply Chain Software Developers: Distribution by Number of Software Solutions Offered
- Table 23.17 Most Active Players: Distribution by Number of Software Solutions Offered
- Table 23.18 Azenta Life Sciences: Annual Revenues, FY 2020 Onwards (USD Million)
- Table 23.19 NMDP BioTherapies: Annual Revenues, FY 2019 Onwards (USD Million)
- Table 23.20 BioLife Solutions: Annual Revenues, FY 2020 Onwards (USD Million)
- Table 23.21 CareDx: Annual Revenues, FY 2018 Onwards (USD Million)
- Table 23.22 Cryoport: Annual Revenues, FY 2019 Onwards (USD Million)
- Table 23.23 Lonza: Annual Revenues, FY 2019 Onwards (CHF Million)
- Table 23.24 Veeva Systems: Annual Revenues, FY 2020 Onwards (USD Million)
- Table 23.25 Funding and Investment Analysis: Cumulative Year-wise Trend, since 2014
- Table 23.26 Funding and Investment Analysis: Distribution by Amount Invested, since 2014 (USD Million)
- Table 23.27 Funding and Investment Analysis: Distribution by Type of Funding, since 2014
- Table 23.28 Funding and Investment Analysis: Distribution by Type of Funding and Amount Invested (USD Million)
- Table 23.29 Funding and Investment Analysis: Distribution of Amount Invested by Year and Type of Funding, since 2014
- Table 23.30 Funding and Investment Analysis: Geographical Distribution of Funding Instances and Amount Invested
- Table 23.31 Funding and Investment Analysis: Geographical Distribution of Funding Instances (Country)
- Table 23.32 Most Active Players: Distribution by Number of Funding Instances
- Table 23.33 Most Active Players: Distribution by Amount Raised (USD Million)
- Table 23.34 Key Investors: Distribution by Number of Funding Instances
- Table 23.35 Funding and Investment Analysis: Distribution by Type of Investor
- Table 23.36 Partnerships and Collaborations: Cumulative Year-wise Trend of Partnerships, since 2019
- Table 23.37 Partnerships and Collaborations: Distribution by Type of Partnership
- Table 23.38 Partnerships and Collaborations: Distribution by Year and Type of Partnership
- Table 23.39 Partnerships and Collaborations: Distribution by Type of Partnership and Company Size
- Table 23.40 Partnerships and Collaborations: Distribution by Type of Software Involved
- Table 23.41 Partnerships and Collaborations: Distribution by Type of Partner
- Table 23.42 Most Active Players: Distribution by Number of Partnerships
- Table 23.43 Partnerships and Collaborations: Local and International Agreements
- Table 23.44 Partnerships and Collaborations: Intracontinental and Intercontinental Agreements
- Table 23.45 Platform Utilization Agreements: Cumulative Year-wise Trend of Agreements, since 2019
- Table 23.46 Platform Utilization Agreements: Distribution by Type of Partner
- Table 23.47 Platform Utilization Agreements: Distribution by Type of Software Involved
- Table 23.48 Platform Utilization Agreements: Distribution by Type of Partner and Type of Software Involved
- Table 23.49 Platform Utilization Agreements: Distribution of Partners by Geography
- Table 23.50 Most active Players: Distribution by Number of Platform Utilization Agreements
- Table 23.51 Global Cell and Gene Therapy Supply Chain Software Market, Historical Trends (since 2018) (USD Million)
- Table 23.52 Global Cell and Gene Therapy Supply Chain Software Market, Forecasted Estimates (till 2035) Conservative, Base and Optimistic Scenarios (USD Million)
- Table 23.53 Cell and Gene Therapy Supply Chain Software Market: Distribution by Process Component, 2018, 2024 and 2035 (USD Million)
- Table 23.54 Cell and Gene Therapy Supply Chain Software Market for Sample Collection and Processing Component: Historical Trends (since 2018) (USD Million)
- Table 23.55 Cell and Gene Therapy Supply Chain Software Market for Sample Collection and Processing Component: Forecasted Estimates (till 2035), Conservative, Base and Optimistic Scenarios (USD Million)
- Table 23.56 Cell and Gene Therapy Supply Chain Software Market for Manufacturing Component: Historical Trends (since 2018) (USD Million)
- Table 23.57 Cell and Gene Therapy Supply Chain Software Market for Manufacturing Component: Forecasted Estimates (till 2035), Conservative, Base and Optimistic Scenarios (USD Million)
- Table 23.58 Cell and Gene Therapy Supply Chain Software Market for Logistics Component: Historical Trends (since 2018) (USD Million)
- Table 23.59 Cell and Gene Therapy Supply Chain Software Market for Logistics Component: Forecasted Estimates (till 2035), Conservative, Base and Optimistic Scenarios (USD Million)
- Table 23.60 Cell and Gene Therapy Supply Chain Software Market for Patient Identification and Treatment Follow-Up Component: Historical Trends (since 2018) (USD Million)
- Table 23.61 Cell and Gene Therapy Supply Chain Software Market for Patient Identification and Treatment Follow-Up Component: Forecasted Estimates (till 2035), Conservative, Base and Optimistic Scenarios (USD Million)
- Table 23.62 Cell and Gene Therapy Supply Chain Software Market: Distribution by Type of Software, 2018, 2024 and 2035 (USD Million)
- Table 23.63 Cell and Gene Therapy Supply Chain Software Market for EMS: Historical Trends (since 2018) (USD Million)
- Table 23.64 Cell and Gene Therapy Supply Chain Software Market for EMS: Forecasted Estimates (till 2035), Conservative, Base and Optimistic Scenarios (USD Million)
- Table 23.65 Cell and Gene Therapy Supply Chain Software Market for LIMS: Historical Trends (since 2018) (USD Million)
- Table 23.66 Cell and Gene Therapy Supply Chain Software Market for LIMS: Forecasted Estimates (till 2035), Conservative, Base and Optimistic Scenarios (USD Million)
- Table 23.67 Cell and Gene Therapy Supply Chain Software Market for IMS: Historical Trends (since 2018) (USD Million)
- Table 23.68 Cell and Gene Therapy Supply Chain Software Market for IMS: Forecasted Estimates (till 2035), Conservative, Base and Optimistic Scenarios (USD Million)
- Table 23.69 Cell and Gene Therapy Supply Chain Software Market for COP: Historical Trends (since 2018) (USD Million)
- Table 23.70 Cell and Gene Therapy Supply Chain Software Market for COP: Forecasted Estimates (till 2035), Conservative, Base and Optimistic Scenarios (USD Million)
- Table 23.71 Cell and Gene Therapy Supply Chain Software Market for QMS: Historical Trends (since 2018) (USD Million)
- Table 23.72 Cell and Gene Therapy Supply Chain Software Market for QMS: Forecasted Estimates (till 2035), Conservative, Base and Optimistic Scenarios (USD Million)
- Table 23.73 Cell and Gene Therapy Supply Chain Software Market for LMS: Historical Trends (since 2018) (USD Million)
- Table 23.74 Cell and Gene Therapy Supply Chain Software Market for LMS: Forecasted Estimates (till 2035), Conservative, Base and Optimistic Scenarios (USD Million)
- Table 23.75 Cell and Gene Therapy Supply Chain Software Market for PMS: Historical Trends (since 2018) (USD Million)
- Table 23.76 Cell and Gene Therapy Supply Chain Software Market for PMS: Forecasted Estimates (till 2035), Conservative, Base and Optimistic Scenarios (USD Million)
- Table 23.77 Cell and Gene Therapy Supply Chain Software Market: Distribution by Mode of Deployment, 2018, 2024 and 2035 (USD Million)
- Table 23.78 Cell and Gene Therapy Supply Chain Software Market for On-premise Deployment: Historical Trends (since 2018) (USD Million)
- Table 23.79 Cell and Gene Therapy Supply Chain Software Market for On-premise Deployment: Forecasted Estimates (till 2035), Conservative, Base and Optimistic Scenarios (USD Million)
- Table 23.80 Cell and Gene Therapy Supply Chain Software Market for Cloud-based Deployment: Historical Trends (since 2018) (USD Million)
- Table 23.81 Cell and Gene Therapy Supply Chain Software Market for Cloud-based Deployment: Forecasted Estimates (till 2035), Conservative, Base and Optimistic Scenarios (USD Million)
- Table 23.82 Cell and Gene Therapy Supply Chain Software Market: Distribution by Scale of Operation, 2018, 2024 and 2035 (USD Million)
- Table 23.83 Cell and Gene Therapy Supply Chain Software Market for Clinical Scale: Historical Trends (since 2018) (USD Million)
- Table 23.84 Cell and Gene Therapy Supply Chain Software Market for Clinical Scale: Forecasted Estimates (till 2035), Conservative, Base and Optimistic Scenarios (USD Million)
- Table 23.85 Cell and Gene Therapy Supply Chain Management Software Market for Commercial Scale: Historical Trends (since 2018) (USD Million)
- Table 23.86 Cell and Gene Therapy Supply Chain Management Software Market for Commercial Scale: Forecasted Estimates (till 2035), Conservative, Base and Optimistic Scenarios (USD Million)
- Table 23.87 Cell and Gene Therapy Supply Chain Software Market: Distribution by Type of End-User, 2018, 2024 and 2035 (USD Million)
- Table 23.88 Cell and Gene Therapy Supply Chain Software Market for Pharmaceutical Companies: Historical Trends (since 2018) (USD Million)
- Table 23.89 Cell and Gene Therapy Supply Chain Software Market for Pharmaceutical Companies: Forecasted Estimates (till 2035), Conservative, Base and Optimistic Scenarios (USD Million)
- Table 23.90 Cell and Gene Therapy Supply Chain Software Market for Cell Therapy Labs: Historical Trends (since 2018) (USD Million)
- Table 23.91 Cell and Gene Therapy Supply Chain Software Market for Cell Therapy Labs: Forecasted Estimates (till 2035), Conservative, Base and Optimistic Scenarios (USD Million)
- Table 23.92 Cell and Gene Therapy Supply Chain Software Market for Hospitals / Medical Centers: Historical Trends (since 2018) (USD Million)
- Table 23.93 Cell and Gene Therapy Supply Chain Software Market for Hospitals / Medical Centers: Forecasted Estimates (till 2035), Conservative, Base and Optimistic Scenarios (USD Million)
- Table 23.94 Cell and Gene Therapy Supply Chain Software Market for Research Institutes / Biobanks: Historical Trends (since 2018) (USD Million)
- Table 23.95 Cell and Gene Therapy Supply Chain Software Market for Research Institutes / Biobanks: Forecasted Estimates (till 2035), Conservative, Base and Optimistic Scenarios (USD Million)
- Table 23.96 Cell and Gene Therapy Supply Chain Software Market: Distribution by Key Geographical Regions, 2018, 2024 and 2035 (USD Million)
- Table 23.97 Cell and Gene Therapy Supply Chain Software Market in North America: Historical Trends (since 2018) (USD Million)
- Table 23.98 Cell and Gene Therapy Supply Chain Software Market in North America: Forecasted Estimates (till 2035), Conservative, Base and Optimistic Scenarios (USD Million)
- Table 23.99 Cell and Gene Therapy Supply Chain Software Market in the US: Historical Trends (since 2018) (USD Million)
- Table 23.100 Cell and Gene Therapy Supply Chain Software Market in the US: Forecasted Estimates (till 2035), Conservative, Base and Optimistic Scenarios (USD Million)
- Table 23.101 Cell and Gene Therapy Supply Chain Software Market in Canada: Historical Trends (since 2018) (USD Million)
- Table 23.102 Cell and Gene Therapy Supply Chain Software Market in Canada: Forecasted Estimates (till 2035), Conservative, Base and Optimistic Scenarios (USD Million)
- Table 23.103 Cell and Gene Therapy Supply Chain Software Market in Europe: Historical Trends (since 2018) (USD Million)
- Table 23.104 Cell and Gene Therapy Supply Chain Software Market in Europe: Forecasted Estimates (till 2035), Conservative, Base and Optimistic Scenarios (USD Million)
- Table 23.105 Cell and Gene Therapy Supply Chain Management Software Market in the UK: Historical Trends (since 2018) (USD Million)
- Table 23.106 Cell and Gene Therapy Supply Chain Management Software Market in the UK: Forecasted Estimates (till 2035), Conservative, Base and Optimistic Scenarios (USD Million)
- Table 23.107 Cell and Gene Therapy Supply Chain Management Software Market in Germany: Historical Trends (since 2018) (USD Million)
- Table 23.108 Cell and Gene Therapy Supply Chain Management Software Market in Germany: Forecasted Estimates (till 2035), Conservative, Base and Optimistic Scenarios (USD Million)
- Table 23.109 Cell and Gene Therapy Supply Chain Software Market in France: Historical Trends (since 2018) (USD Million)
- Table 23.110 Cell and Gene Therapy Supply Chain Software Market in France: Forecasted Estimates (till 2035), Conservative, Base and Optimistic Scenarios (USD Million)
- Table 23.111 Cell and Gene Therapy Supply Chain Software Market in Italy: Historical Trends (since 2018) (USD Million)
- Table 23.112 Cell and Gene Therapy Supply Chain Software Market in Italy: Forecasted Estimates (till 2035), Conservative, Base and Optimistic Scenarios (USD Million)
- Table 23.113 Cell and Gene Therapy Supply Chain Software Market in Switzerland: Historical Trends (since 2018) (USD Million)
- Table 23.114 Cell and Gene Therapy Supply Chain Software Market in Switzerland: Forecasted Estimates (till 2035), Conservative, Base and Optimistic Scenarios (USD Million)
- Table 23.115 Cell and Gene Therapy Supply Chain Software Market in Rest of Europe: Historical Trends (since 2018) (USD Million)
- Table 23.116 Cell and Gene Therapy Supply Chain Software Market in Rest of Europe: Forecasted Estimates (till 2035), Conservative, Base and Optimistic Scenarios (USD Million)
- Table 23.117 Cell and Gene Therapy Supply Chain Software Market in Asia-Pacific: Historical Trends (since 2018) (USD Million)
- Table 23.118 Cell and Gene Therapy Supply Chain Software Market in Asia-Pacific: Forecasted Estimates (till 2035), Conservative, Base and Optimistic Scenarios (USD Million)
- Table 23.119 Cell and Gene Therapy Supply Chain Software Market in Australia: Historical Trends (since 2018) (USD Million)
- Table 23.120 Cell and Gene Therapy Supply Chain Software Market in Australia: Forecasted Estimates (till 2035), Conservative, Base and Optimistic Scenarios (USD Million)
- Table 23.121 Cell and Gene Therapy Supply Chain Software Market in China: Historical Trends (since 2018) (USD Million)
- Table 23.122 Cell and Gene Therapy Supply Chain Software Market in China: Forecasted Estimates (till 2035), Conservative, Base and Optimistic Scenarios (USD Million)
- Table 23.123 Cell and Gene Therapy Supply Chain Software Market in Japan: Historical Trends (since 2018) (USD Million)
- Table 23.124 Cell and Gene Therapy Supply Chain Software Market in Japan: Forecasted Estimates (till 2035), Conservative, Base and Optimistic Scenarios (USD Million)
- Table 23.125 Cell and Gene Therapy Supply Chain Software Market in India: Historical Trends (since 2018) (USD Million)
- Table 23.126 Cell and Gene Therapy Supply Chain Software Market in India: Forecasted Estimates (till 2035), Conservative, Base and Optimistic Scenarios (USD Million)
- Table 23.127 Cell and Gene Therapy Supply Chain Software Market in South Korea: Historical Trends (since 2018) (USD Million)
- Table 23.128 Cell and Gene Therapy Supply Chain Software Market in South Korea: Forecasted Estimates (till 2035), Conservative, Base and Optimistic Scenarios (USD Million)
- Table 23.129 Cell and Gene Therapy Supply Chain Software Market in Rest of Asia-Pacific: Historical Trends (since 2018) (USD Million)
- Table 23.130 Cell and Gene Therapy Supply Chain Software Market in Rest of Asia-Pacific: Forecasted Estimates (till 2035), Conservative, Base and Optimistic Scenarios (USD Million)
- Table 23.131 Cell and Gene Therapy Supply Chain Software Market in Rest of the World: Historical Trends (since 2018) (USD Million)
- Table 23.132 Cell and Gene Therapy Supply Chain Software Market in Rest of the World: Forecasted Estimates (till 2035), Conservative, Base and Optimistic Scenarios (USD Million)
- Table 23.133 Cell and Gene Therapy Supply Chain Software Market in New Zealand: Historical Trends (since 2018) (USD Million)
- Table 23.134 Cell and Gene Therapy Supply Chain Software Market in New Zealand: Forecasted Estimates (till 2035), Conservative, Base and Optimistic Scenarios (USD Million)
- Table 23.135 Cell and Gene Therapy Supply Chain Software Market in Brazil: Historical Trends (since 2018) (USD Million)
- Table 23.136 Cell and Gene Therapy Supply Chain Software Market in Brazil: Forecasted Estimates (till 2035), Conservative, Base and Optimistic Scenarios (USD Million)
- Table 23.137 Cell and Gene Therapy Supply Chain Software Market in Israel: Historical Trends (since 2018) (USD Million)
- Table 23.138 Cell and Gene Therapy Supply Chain Software Market in Israel: Forecasted Estimates (till 2035), Conservative, Base and Optimistic Scenarios (USD Million)
- Table 23.139 Cell and Gene Therapy Supply Chain Software Market in Other Countries: Historical Trends (since 2018) (USD Million)
- Table 23.140 Cell and Gene Therapy Supply Chain Software Market in Other Countries: Forecasted Estimates (till 2035), Conservative, Base and Optimistic Scenarios (USD Million)
List of Figures
- Figure 2.1 Research Methodology: Project Methodology
- Figure 2.2 Research Methodology: Forecast Methodology
- Figure 2.3 Research Methodology: Robust Quality Control
- Figure 2.4 Research Methodology: Key Market Segmentations
- Figure 3.1 Lessons Learnt from Past Recessions
- Figure 4.1 Executive Summary: Cell and Gene Therapy Supply Chain Software Market Landscape
- Figure 4.2 Executive Summary: Funding and Investment Analysis
- Figure 4.3 Executive Summary: Partnerships and Collaborations
- Figure 4.4 Executive Summary: Market Forecast and Opportunity Analysis
- Figure 5.1 Classification of Advanced Therapy Medicinal Products
- Figure 5.2 Difference between Cell / Advanced Therapies and Other Biotechnology Products
- Figure 5.3 Components in the Cell and Gene Therapy Supply Chain
- Figure 5.4 Software Solutions for Cell and Gene Therapy Supply Chain Management
- Figure 5.5 Key Challenges in Cell and Gene Therapy Supply Chain
- Figure 6.1 Cell and Gene Therapy Supply Chain Software: Distribution by Type of Software
- Figure 6.2 Cell and Gene Therapy Supply Chain Software: Distribution by Key Features
- Figure 6.3 Cell and Gene Therapy Supply Chain Software: Distribution by Application Area
- Figure 6.4 Cell and Gene Therapy Supply Chain Software: Distribution by Mode of Deployment
- Figure 6.5 Cell and Gene Therapy Supply Chain Software: Distribution by Type of Software and Mode of Deployment
- Figure 6.6 Cell and Gene Therapy Supply Chain Software: Distribution by Scale of Operation
- Figure 6.7 Cell and Gene Therapy Supply Chain Software: Distribution by Type of Software and Scale of Operation
- Figure 6.8 Cell and Gene Therapy Supply Chain Software: Distribution by Regulatory Guidelines Followed
- Figure 6.9 Cell and Advanced Therapies Supply Chain Management Software: Distribution by Type of End-User
- Figure 6.10 Cell and Gene Therapy Supply Chain Software: Distribution by Type of Software and Type of End-User
- Figure 6.11 Cell and Gene Therapy Supply Chain Software Developers: Distribution by Year of Establishment
- Figure 6.12 Cell and Gene Therapy Supply Chain Software Developers: Distribution by Company Size
- Figure 6.13 Cell and Gene Therapy Supply Chain Software Developers: Distribution by Year of Establishment and Company Size
- Figure 6.14 Cell and Gene Therapy Supply Chain Software Developers: Distribution by Location of Headquarters (Region)
- Figure 6.15 Cell and Gene Therapy Supply Chain Software Developers: Distribution by Location of Headquarters (Country)
- Figure 6.16 Cell and Gene Therapy Supply Chain Software Developers: Distribution by Number of Software Solutions Offered
- Figure 6.17 Most Active Players: Distribution by Number of Software Solutions Offered
- Figure 7.1 Company Competitiveness Analysis: COP Developers
- Figure 7.2 Company Competitiveness Analysis: EMS Developers
- Figure 7.3 Company Competitiveness Analysis: IMS Developers
- Figure 7.4 Company Competitiveness Analysis: LIMS Developers
- Figure 7.5 Company Competitiveness Analysis: LMS Developers
- Figure 7.6 Company Competitiveness Analysis: PMS Developers
- Figure 7.7 Company Competitiveness Analysis: QMS Developers
- Figure 7.8 Company Competitiveness Analysis: TTS Developers
- Figure 8.1 Azenta Life Sciences: Annual Revenues, FY 2020 Onwards (USD Million)
- Figure 8.2 NMDP BioTherapies: Annual Revenues, FY 2019 Onwards (USD Million)
- Figure 8.3 BioLife Solutions: Annual Revenues, FY 2020 Onwards (USD Million)
- Figure 8.4 CareDx: Annual Revenues, FY 2018 Onwards (USD Million)
- Figure 8.5 Cryoport: Annual Revenues, FY 2019 Onwards (USD Million)
- Figure 8.6 Lonza: Annual Revenues, FY 2019 Onwards (CHF Million)
- Figure 8.7 Veeva Systems: Annual Revenues, FY 2020 Onwards (USD Million)
- Figure 9.1 Funding and Investment Analysis: Cumulative Year-wise Trend, since 2014
- Figure 9.2 Funding and Investment Analysis: Distribution by Amount Invested, since 2014 (USD Million)
- Figure 9.3 Funding and Investment Analysis: Distribution by Type of Funding
- Figure 9.4 Funding and Investment Analysis: Distribution by Type of Funding and Amount Invested (USD Million)
- Figure 9.5 Funding and Investment Analysis: Distribution of Amount Invested by Year and Type of Funding, since 2014
- Figure 9.6 Funding and Investment Analysis: Geographical Distribution of Funding Instances and Amount Invested
- Figure 9.7 Funding and Investment Analysis: Geographical Distribution of Funding Instances (Country)
- Figure 9.8 Most Active Players: Distribution by Number of Funding Instances
- Figure 9.9 Most Active Players: Distribution by Amount Raised (USD Million)
- Figure 9.10 Key Investors: Distribution by Number of Funding Instances
- Figure 9.11 Funding and Investment Analysis: Distribution by Type of Investor
- Figure 10.1 Partnerships and Collaborations: Cumulative Year-wise Trend of Partnerships, since 2019
- Figure 10.2 Partnerships and Collaborations: Distribution by Type of Partnership
- Figure 10.3 Partnerships and Collaborations: Distribution by Year and Type of Partnership
- Figure 10.4 Partnerships and Collaborations: Distribution by Type of Partnership and Company Size
- Figure 10.5 Partnerships and Collaborations: Distribution by Type of Software Involved
- Figure 10.6 Partnerships and Collaborations: Distribution by Type of Partner
- Figure 10.7 Most Active Players: Distribution by Number of Partnerships
- Figure 10.8 Partnerships and Collaborations: Local and International Agreements
- Figure 10.9 Partnerships and Collaborations: Intracontinental and Intercontinental Agreements
- Figure 11.1 Platform Utilization Agreements: Cumulative Year-wise Trend of Agreements, since 2019
- Figure 11.2 Platform Utilization Agreements: Distribution by Type of Partner
- Figure 11.3 Platform Utilization Agreements: Distribution by Type of Software Involved
- Figure 11.4 Platform Utilization Agreements: Distribution by Type of Partner and Type of Software Involved
- Figure 11.5 Platform Utilization Agreements: Distribution of Partners by Geography
- Figure 11.6 Most active Players: Distribution by Number of Platform Utilization Agreements
- Figure 12.1 Cell and Gene Therapy Supply Chain: Stakeholder Needs
- Figure 12.2 Relative Importance of Stakeholders Needs
- Figure 13.1 Cell and Gene Therapy Supply Chain Software: Market Drivers
- Figure 13.2 Cell and Gene Therapy Supply Chain Software: Market Restraints
- Figure 13.3 Cell and Gene Therapy Supply Chain Software: Market Opportunities
- Figure 13.4 Cell and Gene Therapy Supply Chain Software: Market Challenges
- Figure 14.1 Global Cell and Gene Therapy Supply Chain Software Market, Historical Trends (since 2018) and Forecasted Estimates (till 2035) (USD Million)
- Figure 14.2 Global Cell and Gene Therapy Supply Chain Software Market, Forecasted Estimates (till 2035): Conservative Scenario (USD Million)
- Figure 14.3 Global Cell and Gene Therapy Supply Chain Software Market, Forecasted Estimates (till 2035): Optimistic Scenario (USD Million)
- Figure 15.1 Cell and Gene Therapy Supply Chain Software Market: Distribution by Process Component, 2018, 2024 and 2035 (USD Million)
- Figure 15.2 Cell and Gene Therapy Supply Chain Software Market for Sample Collection and Processing Component, Historical Trends (since 2018) and Forecasted Estimates (till 2035) (USD million)
- Figure 15.3 Cell and Gene Therapy Supply Chain Software Market for Manufacturing Component, Historical Trends (since 2018) and Forecasted Estimates (till 2035) (USD million)
- Figure 15.4 Cell and Gene Therapy Supply Chain Software Market for Logistics Component, Historical Trends (since 2018) and Forecasted Estimates (till 2035) (USD million)
- Figure 15.5 Cell and Gene Therapy Supply Chain Software Market for Patient Identification and Treatment Follow-Up Component, Historical Trends (since 2018) and Forecasted Estimates (till 2035) (USD million)
- Figure 16.1 Cell and Gene Therapy Supply Chain Software Market: Distribution by Type of Software Solution, 2018, 2024 and 2035 (USD Million)
- Figure 16.2 Cell and Gene Therapy Supply Chain Software Market for EMS, Historical Trends (since 2018) and Forecasted Estimates (till 2035) (USD million)
- Figure 16.3 Cell and Gene Therapy Supply Chain Software Market for LIMS, Historical Trends (since 2018) and Forecasted Estimates (till 2035) (USD million)
- Figure 16.4 Cell and Gene Therapy Supply Chain Software Market for IMS, Historical Trends (since 2018) and Forecasted Estimates (till 2035) (USD million)
- Figure 16.5 Cell and Gene Therapy Supply Chain Software Market for COP, Historical Trends (since 2018) and Forecasted Estimates (till 2035) (USD million)
- Figure 16.6 Cell and Gene Therapy Supply Chain Software Market for QMS, Historical Trends (since 2018) and Forecasted Estimates (till 2035) (USD million)
- Figure 16.7 Cell and Gene Therapy Supply Chain Software Market for LMS, Historical Trends (since 2018) and Forecasted Estimates (till 2035) (USD million)
- Figure 16.8 Cell and Gene Therapy Supply Chain Software Market for PMS, Historical Trends (since 2018) and Forecasted Estimates (till 2035) (USD million)
- Figure 17.1 Cell and Gene Therapy Supply Chain Software Market: Distribution by Mode of Deployment, 2018, 2024 and 2035 (USD Million)
- Figure 17.2 Cell and Gene Therapy Supply Chain Software Market for On-premise Deployment, Historical Trends (since 2018) and Forecasted Estimates (till 2035) (USD million)
- Figure 17.3 Cell and Gene Therapy Supply Chain Software Market for Cloud-based Deployment, Historical Trends (since 2018) and Forecasted Estimates (till 2035) (USD million)
- Figure 18.1 Cell and Gene Therapy Supply Chain Software Market: Distribution by Scale of Operation, 2018, 2024 and 2035 (USD Million)
- Figure 18.2 Cell and Gene Therapy Supply Chain Software Market for Clinical Scale, Historical Trends (since 2018) and Forecasted Estimates (till 2035) (USD million)
- Figure 18.3 Cell and Gene Therapy Supply Chain Management Software Market for Commercial Scale, Historical Trends (since 2018) and Forecasted Estimates (till 2035) (USD million)
- Figure 19.1 Cell and Gene Therapy Supply Chain Software Market: Distribution by Type of End-User, 2018, 2024 and 2035 (USD Million)
- Figure 19.2 Cell and Gene Therapy Supply Chain Software Market for Pharmaceutical Companies, Historical Trends (since 2018) and Forecasted Estimates (till 2035) (USD million)
- Figure 19.3 Cell and Gene Therapy Supply Chain Software Market for Cell Therapy Labs, Historical Trends (since 2018) and Forecasted Estimates (till 2035) (USD million)
- Figure 19.4 Cell and Gene Therapy Supply Chain Software Market for Hospitals / Medical Centers, Historical Trends (since 2018) and Forecasted Estimates (till 2035) (USD million)
- Figure 19.5 Cell and Gene Therapy Supply Chain Software Market for Research Institutes / Biobanks, Historical Trends (since 2018) and Forecasted Estimates (till 2035) (USD million)
- Figure 20.1 Cell and Gene Therapy Supply Chain Software Market: Distribution by Key Geographical Regions, 2018, 2024 and 2035 (USD Million)
- Figure 20.2 Cell and Gene Therapy Supply Chain Software Market in North America, Historical Trends (since 2018) and Forecasted Estimates (till 2035) (USD million)
- Figure 20.3 Cell and Gene Therapy Supply Chain Software Market in the US, Historical Trends (since 2018) and Forecasted Estimates (till 2035) (USD million)
- Figure 20.4 Cell and Gene Therapy Supply Chain Software Market in Canada, Historical Trends (since 2018) and Forecasted Estimates (till 2035) (USD million)
- Figure 20.5 Cell and Gene Therapy Supply Chain Software Market in Europe, Historical Trends (since 2018) and Forecasted Estimates (till 2035) (USD million)
- Figure 20.6 Cell and Gene Therapy Supply Chain Management Software Market in the UK, Historical Trends (since 2018) and Forecasted Estimates (till 2035) (USD million)
- Figure 20.7 Cell and Gene Therapy Supply Chain Management Software Market in Germany, Historical Trends (since 2018) and Forecasted Estimates (till 2035) (USD million)
- Figure 20.8 Cell and Gene Therapy Supply Chain Software Market in France, Historical Trends (since 2018) and Forecasted Estimates (till 2035) (USD million)
- Figure 20.9 Cell and Gene Therapy Supply Chain Software Market in Italy, Historical Trends (since 2018) and Forecasted Estimates (till 2035) (USD million)
- Figure 20.10 Cell and Gene Therapy Supply Chain Software Market in Switzerland, Historical Trends (since 2018) and Forecasted Estimates (till 2035) (USD million)
- Figure 20.11 Cell and Gene Therapy Supply Chain Software Market in Rest of Europe, Historical Trends (since 2018) and Forecasted Estimates (till 2035) (USD million)
- Figure 20.12 Cell and Gene Therapy Supply Chain Software Market in Asia-Pacific, Historical Trends (since 2018) and Forecasted Estimates (till 2035) (USD million)
- Figure 20.13 Cell and Gene Therapy Supply Chain Software Market in Australia, Historical Trends (since 2018) and Forecasted Estimates (till 2035) (USD million)
- Figure 20.14 Cell and Gene Therapy Supply Chain Software Market in China, Historical Trends (since 2018) and Forecasted Estimates (till 2035) (USD million)
- Figure 20.15 Cell and Gene Therapy Supply Chain Software Market in Japan, Historical Trends (since 2018) and Forecasted Estimates (till 2035) (USD million)
- Figure 20.16 Cell and Gene Therapy Supply Chain Software Market in India, Historical Trends (since 2018) and Forecasted Estimates (till 2035) (USD million)
- Figure 20.17 Cell and Gene Therapy Supply Chain Software Market in South Korea, Historical Trends (since 2018) and Forecasted Estimates (till 2035) (USD million)
- Figure 20.18 Cell and Gene Therapy Supply Chain Software Market in Rest of Asia-Pacific, Historical Trends (since 2018) and Forecasted Estimates (till 2035) (USD million)
- Figure 20.19 Cell and Gene Therapy Supply Chain Software Market in Rest of the World, Historical Trends (since 2018) and Forecasted Estimates (till 2035) (USD million)
- Figure 20.20 Cell and Gene Therapy Supply Chain Software Market in New Zealand, Historical Trends (since 2018) and Forecasted Estimates (till 2035) (USD million)
- Figure 20.21 Cell and Gene Therapy Supply Chain Software Market in Brazil, Historical Trends (since 2018) and Forecasted Estimates (till 2035) (USD million)
- Figure 20.22 Cell and Gene Therapy Supply Chain Software Market in Israel, Historical Trends (since 2018) and Forecasted Estimates (till 2035) (USD million)
- Figure 20.23 Cell and Gene Therapy Supply Chain Software Market in Other Countries, Historical Trends (since 2018) and Forecasted Estimates (till 2035) (USD million)
- Figure 21.1 Conclusion: Cell and Gene Therapy Supply Chain Software Market Landscape
- Figure 21.2 Conclusion: Funding and Investment Analysis
- Figure 21.3 Conclusion: Partnerships and Collaborations
- Figure 21.4 Conclusion: Market Forecast and Opportunity Analysis

