
PUBLISHER: Roots Analysis | PRODUCT CODE: 1682701

PUBLISHER: Roots Analysis | PRODUCT CODE: 1682701
Liquid Biopsy Market by Application, Target Disease Indication, Type of Circulating Biomarker, Type of Sample, End-user, Type of Technique and Key Geographical Regions : Industry Trends and Global Forecasts, Till 2035
LIQUID BIOPSY MARKET: OVERVIEW
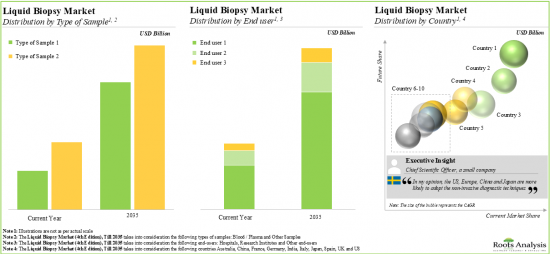
As per Roots Analysis, the global liquid biopsy market is estimated to grow from USD 6.09 billion in the current year to USD 29.8 billion by 2035, at a CAGR of 15.53% during the forecast period, till 2035.
The market sizing and opportunity analysis has been segmented across the following parameters:
Application
- Early Cancer Diagnosis
- Patient Monitoring
- Recurrence Monitoring
Target Disease Indication
- Breast Cancer
- Gastric Cancer
- Ovarian Cancer
- Leukemia
- Head and Neck Cancer
- Cervical Cancer
- Lung Cancer
- Brain Cancer
- Colorectal Cancer
- Bladder Cancer
- Liver Cancer
- Melanoma
- Nasopharyngeal cancer
- Oesophagus Cancer
- Pancreatic Cancer
- Prostate cancer
- Sarcoma
- Thyroid Cancer
Type of Circulating Biomarker
- Cell Free DNA
- Cell Free RNA
- Circulating Tumor DNA
- Exosomes
- Others Circulating Biomarkers
Type of Sample
- Blood
- Other Samples
End-user
- Hospitals
- Research Institutes
- Other end-users
Type of Technique
- Polymerase Chain Reaction
- Next Generation Sequencing
Key Geographical Regions
- North America
- Europe
- Asia-Pacific
LIQUID BIOPSY MARKET: GROWTH AND TRENDS
Cancer remains the second leading cause of the death, after cardiovascular diseases, occurring worldwide. Early screening of cancer helps in finding and curing the disease even before the symptoms are observed, and the disease is in a curable stage. Further, it allows to improve the survival rate in patients. Owing to the growing burden of cancer, the demand for non-invasive diagnostics has observed a surge in the past few years.
In the recent past, liquid biopsy has emerged as a viable technique for cancer detection. The past decade has witnessed substantial innovation in liquid biopsy platforms that have resulted in increased regulatory approvals for minimally invasive blood based liquid biopsy tests. These tests use blood samples or other bodily fluids, such as plasma or urine to identify various circulating biomarkers, including cell free DNA, circulating tumor DNA and extracellular vesicles. Driven by lucrative investments, ongoing research and development efforts, and increased involvement of prominent players, the liquid biopsy market is anticipated to witness significant growth in the foreseen future.
LIQUID BIOPSY MARKET: KEY INSIGHTS
The report delves into the current state of the liquid biopsy market and identifies potential growth opportunities within the industry. Some key findings from the report include:
1. Over 180 liquid biopsy products are commercially available / being developed by various stakeholders; of these, ~45% use next generation sequencing techniques for the detection of various cancer indications.
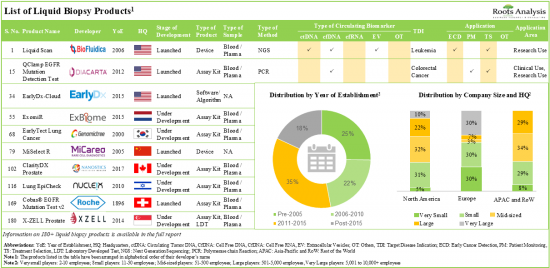
2. Close to 160 liquid biopsy products comprise of assay kits and laboratory developed tests; of these, ~55% have the capability to detect circulating tumor DNA biomarkers.
3. Over the past five years, ~110 partnerships have been established by liquid biopsy product manufacturers; of these, ~20% were established for the development of liquid biopsy product / technology.
4. Having realized the opportunity in this domain, several investors have invested around USD 7.3 billion (across over 125 funding instances) in the past nine years.
5. Driven by the growing burden of cancer and increasing investments, the market for liquid biopsy and other non-invasive cancer diagnostics is poised to witness significant growth in the foreseeable future.
6. The liquid biopsy market is projected to grow at a CAGR of ~15%, till 2035; the forecasted opportunity is likely to be distributed across various disease indications and biomarkers.
7. The growing demand for different non-invasive techniques is anticipated to drive the growth of the liquid biopsy market; the market growth is likely to be the fastest in North America and Asia-Pacific.
LIQUID BIOPSY MARKET: KEY SEGMENTS
Early Cancer Diagnosis Segment is Likely to Dominate the Liquid Biopsy Market During the Forecast Period
Based on the application, the market is segmented into early cancer diagnosis, patient monitoring and recurrence monitoring. At present, early cancer diagnosis holds the maximum share of the liquid biopsy market. This trend is likely to remain the same in the coming decade.
Breast Cancer Occupies the Largest Share of the Liquid Biopsy Market
Based on the target disease indication, the market is segmented into breast cancer, gastric cancer, ovarian cancer, leukemia, head and neck cancer, cervical cancer, lung cancer, brain cancer, colorectal cancer, bladder cancer, liver cancer, melanoma, nasopharyngeal cancer, oesophagus cancer, pancreatic cancer, prostate cancer, sarcoma and thyroid cancer. Currently, breast cancer captures the highest proportion of the liquid biopsy market. It is worth highlighting that the liquid biopsy market for leukemia is likely to grow at a relatively higher CAGR.
Circulating tumor DNA is the Preferred Biomarkers of the Liquid Biopsy Market
Based on the type of circulating biomarker, the market is segmented into cell free DNA, cell free RNA, circulating tumor DNA, exosomes and others circulating biomarkers. At present, circulating tumor DNA holds the maximum share of the liquid biopsy market. It is worth highlighting that the liquid biopsy market for exosomes is likely to grow at a relatively higher CAGR.
Blood Segment is Likely to Dominate the Liquid Biopsy Market During the Forecast Period
Based on the type of sample, the market is segmented into blood and other samples. At present, blood samples hold the maximum share of the liquid biopsy market. This trend is likely to remain the same in the coming decade.
Currently, Hospitals / Laboratories Occupies the Largest Share of the Liquid Biopsy Market
Based on the end-users, the market is segmented into hospitals / laboratories, research institutes and other end-users. It is worth highlighting that, currently, hospitals / laboratories hold a larger share of the liquid biopsy market. This trend is unlikely to change in the near future.
Next-Generation Sequencing Segment is the Fastest Growing Segment of the Liquid Biopsy Market During the Forecast Period
Based on the type of technique, the market is segmented into polymerase chain reaction and next generation sequencing. At present, polymerase chain reaction holds the maximum share of the liquid biopsy market. It is worth highlighting that the liquid biopsy market for next generation sequencing is likely to grow at a relatively higher CAGR.
North America Accounts for the Largest Share of the Market
Based on key geographical regions, the market is segmented into North America, Europe and Asia-Pacific. The majority share is expected to be captured by players based in North America. It is worth highlighting that the majority share is expected to be captured by players based in North America.
Example Players in the Liquid Biopsy Market
- Amoy Diagnostics
- ArcherDX
- Biocartis
- Cell Search
- CellMax Life
- Datar Cancer Genetics
- DiaCarta, EONE-DIAGNOMICS
- Exosome Diagnostics
- GeneCast Biotechnology
- Integrated DNA Technologies
- Lucence
- MDNA Life Sciences
- Miltenyi Biotec
- NeoGenomics
- ONCODE Scientific
- OncoDNA
- QIAGEN
- PANAGENE
- Personal Genome Diagnostics
- Predicin
- ScreenCell
- Tecan
- Thermo Fisher Scientific
Primary Research Overview
The opinions and insights presented in this study were influenced by discussions conducted with multiple stakeholders. The research report features detailed transcripts of interviews held with the following industry stakeholders:
- Director, Mid-sized Company, US
- Innovation Director, Mid-sized Company, Spain
- Founder and Medical Director, Small Company, Australia
- Founder and Chief Executive Officer, Small Company, India
- Chief Executive Officer, Small Company, Australia
- Chairman, Small Company, US
- Founder, President and Chief Technology Officer, Small Company, US
- Former Founder, Small Company, US
- Former Chief Executive Officer and Co-founder, Small Company, US
- Former Chief Executive Officer, Mid-sized Company, US
- Chief Operating Officer and Co-Founder, Small Company, Canada
- Chief Medical Officer, Mid-sized Company, US
- Chief Scientific Officer, Small Company, Sweden
- Chief Scientific Officer, Mid-sized Company, US
- Former Marketing Director, Mid-sized Company, Belgium
- Former Sales and Marketing Manager, Small Company, Italy
- Former Strategic Technology Advisor, Small Company, Australia
LIQUID BIOPSY MARKET: RESEARCH COVERAGE
- Market Sizing and Opportunity Analysis: The report features an in-depth analysis of the liquid biopsy market, focusing on key market segments, including [A] application, [B] target disease indication, [C] type of circulating biomarker, [D] type of sample, [E] end-user, [F] stage of development, [G] type of product, [H] type of technique, [I] application area and [J] key geographical regions.
- Market Landscape: A comprehensive evaluation of liquid biopsy products, considering various parameters, such as [A] stage of development, [B] type of product, [C] type of sample, [D] type of technique, [E] type of circulating biomarker, [F] target disease indication, [G] application and [H] application area. In addition, it provides a list of players engaged in manufacturing liquid biopsy products, along with the information on their [I] year of establishment, [J] company size (based on number of employees), [K] location of headquarters (region), [L] location of headquarters (country), [M] most active players (in terms of number of liquid biopsy products).
- Non-Invasive Cancer Screening and Diagnosis: An overview on the need for non invasive cancer diagnostics and their importance; it also features different imaging techniques, screening assays and advanced approaches used for diagnosis of cancer along with their advantages and disadvantages.
- Company Profiles: In-depth profiles of key industry players manufacturing liquid biopsy products, focusing on [A] company overviews, [B] financial information (if available), [C] product portfolio, [D] recent developments and [E] an informed future outlook.
- Partnerships and Collaborations: An analysis of partnerships established in this sector, since 2020, based on several parameters, such as [A] year of partnership, [B] type of partnership, [C] type of partner, [D] type of circulating biomarker, [E] target disease indication, [F] most active players. This section also highlights the regional distribution of partnership activity in this market.
- Funding and Investment Analysis: A detailed evaluation of the investments made in the liquid biopsy domain, encompassing seed financing, venture capital, capital raised from IPOs, secondary offerings, grants / awards, other equity and debt financing, based on several parameters, such as [A] year of investment, [B] amount invested, [C] type of funding, [D] type of circulating biomarker, [E] target disease indication, [F] application area, [G] geography, [H] most active players (in terms of number of funding instances and amount invested) and [I] leading investors (in terms of number of funding instances).
- Product Competitiveness Analysis: A comprehensive competitive analysis of liquid biopsy products, examining factors, such as [A] supplier strength, [B] product competitiveness and [C] company size.
- Big Pharma Analysis: A comprehensive examination of various initiatives focused on liquid biopsy products undertaken by major pharmaceutical companies. This analysis covers various relevant parameters, such as [A] number of initiatives, [B] type of initiative, [C] stage of development, [D] type of product, [E] type of circulating biomarker, [F] target disease indication, [G] application and [H] application area.
- Key Acquisition Targets: A detailed analysis of the key acquisition targets, taking into consideration the historical trend of the acquisition activity of the players that have acquired other firms. It offers a means for other industry stakeholders to identify potential acquisition targets.
- Other Non-Invasive Cancer Diagnostics: A detailed overview of the various non invasive diagnostic tests other than liquid biopsies, being manufactured by various companies for cancer screening and early detection.
- Market Impact Analysis: The report analyzes various factors such as drivers, restraints, opportunities, and challenges affecting the market growth.
KEY QUESTIONS ANSWERED IN THIS REPORT
- How many companies are currently engaged in this market?
- Which are the leading companies in this market?
- What kind of partnership models are commonly adopted by industry stakeholders?
- What factors are likely to influence the evolution of this market?
- What is the current and future market size?
- What is the CAGR of this market?
- How is the current and future market opportunity likely to be distributed across key market segments?
REASONS TO BUY THIS REPORT
- The report provides a comprehensive market analysis, offering detailed revenue projections of the overall market and its specific sub-segments. This information is valuable to both established market leaders and emerging entrants.
- Stakeholders can leverage the report to gain a deeper understanding of the competitive dynamics within the market. By analyzing the competitive landscape, businesses can make informed decisions to optimize their market positioning and develop effective go-to-market strategies.
- The report offers stakeholders a comprehensive overview of the market, including key drivers, barriers, opportunities, and challenges. This information empowers stakeholders to stay abreast of market trends and make data-driven decisions to capitalize on growth prospects.
ADDITIONAL BENEFITS
- Complimentary PPT Insights Packs
- Complimentary Excel Data Packs for all Analytical Modules in the Report
- 10% Free Content Customization
- Detailed Report Walkthrough Session with Research Team
- Free Updated report if the report is 6-12 months old or older
TABLE OF CONTENTS
1. PREFACE
- 1.1. Introduction
- 1.2. Market Share Insights
- 1.3. Key Market Insights
- 1.4. Report Coverage
- 1.5. Key Questions Answered
- 1.6. Chapter Outlines
2. RESEARCH METHODOLOGY
- 2.1. Chapter Overview
- 2.2. Research Assumptions
- 2.3. Project Methodology
- 2.4. Forecast Methodology
- 2.5. Robust Quality Control
- 2.6. Key Market Segmentations
- 2.7. Key Considerations
- 2.7.1. Demographics
- 2.7.2. Economic Factors
- 2.7.3. Government Regulations
- 2.7.4. Supply Chain
- 2.7.5. COVID Impact / Related Factors
- 2.7.6. Market Access
- 2.7.7. Healthcare Policies
- 2.7.8. Industry Consolidation
3. ECONOMIC AND OTHER PROJECT SPECIFIC CONSIDERATIONS
- 3.1. Chapter Overview
- 3.2. Market Dynamics
- 3.2.1. Time Period
- 3.2.1.1. Historical Trends
- 3.2.1.2. Current and Forecasted Estimates
- 3.2.2. Currency Coverage
- 3.2.2.1. Overview of Major Currencies Affecting the Market
- 3.2.2.2. Impact of Currency Fluctuations on the Industry
- 3.2.3. Foreign Exchange Impact
- 3.2.3.1. Evaluation of Foreign Exchange Rates and Their Impact on Market
- 3.2.3.2. Strategies for Mitigating Foreign Exchange Risk
- 3.2.4. Recession
- 3.2.4.1. Historical Analysis of Past Recessions and Lessons Learnt
- 3.2.4.2. Assessment of Current Economic Conditions and Potential Impact on the Market
- 3.2.5. Inflation
- 3.2.5.1. Measurement and Analysis of Inflationary Pressures in the Economy
- 3.2.5.2. Potential Impact of Inflation on the Market Evolution
- 3.2.1. Time Period
4. EXECUTIVE SUMMARY
5. INTRODUCTION
- 5.1. Chapter Overview
- 5.2. Cancer Statistics and Burden of the Disease
- 5.3. Importance of Early Cancer Detection
- 5.4. Cancer Screening and Diagnosis
- 5.5. Conventional Invasive Cancer Diagnostic Tests
- 5.5.1. Biopsy
- 5.5.2. Fine Needle Aspiration Biopsy
- 5.5.3. Core Needle Aspiration Biopsy
- 5.5.4. Vacuum-Assisted Biopsy
- 5.5.5. Image Guided Biopsy
- 5.5.6. Sentinel Node Biopsy
- 5.5.7. Surgical Biopsy
- 5.5.8. Endoscopic Biopsy
- 5.5.9. Bone Marrow Biopsy
- 5.5.10. Endoscopy
- 5.6. Need for Non-Invasive Approaches
- 5.7. Liquid Biopsy: Diagnosing Circulating Biomarkers
- 5.7.1. Circulating Tumor Cells
- 5.7.2. Circulating Tumor DNA/ Cell Free DNA
- 5.7.3. Exosomes
- 5.8. Costs and Benefits Associated with Liquid Biopsy and Non-Invasive Tests
- 5.9. Latest Intellectual Property Trends in Non-Invasive Cancer Diagnostics
- 5.10. Challenges Associated with Non-Invasive Cancer Diagnostics
- 5.11. Future Perspectives
6. NON-INVASIVE CANCER SCREENING AND DIAGNOSIS
- 6.1. Chapter Overview
- 6.2. Diagnostic Imaging
- 6.2.1. Magnetic Resonance Imaging (MRI)
- 6.2.2. Mammography
- 6.2.3. Bone Scan
- 6.2.4. Computerized Tomography (CT) Scan
- 6.2.5. Integrated Positron Emission Tomography (PET)- CT Scan
- 6.2.6. Ultrasound
- 6.2.7. X-ray Radiography (Barium Enema)
- 6.3. Screening Assays
- 6.3.1. Circulating Tumor Marker Test
- 6.3.2. Digital Rectal Exam (DRE)
- 6.3.3. Fecal Occult Blood Test (FOBT)
- 6.3.4. Multigated Acquisition (MUGA) Scan
- 6.3.5. Papanicolaou Test and Human Papilloma Virus Test
- 6.4. Advanced Non-Invasive Approaches
- 6.4.1. Cytogenetic / Gene Expression Studies
- 6.4.2. Molecular Signature-based Non-Invasive Methods
- 6.4.3. Saliva-based Oral Cancer Diagnostics
- 6.4.4. Vital Staining
- 6.4.5. Optical Biopsy
- 6.4.6. Other Diagnostic Techniques
7. LIQUID BIOPSY: MARKET LANDSCAPE
- 7.1. Chapter Overview
- 7.2. Liquid Biopsy Products: Overall Market Landscape
- 7.2.1. Analysis by Stage of Development
- 7.2.2. Analysis by Type of Product
- 7.2.3. Analysis by Type of Sample
- 7.2.4. Analysis by Type of Technique
- 7.2.5. Analysis by Type of Circulating Biomarker
- 7.2.6. Analysis by Target Disease Indication
- 7.2.7. Analysis by Type of Tumor
- 7.2.8. Analysis by Application
- 7.2.9. Analysis by Application Area
- 7.3. Liquid Biopsy Product Manufacturers
- 7.3.1. Analysis by Year of Establishment
- 7.3.2. Analysis by Company Size
- 7.3.3. Analysis by Location of Headquarters (Region)
- 7.3.4. Analysis by Location of Headquarters (Country)
- 7.3.5. Most Active Players: Analysis by Number of Liquid Biopsy Products
- 7.4. Liquid Biopsy Products: Other Liquid Biopsy Products, Kits and Consumables
- 7.5. Liquid Biopsy Products: Contract Service Providers
8. COMPANY PROFILES
- 8.1. Chapter Overview
- 8.1.1. Amoy Diagnostics
- 8.1.1.1. Company Overview
- 8.1.1.2. Liquid Biopsy Product Portfolio
- 8.1.1.3. Recent Developments and Future Outlook
- 8.1.2. ArcherDX
- 8.1.2.1. Company Overview
- 8.1.2.2. Liquid Biopsy Product Portfolio
- 8.1.2.3. Recent Developments and Future Outlook
- 8.1.3. DiaCarta
- 8.1.3.1. Company Overview
- 8.1.3.2. Liquid Biopsy Product Portfolio
- 8.1.3.3. Recent Developments and Future Outlook
- 8.1.4. Integrated DNA Technologies
- 8.1.4.1. Company Overview
- 8.1.4.2. Liquid Biopsy Product Portfolio
- 8.1.4.3. Recent Developments and Future Outlook
- 8.1.5. MDNA Life Sciences
- 8.1.5.1. Company Overview
- 8.1.5.2. Financial Information
- 8.1.5.3. Liquid Biopsy Product Portfolio
- 8.1.5.4. Recent Developments and Future Outlook
- 8.1.6. NeoGenomics
- 8.1.6.1. Company Overview
- 8.1.6.2. Liquid Biopsy Product Portfolio
- 8.1.6.3. Recent Developments and Future Outlook
- 8.1.7. ONCODE Scientific
- 8.1.7.1. Company Overview
- 8.1.7.2. Liquid Biopsy Product Portfolio
- 8.1.7.3. Recent Developments and Future Outlook
- 8.1.8. QIAGEN
- 8.1.8.1. Company Overview
- 8.1.8.2. Financial Information
- 8.1.8.3. Liquid Biopsy Product Portfolio
- 8.1.8.4. Recent Developments and Future Outlook
- 8.1.9. ScreenCell
- 8.1.9.1. Company Overview
- 8.1.9.2. Financial Information
- 8.1.9.3. Liquid Biopsy Product Portfolio
- 8.1.9.4. Recent Developments and Future Outlook
- 8.1.10. Thermo Fisher Scientific
- 8.1.10.1. Company Overview
- 8.1.10.2. Financial Information
- 8.1.10.3. Liquid Biopsy Product Portfolio
- 8.1.10.4. Recent Developments and Future Outlook
- 8.1.1. Amoy Diagnostics
- 8.2. Other Leading Players in Liquid Biopsy Market
- 8.2.1. Biocartis
- 8.2.1.1. Company Overview
- 8.2.1.2. Liquid Biopsy Product Portfolio
- 8.2.2. Cell Search
- 8.2.2.1. Company Overview
- 8.2.2.2. Liquid Biopsy Product Portfolio
- 8.2.3. CellMax Life
- 8.2.3.1. Company Overview
- 8.2.3.2. Liquid Biopsy Product Portfolio
- 8.2.4. Datar Cancer Genetics
- 8.2.4.1. Company Overview
- 8.2.4.2. Liquid Biopsy Product Portfolio
- 8.2.5. EONE-DIAGNOMICS Genome Center
- 8.2.5.1. Company Overview
- 8.2.5.2. Liquid Biopsy Product Portfolio
- 8.2.6. Exosome Diagnostics
- 8.2.6.1. Company Overview
- 8.2.6.2. Liquid Biopsy Product Portfolio
- 8.2.7. GeneCast Biotechnology
- 8.2.7.1. Company Overview
- 8.2.7.2. Liquid Biopsy Product Portfolio
- 8.2.8. Inivata
- 8.2.8.1. Company Overview
- 8.2.8.2. Liquid Biopsy Product Portfolio
- 8.2.9. Lucence
- 8.2.9.1. Company Overview
- 8.2.9.2. Liquid Biopsy Product Portfolio
- 8.2.10. Miltenyi Biotec
- 8.2.10.1. Company Overview
- 8.2.10.2. Liquid Biopsy Product Portfolio
- 8.2.11. OncoDNA
- 8.2.11.1. Company Overview
- 8.2.11.2. Liquid Biopsy Product Portfolio
- 8.2.12. PANAGENE
- 8.2.12.1. Company Overview
- 8.2.12.2. Liquid Biopsy Product Portfolio
- 8.2.13. Personal Genome Diagnostics
- 8.2.13.1. Company Overview
- 8.2.13.2. Liquid Biopsy Product Portfolio
- 8.2.14. Predicine
- 8.2.14.1. Company Overview
- 8.2.14.2. Liquid Biopsy Product Portfolio
- 8.2.15. Tecan
- 8.2.15.1. Company Overview
- 8.2.15.2. Liquid Biopsy Product Portfolio
- 8.2.1. Biocartis
9. PARTNERSHIPS AND COLLABORATIONS
- 9.1. Chapter Overview
- 9.2. Partnership Models
- 9.3. Liquid Biopsy: Partnerships and Collaborations
- 9.3.1. Analysis by Year of Partnership
- 9.3.2. Analysis by Type of Partnership
- 9.3.3. Analysis by Year and Type of Partnership
- 9.3.4. Analysis by Purpose of Agreement
- 9.3.5. Analysis by Type of Partner
- 9.3.6. Analysis by Year of Partnership and Type of Partner
- 9.3.7. Analysis by Type of Circulating Biomarker
- 9.3.8. Analysis by Target Disease Indication
- 9.3.9. Most Active Players: Analysis by Number of Partnerships
- 9.3.10. Analysis by Geography
- 9.3.10.1. Local and International Agreements
- 9.3.10.2. Intercontinental and Intracontinental Agreements
10. FUNDING AND INVESTMENT ANALYSIS
- 10.1. Chapter Overview
- 10.2. Types of Funding
- 10.3. Liquid Biopsy: Funding and Investment Analysis
- 10.3.1. Analysis by Year of Investment
- 10.3.2. Analysis by Amount Invested
- 10.3.3. Analysis by Type of Funding
- 10.3.4. Analysis of Amount Invested by Type of Funding
- 10.3.5. Analysis by Year of Investment and Type of Funding
- 10.3.6. Analysis by Type of Circulating Biomarker
- 10.3.7. Analysis by Target Disease Indication
- 10.3.8. Analysis by Application
- 10.3.9. Analysis by Geography
- 10.3.10. Most Active Players: Analysis by Number of Funding Instances
- 10.3.11. Most Active Players: Analysis by Amount Raised
- 10.3.12. Most Active Investors: Analysis by Number of Funding Instances
11. PRODUCT COMPETITIVENESS ANALYSIS
- 11.1. Chapter Overview
- 11.2. Methodology
- 11.3. Assumptions and Key Parameters
- 11.4. Liquid Biopsy: Product Competitiveness Analysis
- 11.4.1. Liquid Biopsy Assay Kits
- 11.4.1.1. Liquid Biopsy Assay Kits Offered by Players based in North America
- 11.4.1.2. Liquid Biopsy Assay Kits Offered by Players based in Europe
- 11.4.1.3. Liquid Biopsy Assay Kits Offered by Players based in Asia-Pacific and Rest of the World
- 11.4.1.4. Products Offered by Players based in Rest of the World
- 11.4.2. Liquid Biopsy Devices
- 11.4.3. Liquid Biopsy Software
- 11.4.1. Liquid Biopsy Assay Kits
12. BIG PHARMA INITIATIVES
- 12.1. Chapter Overview
- 12.2. Scope and Methodology
- 12.3. Liquid Biopsy Related Initiatives of Top Big Pharma Companies
- 12.3.1. Analysis by Type of Initiative
- 12.3.2. Analysis by Stage of Development
- 12.3.3. Analysis by Type of Product
- 12.3.4. Analysis by Type of Circulating Biomarker
- 12.3.5. Analysis by Target Disease Indication
- 12.3.6. Analysis by Application
- 12.3.7. Analysis by Application Area
13. KEY ACQUISITION TARGETS
- 13.1. Chapter Overview
- 13.2. Scope and Methodology
- 13.3. Scoring Criteria and Key Assumptions
- 13.4. Potential Acquisition Targets in North America
- 13.5. Potential Acquisition Targets in Europe
- 13.6. Potential Acquisition Targets in Asia-Pacific and Rest of the World
- 13.7. Concluding Remarks
14. OTHER NON-INVASIVE CANCER DIAGNOSTICS
- 14.1. Chapter Overview
- 14.2. Non-Blood-based Biomarker Detection Tests
- 14.3. Fecal Occult Blood Test (FOBT) and Fecal Immunochemical Tests (FIT)
- 14.4. Pigmented Lesion Assays
- 14.5. Stool DNA (sDNA)-based Tests
- 14.6. Volatile Organic Compound (VOC) Detection Tests
- 14.7. List of Other Non-Invasive Cancer Diagnostics
15. MARKET IMPACT ANALYSIS: DRIVERS, RESTRAINTS, OPPORTUNITIES AND CHALLENGES
- 15.1. Chapter Overview
- 15.2. Market Drivers
- 15.3. Market Restraints
- 15.4. Market Opportunities
- 15.5. Market Challenges
- 15.6. Conclusion
16. GLOBAL LIQUID BIOPSY MARKET
- 16.1. Chapter Overview
- 16.2. Key Assumptions and Methodology
- 16.3. Global Liquid Biopsy Market, Historical Trends (since 2018) and Forecasted Estimates (till 2035)
- 16.3.1. Scenario Analysis
- 16.3.1.1. Conservative Scenario
- 16.3.1.2. Optimistic Scenario
- 16.3.1. Scenario Analysis
- 16.4. Key Market Segmentations
17. LIQUID BIOPSY MARKET, BY APPLICATION
- 17.1. Chapter Overview
- 17.2. Key Assumptions and Methodology
- 17.3. Liquid Biopsy Market: Distribution by Application, 2018, 2023 and 2035
- 17.3.1. Early Cancer Diagnosis: Historical Trends (since 2018) and Forecasted Estimates (till 2035)
- 17.3.2. Patient Monitoring: Historical Trends (since 2018) and Forecasted Estimates (till 2035)
- 17.3.3. Recurrence Monitoring: Historical Trends (since 2018) and Forecasted Estimates (till 2035)
- 17.3. Data Triangulation and Validation
18. LIQUID BIOPSY MARKET, BY TARGET DISEASE INDICATION
- 18.1. Chapter Overview
- 18.2. Key Assumptions and Methodology
- 18.3. Liquid Biopsy Market: Distribution by Target Disease Indication, 2018, 2023 and 2035
- 18.3.1. Breast Cancer: Historical Trends (since 2018) and Forecasted Estimates (till 2035)
- 18.3.2. Gastric Cancer: Historical Trends (since 2018) and Forecasted Estimates (till 2035)
- 18.3.3. Ovarian Cancer: Historical Trends (since 2018) and Forecasted Estimates (till 2035)
- 18.3.4. Leukemia: Historical Trends (since 2018) and Forecasted Estimates (till 2035)
- 18.3.5. Head and Neck Cancer: Historical Trends (since 2018) and Forecasted Estimates (till 2035)
- 18.3.6. Cervical Cancer: Historical Trends (since 2018) and Forecasted Estimates (till 2035)
- 18.3.7. Lung Cancer: Historical Trends (since 2018) and Forecasted Estimates (till 2035)
- 18.3.8. Brain Cancer: Historical Trends (since 2018) and Forecasted Estimates (till 2035)
- 18.3.9. Colorectal Cancer: Historical Trends (since 2018) and Forecasted Estimates (till 2035)
- 18.3.10. Bladder Cancer: Historical Trends (since 2018) and Forecasted Estimates (till 2035)
- 18.3.11. Liver Cancer: Historical Trends (since 2018) and Forecasted Estimates (till 2035)
- 18.3.12. Melanoma Cancer: Historical Trends (since 2018) and Forecasted Estimates (till 2035)
- 18.3.13. Nasopharyngeal Cancer: Historical Trends (since 2018) and Forecasted Estimates (till 2035)
- 18.3.14. Esophagus Cancer: Historical Trends (since 2018) and Forecasted Estimates (till 2035)
- 18.3.15. Pancreatic Cancer: Historical Trends (since 2018) and Forecasted Estimates (till 2035)
- 18.3.16. Prostate Cancer: Historical Trends (since 2018) and Forecasted Estimates (till 2035)
- 18.3.17. Sarcoma: Historical Trends (since 2018) and Forecasted Estimates (till 2035)
- 18.3.18. Thyroid Cancer: Historical Trends (since 2018) and Forecasted Estimates (till 2035)
- 18.4. Data Triangulation and Validation
19. LIQUID BIOPSY MARKET, BY TYPE OF CIRCULATING BIOMARKER
- 19.1. Chapter Overview
- 19.2. Key Assumptions and Methodology
- 19.3. Liquid Biopsy Market: Distribution by Type of Circulating Biomarker, 2018, 2023 and 2035
- 19.3.1. Circulating Tumor DNA: Historical Trends (since 2018) and Forecasted Estimates (till 2035)
- 19.3.2. Cell-Free DNA: Historical Trends (since 2018) and Forecasted Estimates (till 2035)
- 19.3.3. Cell-Free RNA: Historical Trends (since 2018) and Forecasted Estimates (till 2035)
- 19.3.4. Exosomes: Historical Trends (since 2018) and Forecasted Estimates (till 2035)
- 19.3.5. Other Circulating Biomarkers: Historical Trends (since 2018) and Forecasted Estimates (till 2035)
- 19.4. Data Triangulation and Validation
20. LIQUID BIOPSY MARKET, BY TYPE OF SAMPLE
- 20.1. Chapter Overview
- 20.2. Key Assumptions and Methodology
- 20.3. Liquid Biopsy Market: Distribution by Type of Sample, 2018, 2023 and 2035
- 20.3.1. Blood / Plasma Samples: Historical Trends (since 2018) and Forecasted Estimates (till 2035)
- 20.3.2. Other Samples: Historical Trends (since 2018) and Forecasted Estimates (till 2035)
- 20.4. Data Triangulation and Validation
21. LIQUID BIOPSY MARKET, BY TYPE OF TECHNIQUE
- 21.1. Chapter Overview
- 21.2. Key Assumptions and Methodology
- 21.3. Liquid Biopsy Market: Distribution by Type of Technique, 2018, 2023 and 2035
- 21.3.1. Polymerase Chain Reaction: Historical Trends (since 2018) and Forecasted Estimates (till 2035)
- 21.3.2. Next Generation Sequencing: Historical Trends (since 2018) and Forecasted Estimates (till 2035)
- 21.4. Data Triangulation and Validation
22. LIQUID BIOPSY MARKET, BY TYPE OF END-USER
- 22.1. Chapter Overview
- 22.2. Key Assumptions and Methodology
- 22.3. Liquid Biopsy Market: Distribution by Type of End-User, 2018, 2023 and 2035
- 22.3.1. Hospitals / Laboratories: Historical Trends (since 2018) and Forecasted Estimates (till 2035)
- 22.3.2. Research Institutes: Historical Trends (since 2018) and Forecasted Estimates (till 2035)
- 22.3.3. Other End-users: Historical Trends (since 2018) and Forecasted Estimates (till 2035)
- 22.4. Data Triangulation and Validation
23. LIQUID BIOPSY MARKET, BY KEY GEOGRAPHICAL REGIONS
- 23.1. Chapter Overview
- 23.2. Key Assumptions and Methodology
- 23.3. Liquid Biopsy Market: Distribution by Country, 2018, 2023 and 2035
- 23.3.1. US: Historical Trends (since 2018) and Forecasted Estimates (till 2035)
- 23.3.2. UK: Historical Trends (since 2018) and Forecasted Estimates (till 2035)
- 23.3.3. Germany: Historical Trends (since 2018) and Forecasted Estimates (till 2035)
- 23.3.4. France: Historical Trends (since 2018) and Forecasted Estimates (till 2035)
- 23.3.5. Italy: Historical Trends (since 2018) and Forecasted Estimates (till 2035)
- 23.3.6. Spain: Historical Trends (since 2018) and Forecasted Estimates (till 2035)
- 23.3.7. Australia: Historical Trends (since 2018) and Forecasted Estimates (till 2035)
- 23.3.8. Japan: Historical Trends (since 2018) and Forecasted Estimates (till 2035)
- 23.3.9. China: Historical Trends (since 2018) and Forecasted Estimates (till 2035)
- 23.3.10. India: Historical Trends (since 2018) and Forecasted Estimates (till 2035)
- 23.4. Data Triangulation and Validation
24. SURVEY INSIGHTS
- 24.1. Chapter Overview
- 24.2. Company Specifics of Respondents
- 24.3. Analysis by Seniority Level of Respondents
- 24.4. Analysis by Product Portfolio
- 24.5. Analysis by Type of Products / Services Offered
- 24.6. Analysis by Stage of Development of Product
- 24.7. Analysis by Application
- 24.8. Analysis by Likely Market Size
25. CONCLUSION
26. EXECUTIVE INSIGHTS
- 26.1. Chapter Overview
- 26.2. Director, Company A
- 26.3. Innovation Director, Company B
- 26.4. Founder and Chief Executive Officer, Company C
- 26.5. President and Chief Technology Officer, Company D
- 26.6. Strategic Technology Advisor, Company E
- 26.7. Founder and Medical Director, Company F
- 26.8. Chief Executive Officer, Company G
- 26.9. Chief Operating Officer, Company H
- 26.10. Chief Medical Officer, Company I
- 26.11. President and Chief Executive Officer, Company J
- 26.12. Sales and Marketing Manager, Company K
- 26.13. Marketing Director, Company L
- 26.14. Founder, Company M
- 26.15. Chief Executive Officer, Company N
- 26.16. Christer Ericsson, Chief Scientific Officer, Company O
- 26.17. Chief Executive Officer and Co-founder, Company P
- 26.18. Chief Scientific Officer, Company Q
27. APPENDIX 1: TABULATED DATA
28. APPENDIX 2: LIST OF COMPANIES AND ORGANIZATIONS
List of Tables
- Table 5.1 Survival on Early Diagnosis of Cancer
- Table 5.2 Cost of Biopsy for Different Cancer Indications (USD)
- Table 5.3 Common Conventional Endoscopic Procedures
- Table 6.1 Examples of Tumor Markers
- Table 7.1 Liquid Biopsy Products: Overall Market Landscape
- Table 7.2 Liquid Biopsy Products: Information on Type of Circulating Biomarker, Target Disease Indication and Type of Tumor
- Table 7.3 Liquid Biopsy Products: Information on Application, Application Area, Availability of Proprietary Technology and Availability of Artificial Intelligence
- Table 7.4 Liquid Biopsy Products: List of Manufacturers
- Table 7.5 Liquid Biopsy Products: List of Other Liquid Biopsy Products
- Table 7.6 Liquid Biopsy Products: List of Other Kits and Consumables
- Table 7.7 Liquid Biopsy Products: List of Contract Service Providers
- Table 8.1 Liquid Biopsy Manufactures: List of Companies Profiled
- Table 8.2 Amoy Diagnostics: Company Snapshot
- Table 8.3 Amoy Diagnostics: Liquid Biopsy Product Portfolio
- Table 8.4 Amoy Diagnostics: Recent Developments and Future Outlook
- Table 8.5 DiaCarta: Company Snapshot
- Table 8.6 DiaCarta: Liquid Biopsy Product Portfolio
- Table 8.7 Integrated DNA Technologies: Company Snapshot
- Table 8.8 Integrated DNA Technologies: Liquid Biopsy Product Portfolio
- Table 8.9 Integrated DNA Technologies: Recent Developments and Future Outlook
- Table 8.10 MDNA Life Sciences: Company Snapshot
- Table 8.11 MDNA Life Sciences: Liquid Biopsy Product Portfolio
- Table 8.12 NeoGenomics: Company Snapshot
- Table 8.13 NeoGenomics: Liquid Biopsy Product Portfolio
- Table 8.14 NeoGenomics: Recent Developments and Future Outlook
- Table 8.15 ONCODE Scientific: Company Snapshot
- Table 8.16 ONCODE Scientific: Liquid Biopsy Product Portfolio
- Table 8.17 QIAGEN: Company Snapshot
- Table 8.18 QIAGEN: Liquid Biopsy Product Portfolio
- Table 8.19 ScreenCell: Company Snapshot
- Table 8.20 ScreenCell: Liquid Biopsy Product Portfolio
- Table 8.21 Thermo Fisher Scientific: Company Snapshot
- Table 8.22 Thermo Fisher Scientific: Liquid Biopsy Product Portfolio
- Table 8.23 Thermo Fisher Scientific: Recent Developments and Future Outlook
- Table 8.24 Biocartis: Company Snapshot
- Table 8.25 Biocartis: Liquid Biopsy Product Portfolio
- Table 8.26 CellMax Life: Company Snapshot
- Table 8.27 CellMax Life: Liquid Biopsy Product Portfolio
- Table 8.28 Datar Cancer Genetics: Company Snapshot
- Table 8.29 Datar Cancer Genetics: Liquid Biopsy Product Portfolio
- Table 8.30 EONE-DIAGNOMICS: Company Snapshot
- Table 8.31 EONE-DIAGNOMICS: Liquid Biopsy Product Portfolio
- Table 8.32 Exosome Diagnostics: Company Snapshot
- Table 8.33 Exosome Diagnostics: Liquid Biopsy Product Portfolio
- Table 8.34 GeneCast Biotechnology: Company Snapshot
- Table 8.35 GeneCast Biotechnology: Liquid Biopsy Product Portfolio
- Table 8.36 Helio Genomics: Company Snapshot
- Table 8.37 Helio Genomics: Liquid Biopsy Product Portfolio
- Table 8.38 Lucence: Company Snapshot
- Table 8.39 Lucence: Liquid Biopsy Product Portfolio
- Table 8.40 Miltenyi Biotec: Company Snapshot
- Table 8.41 Miltenyi Biotec: Liquid Biopsy Product Portfolio
- Table 8.42 OncoDNA: Company Snapshot
- Table 8.43 OncoDNA: Liquid Biopsy Product Portfolio
- Table 8.44 PANAGENE: Company Snapshot
- Table 8.45 PANAGENE: Liquid Biopsy Product Portfolio
- Table 8.46 Personal Genome Diagnostics: Company Snapshot
- Table 8.47 Personal Genome Diagnostics: Liquid Biopsy Product Portfolio
- Table 8.48 Roche Diagnostics: Company Snapshot
- Table 8.49 Roche Diagnostics: Liquid Biopsy Product Portfolio
- Table 8.50 Tecan: Company Snapshot
- Table 8.51 Tecan: Liquid Biopsy Product Portfolio
- Table 9.1 Liquid Biopsy Market: List of Partnerships and Collaborations
- Table 9.2 Liquid Biopsy: Partnerships and Collaborations: Information on Type of Circulating Biomarker, Target Disease Indication, Type of Agreement (Country and Region)
- Table 10.1 Liquid Biopsy Market: List of Funding and Investments
- Table 11.1 Product Competitiveness Analysis: Information on Peer Groups
- Table 12.1 Liquid Biopsy: List of Key Acquisitions
- Table 12.2 Potential Strategic Acquisition Targets in North America
- Table 12.3 Potential Strategic Acquisition Targets in Europe
- Table 12.4 Potential Strategic Acquisition Targets in Asia-Pacific / Rest of the World
- Table 14.1 List of Other Non-Invasive Cancer Diagnostics
- Table 24.1 Survey Insights: Overview of Respondents
- Table 24.2 Survey Insights: Designation and Seniority Levels
- Table 24.3 Survey Insights: Type of Liquid Biopsy Product Portfolio
- Table 24.4 Survey Insights: Type of Products / Services Offered
- Table 24.5 Survey Insights: Stage of Development of Products
- Table 24.6 Survey Insights: Application Area
- Table 24.7 Survey Insights: Likely Liquid Biopsy Market Size (2035)
- Table 24.8 Survey Insights: Likely Other Non-Invasive Cancer Diagnostics Market Size
- Table 27.1 Worldwide Incidence of Cancer: Distribution by Target Indication
- Table 27.2 Breast Cancer: Estimated New Cases (in Thousands)
- Table 27.3 Lung Cancer: Estimated New Cases (in Thousands)
- Table 27.4 Colorectal Cancer: Estimated New Cases (in Thousands)
- Table 27.5 Liquid Biopsy Products: Distribution by Stage of Development
- Table 27.6 Liquid Biopsy Products: Distribution by Type of Product
- Table 27.7 Liquid Biopsy Products: Distribution by Type of Sample
- Table 27.8 Liquid Biopsy Products: Distribution by Type of Technique
- Table 27.9 Liquid Biopsy Products: Distribution by Type of Circulating Biomarker
- Table 27.10 Liquid Biopsy Products: Distribution by Target Disease Indication
- Table 27.11 Liquid Biopsy Products: Distribution by Type of Tumor
- Table 27.12 Liquid Biopsy Products: Distribution by Application
- Table 27.13 Liquid Biopsy Products: Distribution by Application Area
- Table 27.14 Liquid Biopsy Manufacturers: Distribution by Year of Establishment
- Table 27.15 Liquid Biopsy Manufacturers: Distribution by Company Size
- Table 27.16. Liquid Biopsy Manufacturers: Distribution by Location of Headquarters (Region)
- Table 27.17 Liquid Biopsy Manufacturers: Distribution by Location of Headquarters (Country)
- Table 27.18 Most Active Players: Distribution by Number of Liquid Biopsy Products
- Table 27.19 NeoGenomics: Annual Revenues, FY 2018 Onwards (USD Million)
- Table 27.20 Thermo Fisher Scientific: Annual Revenues, FY 2018 Onwards (USD Billion)
- Table 27.21 Partnerships and Collaborations: Cumulative Year-wise Trend, since 2019
- Table 27.22 Partnerships and Collaborations: Distribution by Type of Partnership
- Table 27.23 Partnerships and Collaborations: Distribution by Year and Type of Partnership, since 2020
- Table 27.24 Partnerships and Collaborations: Distribution by Purpose of Agreement
- Table 27.25 Partnerships and Collaborations: Distribution by Type of Partner
- Table 27.26 Partnerships and Collaborations: Distribution by Year of Partnership and Type of Partner, since 2019
- Table 27.27 Partnerships and Collaborations: Distribution by Type of Circulating Biomarker
- Table 27.28 Partnerships and Collaborations: Distribution by Type of Target Disease Indication
- Table 27.29 Most Active Players: Distribution by Number of Partnerships
- Table 27.30 Partnerships and Collaborations: Local and International Agreements
- Table 27.31 Funding and Investment Analysis: Cumulative Year-wise Distribution of Funding Instances, since 2015
- Table 27.32 Funding and Investment Analysis: Cumulative Year-wise Distribution by Amount Invested, since 2015 (USD Million)
- Table 27.33 Funding and Investment Analysis: Distribution by Type of Funding
- Table 27.34. Funding and Investment Analysis: Distribution of Amount Invested by Type of Funding (USD Million)
- Table 27.35 Funding and Investment Analysis: Distribution by Type of Circulating Biomarker
- Figure 27.36 Funding and Investment Analysis: Distribution by Target Disease Indication
- Table 27.37 Funding and Investment Analysis: Distribution by Application
- Table 27.38 Most Active Players: Distribution by Number of Funding Instances
- Table 27.39 Most Active Players: Distribution by Amount Raised
- Table 27.40 Most Active Investors: Distribution by Number of Instances
- Table 27.41 Liquid Biopsy Manufacturers: Distribution by Location of Headquarters (Region)
- Table 27.42 Global Liquid Biopsy Market, Historical Trends (since 2018) and Forecasted Estimates (till 2035) (USD Billion)
- Table 27.43 Global Liquid Biopsy Market, Forecasted Estimates (till 2035) (USD Billion), Conservative Scenario (USD Billion)
- Table 27.44 Global Liquid Biopsy Market, Forecasted Estimates (till 2035) (USD Billion), Optimistic Scenario (USD Billion)
- Table 27.45 Global Liquid Biopsy Market: Distribution by Application, 2018, 2023 and 2035
- Table 27.46 Liquid Biopsy Market for Early Cancer Diagnosis: Historical Trends (since 2018) and Forecasted Estimates (till 2035)
- Table 27.47 Liquid Biopsy Market for Patient Monitoring: Historical Trends (since 2018) and Forecasted Estimates (till 2035)
- Table 27.48 Liquid Biopsy Market for Recurrence Monitoring: Historical Trends (since 2018) and Forecasted Estimates (till 2035)
- Table 27.49 Global Liquid Biopsy Market: Distribution by Target Disease Indication, 2018, 2023 and 2035
- Table 27.50 Liquid Biopsy Market for Breast Cancer: Historical Trends (since 2018) and Forecasted Estimates (till 2035)
- Table 27.51 Liquid Biopsy Market for Colorectal Cancer: Historical Trends (since 2018) and Forecasted Estimates (till 2035)
- Table 27.52 Liquid Biopsy Market for Prostate Cancer: Historical Trends (since 2018) and Forecasted Estimates (till 2035)
- Table 27.53 Liquid Biopsy Market for Bladder Cancer: Historical Trends (since 2018) and Forecasted Estimates (till 2035)
- Table 27.54 Liquid Biopsy Market for Lung Cancer: Historical Trends (since 2018) and Forecasted Estimates (till 2035)
- Table 27.55 Liquid Biopsy Market for Gastric Cancer: Historical Trends (since 2018) and Forecasted Estimates (till 2035)
- Table 27.56 Liquid Biopsy Market for Thyroid Cancer: Historical Trends (since 2018) and Forecasted Estimates (till 2035)
- Table 27.57 Liquid Biopsy Market for Head and Neck Cancer: Historical Trends (since 2018) and Forecasted Estimates (till 2035)
- Table 27.58 Liquid Biopsy Market for Melanoma Cancer: Historical Trends (since 2018) and Forecasted Estimates (till 2035)
- Table 27.59 Liquid Biopsy Market for Leukemia Cancer: Historical Trends (since 2018) and Forecasted Estimates (till 2035)
- Table 27.60 Liquid Biopsy Market for Liver Cancer: Historical Trends (since 2018) and Forecasted Estimates (till 2035)
- Table 27.61 Liquid Biopsy Market for Cervical: Historical Trends (since 2018) and Forecasted Estimates (till 2035)
- Table 27.62 Liquid Biopsy Market for Ovarian Cancer: Historical Trends (since 2018) and Forecasted Estimates (till 2035)
- Table 27.63 Liquid Biopsy Market for Pancreatic Cancer: Historical Trends (since 2018) and Forecasted Estimates (till 2035)
- Table 27.64 Liquid Biopsy Market for Brain Cancer: Historical Trends (since 2018) and Forecasted Estimates (till 2035)
- Table 27.65 Liquid Biopsy Market for Esophagus Cancer: Historical Trends (since 2018) and Forecasted Estimates (till 2035)
- Table 27.66 Liquid Biopsy Market for Nasopharyngeal: Historical Trends (since 2018) and Forecasted Estimates (till 2035)
- Table 27.67 Liquid Biopsy Market for Sarcoma Cancer: Historical Trends (since 2018) and Forecasted Estimates (till 2035)
- Table 27.68 Liquid Biopsy Market: Distribution by Type of Circulating Biomarker, 2018, 2023 and 2035
- Table 27.69 Liquid Biopsy Market for Circulating Tumor DNA: Historical Trends (since 2018) and Forecasted Estimates (till 2035)
- Table 27.70 Liquid Biopsy Market for Cell Free DNA: Historical Trends (since 2018) and Forecasted Estimates (till 2035)
- Table 27.71 Liquid Biopsy Market for Cell Free RNA: Historical Trends (since 2018) and Forecasted Estimates (till 2035)
- Table 27.72 Liquid Biopsy Market for Exosomes: Historical Trends (since 2018) and Forecasted Estimates
- Table 27.73 Liquid Biopsy Market for Other Circulating Biomarkers: Historical Trends (since 2018) and Forecasted Estimates
- Table 27.74 Liquid Biopsy Market: Distribution by Type of Sample, 2018, 2023 and 2035
- Table 27.75 Liquid Biopsy Market for Blood / Plasma Samples: Historical Trends (since 2018) and Forecasted Estimates (till 2035)
- Table 27.76 Liquid Biopsy Market for Other Samples: Historical Trends (since 2018) and Forecasted Estimates (till 2035)
- Table 27.77 Liquid Biopsy Market: Distribution by Type of Technique, 2018, 2023 and 2035
- Table 27.78 Liquid Biopsy Market for Polymerase Chain Reaction: Historical Trends (since 2018) and Forecasted Estimates (till 2035) (USD Million)
- Table 27.79 Liquid Biopsy Market for Next Generation Sequencing: Historical Trends (since 2018) and Forecasted Estimates (till 2035) (USD Million)
Table 27. 80 Liquid Biopsy Market: Distribution by End user, 2018, 2023 and 2035
Table 27. 81 Liquid Biopsy Market for Hospitals / Laboratories: Historical Trends (since 2018) and Forecasted Estimates (till 2035)
- Table 27.82 Liquid Biopsy for Research Institutes: Historical Trends (since 2018) and Forecasted Estimates (till 2035)
- Table 27.83 Liquid Biopsy Market for Other End-users: Historical Trends (since 2018) and Forecasted Estimates (till 2035)
- Table 27.84 Liquid Biopsy Market: Distribution by Countries, 2018, 2023 and 2035
- Table 27.85 Liquid Biopsy Market in the US: Historical Trends (since 2018) and Forecasted Estimates (till 2035) (USD Million)
- Table 27.86 Liquid Biopsy Market in the UK: Historical Trends (since 2018) and Forecasted Estimates (till 2035) (USD Million)
- Table 27.87 Liquid Biopsy Market in Germany: Historical Trends (since 2018) and Forecasted Estimates (till 2035) (USD Million)
- Table 27.88 Liquid Biopsy Market in France: Historical Trends (since 2018) and Forecasted Estimates (till 2035) (USD Million)
- Table 27.89 Liquid Biopsy Market in Italy: Historical Trends (since 2018) and Forecasted Estimates (till 2035) (USD Million)
- Table 27.90 Liquid Biopsy Market in Spain: Historical Trends (since 2018) and Forecasted Estimates (till 2035) (USD Million)
- Table 27.91 Liquid Biopsy Market in Australia: Historical Trends (since 2018) and Forecasted Estimates (till 2035) (USD Million)
- Table 27.92 Liquid Biopsy Market in Japan: Historical Trends (since 2018) and Forecasted Estimates (till 2035) (USD Million)
- Table 27.93 Liquid Biopsy Market in China: Historical Trends (since 2018) and Forecasted Estimates (till 2035) (USD Million)
- Table 27.94 Liquid Biopsy Market in India: Historical Trends (since 2018) and Forecasted Estimates (till 2035) (USD Million)
List of Figures
- Figure 2.1 Research Methodology: Project Methodology
- Figure 2.2 Research Methodology: Forecast Methodology
- Figure 2.3 Research Methodology: Robust Quality Control
- Figure 2.4 Research Methodology: Key Market Segmentations
- Figure 4.1 Executive Summary: Market Landscape of Liquid Biopsy
- Figure 4.2 Executive Summary: Partnerships and Collaborations
- Figure 4.3 Executive Summary: Funding and Investment Analysis
- Figure 4.4 Executive Summary: Market Forecast and Opportunity Analysis
- Figure 5.1 Worldwide Incidence of Cancer: Distribution by Target Indication
- Figure 5.2 Breast Cancer: Estimated New Cases (in Thousands)
- Figure 5.3 Lung Cancer: Estimated New Cases (in Thousands)
- Figure 5.4 Colorectal Cancer: Estimated New Cases (in Thousands)
- Figure 5.5 Factors to Determine Before Cancer Screening
- Figure 5.6 Conventional Cancer Diagnosis Methods
- Figure 5.7 Disadvantages of Invasive Techniques
- Figure 5.8 Process of Detecting Circulating Biomarkers
- Figure 5.9 Traditional Biopsy: Process Flow
- Figure 5.10 Non-Invasive Tests: Process Flow
- Figure 5.11 Comparison of Liquid Biopsy and Traditional Tissue Biopsy
- Figure 5.12 Non-Invasive Cancer Diagnostics: Year-wise Distribution of Patents
- Figure 6.1 Non-Invasive Cancer Screening and Diagnostic Techniques
- Figure 6.2 Types of Diagnostic Imaging Products
- Figure 6.3 Types of Screening Assays
- Figure 6.4 Types of Advanced Non-Invasive Approaches for Cancer Diagnosis
- Figure 7.1 Liquid Biopsy Products: Distribution by Stage of Development
- Figure 7.2. Liquid Biopsy Products: Distribution by Type of Product
- Figure 7.3. Liquid Biopsy Products: Distribution by Type of Sample
- Figure 7.4. Liquid Biopsy Products: Distribution by Type of Technique
- Figure 7.5. Liquid Biopsy Products: Distribution by Type of Circulating Biomarker
- Figure 7.6. Liquid Biopsy Products: Distribution by Target Disease Indication
- Figure 7.7. Liquid Biopsy Products: Distribution by Type of Tumor
- Figure 7.8. Liquid Biopsy Products: Distribution by Application
- Figure 7.9. Liquid Biopsy Products: Distribution by Application Area
- Figure 7.10 Liquid Biopsy Product Manufacturers: Distribution by Year of Establishment
- Figure 7.11 Liquid Biopsy Product Manufacturers: Distribution by Company Size
- Figure 7.12 Liquid Biopsy Product Manufacturers: Distribution by Location of Headquarters (Region)
- Figure 7.13 Liquid Biopsy Product Manufacturers: Distribution by Location of Headquarters (Country)
- Figure 7.14 Most Active Players: Distribution by Number of Liquid Biopsy Products
- Figure 8.1 NeoGenomics: Annual Revenues, FY 2018 Onwards (USD Million)
- Figure 8.2 Thermo Fisher Scientific: Annual Revenues, FY 2018 Onwards (USD Billion)
- Figure 9.1 Partnerships and Collaborations: Cumulative Year-wise Trend
- Figure 9.2 Partnerships and Collaborations: Distribution by Type of Partnership
- Figure 9.3 Partnerships and Collaborations: Distribution by Year and Type of Partnership
- Figure 9.4 Partnerships and Collaborations: Distribution by Purpose of Agreement
- Figure 9.5 Partnerships and Collaborations: Distribution by Type of Partner
- Figure 9.6 Partnerships and Collaborations: Distribution by Year of Partnership and Type of Partner
- Figure 9.7 Partnerships and Collaborations: Distribution by Type of Circulating Biomarker
- Figure 9.8 Partnerships and Collaborations: Distribution by Target Disease Indication
- Figure 9.9 Most Active Players: Distribution by Number of Partnerships
- Figure 9.10 Partnerships and Collaborations: Local and International Agreements
- Figure 9.11 Partnerships and Collaborations: Intercontinental and Intracontinental Agreements
- Figure 10.1 Funding and Investment Analysis: Cumulative Year-wise Trend
- Figure 10.2 Funding and Investment Analysis: Cumulative Year-wise Distribution by Amount Invested (USD Million)
- Figure 10.3 Funding and Investment Analysis: Distribution by Type of Funding
- Figure 10.4 Funding and Investment Analysis: Distribution of Amount Invested by Type of Funding (USD Million)
- Figure 10.5 Funding and Investment Analysis: Distribution by Year of Investment and Type of Funding (USD Million)
- Figure 10.6 Funding and Investment Analysis: Distribution by Type of Circulating Biomarker
- Figure 10.7 Funding and Investment Analysis: Distribution by Target Disease Indication
- Figure 10.8 Funding and Investment Analysis: Distribution by Application
- Figure 10.9 Most Active Players: Distribution by Number of Instances
- Figure 10.10 Most Active Players: Distribution by Amount Raised (USD Million)
- Figure 10.11 Most Active Investors: Distribution by Number of Instances
- Figure 10.12 Funding and Investment Analysis: Distribution by Geography (Region)
- Figure 10.13 Funding and Investment Analysis: Distribution by Geography (Country)
- Figure 11.1 Product Competitiveness Analysis: Liquid Biopsy Assay Kits Offered by Players based in North America
- Figure 11.2 Product Competitiveness Analysis: Liquid Biopsy Assay Kits Offered by Players based in Europe
- Figure 11.3 Product Competitiveness Analysis: Liquid Biopsy Assay Kits Offered by Players based in Asia-Pacific and Rest of the World
- Figure 11.4 Product Competitiveness Analysis: Liquid Biopsy Devices
- Figure 11.5 Product Competitiveness Analysis: Liquid Biopsy Software
- Figure 12.1 Liquid Biopsy Related Initiatives: Spider Web Analysis of Top Big Pharma Companies
- Figure 12.2 Big Pharma Players: Distribution by Type of Initiative
- Figure 12.3 Big Pharma Players: Distribution by Stage of Development
- Figure 12.4 Big Pharma Initiatives: Distribution by Type of Product
- Figure 12.5 Big Pharma Initiatives: Distribution by Type of Circulating Biomarker
- Figure 12.6 Big Pharma Initiatives: Distribution by Target Disease Indication
- Figure 12.7 Big Pharma Initiatives: Distribution by Application
- Figure 12.8 Big Pharma Initiatives: Distribution by Application Area
- Figure 15.1 Market Drivers
- Figure 15.2 Market Restraints
- Figure 15.3 Market Opportunities
- Figure 15.4 Market Challenges
- Figure 16.1 Global Liquid Biopsy Market, Historical Trends (since 2018) and Forecasted Estimates (till 2035) (USD Billion)
- Figure 16.2 Global Liquid Biopsy Market, Forecasted Estimates (till 2035), Conservative Scenario (USD Billion)
- Figure 16.3 Global Liquid Biopsy Market, Forecasted Estimates (till 2035): Optimistic Scenario (USD Billion)
- Figure 17.1 Liquid Biopsy Market: Distribution by Application, 2018, 2023 and 2035
- Figure 17.2 Liquid Biopsy Market for Early Cancer Diagnosis: Historical Trends (since 2018) and Forecasted Estimates (till 2035) (USD Million)
- Figure 17.3 Liquid Biopsy Market for Patient Monitoring: Historical Trends (since 2018) and Forecasted Estimates (till 2035)
- Figure 17.4 Liquid Biopsy Market for Recurrence Monitoring: Historical Trends (since 2018) and Forecasted Estimates (till 2035)
- Figure 18.1 Liquid Biopsy Market: Distribution by Target Disease Indication, 2018, 2023 and 2035
- Figure 18.2 Liquid Biopsy Market for Breast Cancer: Historical Trends (since 2018) and Forecasted Estimates (till 2035)
- Figure 18.3 Liquid Biopsy Market for Colorectal Cancer: Historical Trends (since 2018) and Forecasted Estimates (till 2035)
- Figure 18.4 Liquid Biopsy Market for Prostate Cancer: Historical Trends (since 2018) and Forecasted Estimates (till 2035)
- Figure 18.5 Liquid Biopsy Market for Bladder Cancer: Historical Trends (since 2018) and Forecasted Estimates (till 2035)
- Figure 18.6 Liquid Biopsy Market for Lung Cancer: Historical Trends (since 2018) and Forecasted Estimates (till 2035)
- Figure 18.7 Liquid Biopsy Market for Gastric Cancer: Historical Trends (since 2018) and Forecasted Estimates (till 2035)
- Figure 18.8 Liquid Biopsy Market for Thyroid Cancer: Historical Trends (since 2018) and Forecasted Estimates (till 2035)
- Figure 18.9 Liquid Biopsy Market for Head and Neck Cancer: Historical Trends (since 2018) and Forecasted Estimates (till 2035)
- Figure 18.10 Liquid Biopsy Market for Melanoma Cancer: Historical Trends (since 2018) and Forecasted Estimates (till 2035)
- Figure 18.11 Liquid Biopsy Market for Leukemia Cancer: Historical Trends (since 2018) and Forecasted Estimates (till 2035)
- Figure 18.12 Liquid Biopsy Market for Liver Cancer: Historical Trends (since 2018) and Forecasted Estimates (till 2035)
- Figure 18.13 Liquid Biopsy Market for Cervical: Historical Trends (since 2018) and Forecasted Estimates (till 2035)
- Figure 18.14 Liquid Biopsy Market for Ovarian Cancer: Historical Trends (since 2018) and Forecasted Estimates (till 2035)
- Figure 18.15 Liquid Biopsy Market for Pancreatic Cancer: Historical Trends (since 2018) and Forecasted Estimates (till 2035)
- Figure 18.16 Liquid Biopsy Market for Brain Cancer: Historical Trends (since 2018) and Forecasted Estimates (till 2035)
- Figure 18.17 Liquid Biopsy Market for Esophagus Cancer: Historical Trends (since 2018) and Forecasted Estimates (till 2035)
- Figure 18.18 Liquid Biopsy Market for Nasopharyngeal : Historical Trends (since 2018) and Forecasted Estimates (till 2035)
- Figure 18.19 Liquid Biopsy Market for Sarcoma Cancer: Historical Trends (since 2018) and Forecasted Estimates (till 2035)
- Figure 19.1 Liquid Biopsy Market: Distribution by Type of Circulating Biomarker, 2018, 2023 and 2035
- Figure 19.2 Liquid Biopsy Market for Circulating Tumor DNA: Historical Trends (since 2018) and Forecasted Estimates (till 2035)
- Figure 19.3 Liquid Biopsy Market for Cell Free DNA: Historical Trends (since 2018) and Forecasted Estimates (till 2035)
- Figure 19.4 Liquid Biopsy Market for Cell Free RNA: Historical Trends (since 2018) and Forecasted Estimates (till 2035)
- Figure 19.5 Liquid Biopsy Market for Exosomes: Historical Trends (since 2018) and Forecasted Estimates
- Figure 19.6 Liquid Biopsy Market for Other Circulating Biomarkers: Historical Trends (since 2018) and Forecasted Estimates
- Figure 20.1 Liquid Biopsy Market: Distribution by Type of Sample, 2018, 2023 and 2035
- Figure 20.2 Liquid Biopsy Market for Blood / Plasma Samples: Historical Trends (since 2018) and Forecasted Estimates (till 2035)
- Figure 20.3 Liquid Biopsy Market for Other Samples: Historical Trends (since 2018) and Forecasted Estimates (till 2035)
- Figure 21.1 Liquid Biopsy Market: Distribution by Type of Technique, 2018, 2023 and 2035
- Figure 21.2 Liquid Biopsy Market for Polymerase Chain Reaction: Historical Trends (since 2018) and Forecasted Estimates (till 2035) (USD Million)
- Figure 21.3 Liquid Biopsy Market for Next Generation Sequencing: Historical Trends (since 2018) and Forecasted Estimates (till 2035) (USD Million)
- Figure 22.1 Liquid Biopsy Market: Distribution by End user, 2018, 2023 and 2035
- Figure 22.2 Liquid Biopsy Market for Hospitals / Laboratories: Historical Trends (since 2018) and Forecasted Estimates (till 2035)
- Figure 22.3 Liquid Biopsy for Research Institutes: Historical Trends (since 2018) and Forecasted Estimates (till 2035)
- Figure 22.4. Liquid Biopsy Market for Other End-users: Historical Trends (since 2018) and Forecasted Estimates (till 2035)
- Figure 23.1 Liquid Biopsy Market: Distribution by Countries, 2018, 2023 and 2035
- Figure 23.2 Liquid Biopsy Market in the US: Historical Trends (since 2018) and Forecasted Estimates (till 2035) (USD Million)
- Figure 23.3 Liquid Biopsy Market in the UK: Historical Trends (since 2018) and Forecasted Estimates (till 2035) (USD Million)
- Figure 23.4 Liquid Biopsy Market in Germany: Historical Trends (since 2018) and Forecasted Estimates (till 2035) (USD Million)
- Figure 23.5 Liquid Biopsy Market in France: Historical Trends (since 2018) and Forecasted Estimates (till 2035) (USD Million)
- Figure 23.6 Liquid Biopsy Market in Italy: Historical Trends (since 2018) and Forecasted Estimates (till 2035) (USD Million)
- Figure 23.7 Liquid Biopsy Market in Spain: Historical Trends (since 2018) and Forecasted Estimates (till 2035) (USD Million)
- Figure 23.8 Liquid Biopsy Market in Australia: Historical Trends (since 2018) and Forecasted Estimates (till 2035) (USD Million)
- Figure 23.9 Liquid Biopsy Market in Japan: Historical Trends (since 2018) and Forecasted Estimates (till 2035) (USD Million)
- Figure 23.10 Liquid Biopsy Market in China: Historical Trends (since 2018) and Forecasted Estimates (till 2035) (USD Million)
- Figure 23.11 Liquid Biopsy Market in India: Historical Trends (since 2018) and Forecasted Estimates (till 2035) (USD Million)
- Figure 24.1 Survey Insights: Distribution of Respondents by Year of Establishment of Company
- Figure 24.2 Survey Insights: Distribution of Respondents by Company Size
- Figure 24.3 Survey Insights: Distribution of Respondents by Location of Headquarters
- Figure 24.4 Survey Insights: Distribution by Seniority Level of Respondents
- Figure 24.5 Survey Insights: Distribution by Type of Product Portfolio
- Figure 24.6 Survey Insights: Distribution by Type of Products / Services Offered
- Figure 24.7 Survey Insights: Distribution by Stage of Development of Product
- Figure 24.8 Survey Insights: Distribution by Application
- Figure 24.9 Survey Insights: Likely Market Size of Liquid Biopsy (2035)
- Figure 24.10 Survey Insights: Likely Market Size of Other Non-Invasive Cancer Diagnostics Market Size (2035)
- Figure 25.1 Concluding Remarks: Market Landscape
- Figure 25.2 Concluding Remarks: Partnerships and Collaborations
- Figure 25.3 Concluding Remarks: Funding and Investment Analysis
- Figure 25.4 Concluding Remarks: Market Forecast and Sizing Opportunity (I/II)
- Figure 25.5 Concluding Remarks: Market Forecast and Sizing Opportunity (II/II)

