
PUBLISHER: Roots Analysis | PRODUCT CODE: 1849800

PUBLISHER: Roots Analysis | PRODUCT CODE: 1849800
Cell Therapy Packaging Market by Type of Therapy Packed, Package Engineering Design, Scale of Operation and Key Geographical Regions: Industry Trends and Global Forecasts, Till 2035
Cell Therapy Packaging Market: Overview
As per Roots Analysis, the global cell therapy packaging market is estimated to grow from USD 404 million in the current year to USD 1,225 million by 2035, at a CAGR of 11.7% during the forecast period, till 2035.
The market sizing and opportunity analysis has been segmented across the following parameters:
Type of Therapy Packed
- T-cell Therapies
- Dendritic Cell Vaccines
- Stem Cell Therapies
- NK-cell Therapies
- Other Advanced Therapy Medicinal Products
Scale of Operations
- Clinical Scale
- Commercial Scale
Package Engineering Design
- Primary Packaging
- Secondary Packaging
Key Geographical Regions
- North America
- Europe
- Asia-Pacific
- Rest of the World
Cell Therapy Packaging Market: Growth and Trends
Over the years, the pharmaceutical industry has witnessed several advancements in drug development. The domain has transitioned from a universal treatment alternative to a more tailored approach to therapy, incorporating personalized cell therapies for various disease indications. This transition has resulted in a notable shift in the pharmaceutical packaging sector as well. The packaging of cell therapies tends to be more intricate compared to small molecule therapeutics and other biologics. It necessitates specific conditions for fill / finish, storage, and transportation to preserve the sterility and viability of cells at cryogenic temperatures and strict quality standards. Due to the intricacies involved in managing cell therapies, it is essential for developers to create a strategic plan for packaging and transporting these therapies.
In the recent past, to ensure the sterility and quality of cell therapies, several developers have forged strategic partnerships with industry stakeholders to ensure the integrity of their therapeutic intervention in addition to their storage and transport. It is worth highlighting that the service providers are steadily advancing their packaging technologies beyond the conventional packaging products to meet the demand for cold chain and cryogenic environment required to maintain the stability of these novel, state-of-the-art therapies. Innovations such as automation, AI-driven analytics, closed-system production, CRISPR gene editing, and improved viral vector technologies enhance efficiency, reduce contamination risks, and lower costs, enabling scalable manufacturing for complex therapies. Thus, owing to the rising demand for cell-based therapeutics, the market for cell therapy packaging services is expected to witness substantial growth during the forecast period.
Cell Therapy Packaging Market: Key Insights
The report delves into the current state of the cell therapy packaging market and identifies potential growth opportunities within industry. Some key findings from the report include:
- Several industry players claim to have the required capabilities for packaging of different types of cell therapies; of these, 94% of the firms offer multiple additional services across different stages of product development.

- Close to 90% of the services offered by the stakeholders in this domain are for passive packaging of cell therapies; of these, nearly 50% of the players offer dry shippers as the passive system at cryogenic temperature range.
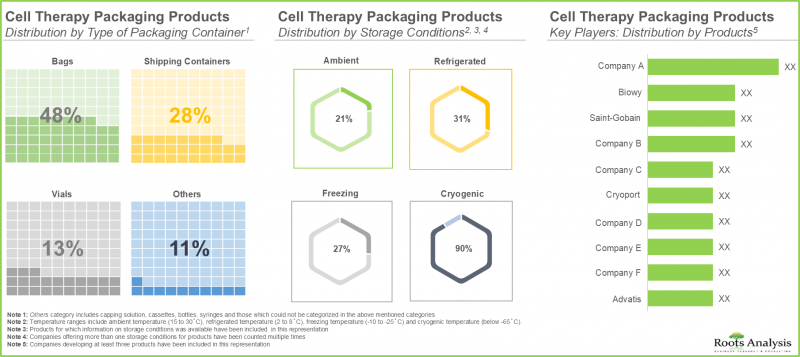
- Over 30 companies offer packaging services for cell therapies in various formats; majority of these firms are headquartered in North America.
- Nearly, 50% of the cell therapy packaging products are bags used for storage and protection of drugs; further 71% of these products offer packaging products at cryogenic temperature ranges.
- In pursuit of a competitive edge, stakeholders in this domain are actively upgrading their existing capabilities and enhancing packaging-related service portfolios.
- Since 2016, there has been a marked increase in the partnership activity in this domain; most of the recent collaborations are focused on the packaging technology / platform integration.
- As more cell therapies are anticipated to receive approval in future, developers are anticipated to forge strategic partnerships with contract service providers to outsource a part of their business operations.
- In order to meet the rising demand for cell therapy products, manufacturers have established their presence in various regions across the world; presently, the US emerged as the key manufacturing hub for cell therapies.
- The market's growth is likely to be driven by the rising demand for cell therapies; the future opportunity is expected to be well distributed across various scales of operation and geographies.
Cell Therapy Packaging Market: Key Segments
T-Cell Therapies Segment Occupies the Largest Share of the Cell Therapy Packaging Market
Based on the type of therapy packed, the market is segmented into T-cell therapies, dendritic cell cancer vaccines, stem cell therapies, NK-cell therapies, and other advanced therapy medicinal products. Owing to their proven efficacy in treating cancer effectively, the T-cell therapies segment holds the maximum share of the current cell therapy packaging market. This trend is likely to remain the same in the forthcoming years.
Commercial Scale Segment is the Fastest Growing Segment of the Cell Therapy Packaging Market During the Forecast Period
Based on the scale of operation, the market is segmented into clinical and commercial scale. While clinical accounts for a higher market share, it is worth highlighting that the commercial scale segment is expected to witness substantial market growth in the coming years.
Currently, the Primary Packaging Segment Occupies the Largest Share of the Cell Therapy Packaging Market
Based on the package engineering designs, the market is segmented into primary and secondary packaging. At present, primary packaging holds the maximum share of the cell therapy packaging market and this trend is likely to remain the same in the forthcoming years. This can be attributed to the numerous advantages of primary packaging, such as protection, ease of use, cost-effectiveness and dosage control.
Asia-Pacific Accounts for the Largest Share of the Market
Based on the key geographical regions, the market is segmented into North America, Europe, Asia-Pacific and the Rest of the world. It is worth highlighting that, over the years, the market in Europe is expected to grow at a higher CAGR.
Primary Research Overview
- Founder and Owner, Small Company, Germany
- Chief Financial Officer, Small Company, Germany
- Chief Business Officer, Small Company, US
- Senior Director of Scientific Affairs and Technical Marketing, Small Company, US
- Vice President, Peptides, Large Company, Ireland
- Senior Manager, Peptide Business Project Leader, Large Company, Japan
Example Players in the Cell Therapy Packaging Market
- Almac
- Catalent Biologics
- Cryoport Systems
- Saint-Gobain
- Thermo Fisher Scientific
- West Pharmaceuticals
- Yourway
Cell Therapy Packaging Market: Research Coverage
- Market Sizing and Opportunity Analysis: The report features an in-depth analysis of the cell therapy packaging market, focusing on key market segments, including [A] type of therapy packed, [B] scale of operation, [C] package engineering design and [D] key geographical regions.
- Market Landscape (Service Providers): A comprehensive evaluation of cell therapy packaging services providers, considering various parameters, such as [A] year of establishment, [B] company size, [C] location of headquarters, [D] type of services offered, [E] type of packaging, [F] type of passive system offered, [F] packaging engineering design, [G] phase change material used.
- Market Landscape (Cell Therapy Packaging Products): A comprehensive evaluation of cell therapy packaging products, considering various parameters, such as [A] type of packaging container, [B] type of container fabrication material, [C] raw materials for container fabrication, [D] type of cells packed, [E] storage conditions, and [F] usability of container. It also includes a detailed analysis on product providers on the basis of multiple parameters, such as their [G] year of establishment, [H] company size, [I] location of headquarters and [J] most active players (in terms of number of products).
- Company Profiles: In-depth profiles of key industry players offering cell therapy packaging products and services, focusing on [A] company overviews, [B] service / product portfolio, [C] recent developments and [D] an informed future outlook.
- Company Competitiveness Analysis: A comprehensive competitive analysis of cell therapy packaging service providers, examining factors, such as [A] service strength of a company, [B] packaging portfolio and [C] service portfolio.
- Partnerships and Collaborations: An analysis of partnerships established in this sector, since 2016, based on several parameters, such as year of partnership, type of partnership (service alliance, technology / platform integration agreement, merger and acquisition), purpose of partnership, type of service offered, and geographical location of players involved in the partnership.
- Likely Partner Analysis: A detailed evaluation of over 250 cell therapy developers that are most likely to collaborate with cell therapy packaging providers. This analysis considers various relevant parameters, including [A] developer strength (based on company size), [B] type of therapy and [C] pipeline maturity (based on stage of development of drug candidates).
- Case Study: A case study highlighting the companies that are engaged in the development and manufacturing of cell therapies, along with the information on their [A] year of establishment, [B] company size, [C] location of headquarters and [D] location of manufacturing facility. Further, the chapter includes a detailed analysis on [E] type of cells manufactured, [F] source of cells, [G] scale of operation and [H] manufacturing capabilities / services of the aforementioned companies.
Key Questions Answered in this Report
- How many companies are currently engaged in this market?
- Which are the leading companies in this market?
- Which cell therapy developers are most likely to collaborate with service providers?
- What factors are likely to influence the evolution of this market?
- What is the current and future market size?
- What is the CAGR of this market?
- How is the current and future market opportunity likely to be distributed across key market segments?
Reasons to Buy this Report
- The report provides a comprehensive market analysis, offering detailed revenue projections of the overall market and its specific sub-segments. This information is valuable to both established market leaders and emerging entrants.
- Stakeholders can leverage the report to gain a deeper understanding of the competitive dynamics within the market. By analyzing the competitive landscape, businesses can make informed decisions to optimize their market positioning and develop effective go-to-market strategies.
- The report offers stakeholders a comprehensive overview of the market, including key drivers, barriers, opportunities, and challenges. This information empowers stakeholders to stay abreast of market trends and make data-driven decisions to capitalize on growth prospects.
Additional Benefits
- Complimentary PPT Insights Packs
- Complimentary Excel Data Packs for all Analytical Modules in the Report
- 15% Free Content Customization
- Detailed Report Walkthrough Session with Research Team
- Free Updated report if the report is 6-12 months old or older
TABLE OF CONTENTS
1. PREFACE
- 1.1. Scope of the Report
- 1.2. Research Methodology
- 1.3. Key Questions Answered
- 1.4. Chapter Outlines
2. EXECUTIVE SUMMARY
3. INTRODUCTION
- 3.1. Chapter Overview
- 3.2. Pharmaceutical Filling and Packaging
- 3.3. Importance of Pharmaceutical Packaging
- 3.4. Types of Pharmaceutical Packaging
- 3.5. Packaging of Cell Therapies
- 3.5.1. Primary Packaging
- 3.5.2. Secondary Packaging
- 3.6. Cell Therapy Packaging: Key Considerations
- 3.7. Challenges associated with Cell Therapy Packaging
- 3.8. Concluding Remarks
4. CELL THERAPY PACKAGING SERVICE PROVIDERS: MARKET LANDSCAPE
- 4.1. Chapter Overview
- 4.2. Cell Therapy Packaging Service Providers: Overall Market Landscape
- 4.2.1. Analysis by Year of Establishment
- 4.2.2. Analysis by Company Size
- 4.2.3. Analysis by Location of Headquarters
- 4.2.4. Analysis by Services Offered
- 4.2.5. Analysis by Type of Packaging
- 4.2.6. Analysis by Type of Passive System Offered
- 4.2.7. Analysis by Type of Package Engineering Design
- 4.2.8. Analysis by Phase Change Material Used
- 4.2.9. Analysis by Temperature Ranges Supported
- 4.2.10. Analysis by Type of Cells Handled
5. CELL THERAPY PACKAGING PRODUCT PROVIDERS: MARKET LANDSCAPE
- 5.1. Chapter Overview
- 5.2. Cell Therapy Packaging Products: Market Landscape
- 5.2.1. Analysis by Type of Packaging Container
- 5.2.2. Analysis by Container Fabrication Material and Raw Materials for Container Fabrication
- 5.2.3. Analysis by Type of Cells Packed
- 5.2.4. Analysis by Storage Conditions
- 5.2.5. Analysis by Usability of Container
- 5.3. Cell Therapy Packaging: Product Providers Landscape
- 5.3.1. Analysis by Year of Establishment
- 5.3.2. Analysis by Company Size
- 5.3.3. Analysis by Location of Headquarters
- 5.3.4. Most Active Players: Distribution by Number of Products
6. CELL THERAPY PACKAGING SERVICE AND PRODUCT PROVIDERS: COMPANY PROFILES
- 6.1. Chapter Overview
- 6.2. Cell Therapy Packaging Service Providers
- 6.2.1. Almac
- 6.2.1.1. Company Overview
- 6.2.1.2. Cell Therapy Service Portfolio
- 6.2.1.3. Recent Developments and Future Outlook
- 6.2.2. Catalent Biologics
- 6.2.2.1. Company Overview
- 6.2.2.2. Cell Therapy Service Portfolio
- 6.2.2.3. Recent Developments and Future Outlook
- 6.2.3. Cryoport Systems
- 6.2.3.1. Company Overview
- 6.2.3.2. Cell Therapy Service Portfolio
- 6.2.3.3. Recent Developments and Future Outlook
- 6.2.4. Yourway
- 6.2.4.1. Company Overview
- 6.2.4.2. Cell Therapy Service Portfolio
- 6.2.4.3. Recent Developments and Future Outlook
- 6.2.1. Almac
- 6.3. Cell Therapy Packaging Product Providers
- 6.3.1. Saint-Gobain Life Sciences
- 6.3.1.1. Company Overview
- 6.3.1.2. Cell Therapy Packaging Product Portfolio
- 6.3.1.3. Recent Developments and Future Outlook
- 6.3.2. Thermo Fisher Scientific
- 6.3.2.1. Company Overview
- 6.3.2.2. Cell Therapy Packaging Product Portfolio
- 6.3.2.3. Recent Developments and Future Outlook
- 6.3.3. West Pharmaceutical Services
- 6.3.3.1. Company Overview
- 6.3.3.2. Cell Therapy Packaging Product Portfolio
- 6.3.3.3. Recent Developments and Future Outlook
- 6.3.1. Saint-Gobain Life Sciences
7. COMPANY COMPETITIVENESS ANALYSIS
- 7.1. Chapter Overview
- 7.2. Key Parameters
- 7.3. Methodology
- 7.4. Cell Therapy Packaging Service Providers: Company Competitiveness Analysis
- 7.4.1. Companies based in North America
- 7.4.2. Companies based in Europe and Asia-Pacific
8. PARTNERSHIPS AND COLLABORATIONS
- 8.1. Chapter Overview
- 8.2. Partnership Models
- 8.3. Cell Therapy Packaging: List of Partnerships and Collaborations
- 8.3.1. Analysis by Year of Partnership
- 8.3.2. Analysis by Type of Partnership
- 8.3.3. Analysis by Year and Type of Partnership
- 8.3.4. Analysis by Purpose of Partnership
- 8.3.5. Analysis by Type of Service(s) Covered
- 8.3.6. Most Active Players: Analysis by Number of Partnerships
- 8.3.7. Regional Analysis
- 8.3.8. Intercontinental and Intracontinental Agreements
9. LIKELY PARTNER ANALYSIS
- 9.1. Chapter Overview
- 9.2. Scope and Methodology
- 9.3. Potential Strategic Partners for Cell Therapy Packaging Providers in North America
- 9.3.1. Most Likely Partners
- 9.3.2. Likely Partners
- 9.3.3. Less Likely Partners
- 9.4. Potential Strategic Partners for Cell Therapy Packaging Providers in Europe
- 9.4.1. Most Likely Partners
- 9.4.2. Likely Partners
- 9.4.3. Less Likely Partners
- 9.5. Potential Strategic Partners for Cell Therapy Packaging Providers in Asia Pacific and Rest of the World
- 9.5.1. Most Likely Partners
- 9.5.2. Likely Partners
- 9.5.3. Less Likely Partners
10. CELL THERAPY DEVELOPERS AND MANUFACTURERS: CASE STUDY
- 10.1. Chapter Overview
- 10.2. Cell Therapy Manufacturers: Overall Market Landscape
- 10.2.1. Analysis by Year of Establishment
- 10.2.2. Analysis by Company Size
- 10.2.3. Analysis by Location of Headquarters
- 10.2.4. Analysis by Location of Manufacturing Facility
- 10.2.5. Analysis by Type of Cell(s) Manufactured
- 10.2.6. Analysis by Source of Cells
- 10.2.7. Analysis by Scale of Operation
- 10.2.8. Analysis by Manufacturing Capabilities / Services
- 10.2.9. Concluding Remarks
11. GLOBAL CELL THERAPY PACKAGING MARKET
- 11.1. Chapter Overview
- 11.2. Assumptions and Methodology
- 11.3. Global Cell Therapy Packaging
Services Market, Forecasted Estimates (till 2035)
- 11.4. Scenario Analysis
- 11.4.1. Conservative Scenario
- 11.4.2. Optimistic Scenario
- 11.5. Key Market Segmentations
12. CELL THERAPY PACKAGING MARKET, BY TYPE OF THERAPY
- 12.1. Chapter Overview
- 12.2. Key Assumptions and Methodology
- 12.3. Cell Therapy Packaging Market: Distribution by Type of Therapy
- 12.3.1. T-cell Therapies Packaging: Forecasted Estimates (till 2035)
- 12.3.2. Dendritic Cell Vaccines Packaging: Forecasted Estimates (till 2035)
- 12.3.3. Stem Cell Therapies Packaging: Forecasted Estimates (till 2035)
- 12.3.4. NK-Cell Therapies Packaging: Forecasted Estimates (till 2035)
- 12.3.5. Other Advanced Therapy Medicinal Products Packaging: Forecasted Estimates (till 2035)
- 12.4. Data Triangulation and Validation
13. CELL THERAPY PACKAGING MARKET, BY SCALE OF OPERATION
- 13.1. Chapter Overview
- 13.2. Key Assumptions and Methodology
- 13.3. Cell Therapy Packaging Market: Distribution by Scale of Operation
- 13.3.1. Clinical Scale: Forecasted Estimates (till 2035)
- 13.3.2. Commercial Scale: Forecasted Estimates (till 2035)
- 13.4. Data Triangulation and Validation
14. CELL THERAPY PACKAGING MARKET, BY PACKAGE ENGINEERING DESIGN
- 14.1. Chapter Overview
- 14.2. Key Assumptions and Methodology
- 14.3. Cell Therapy Packaging Market: Distribution by Package Engineering Design
- 14.3.1. Primary Packaging: Forecasted Estimates (till 2035)
- 14.3.2. Secondary Packaging: Forecasted Estimates (till 2035)
- 14.4. Data Triangulation and Validation
15. CELL THERAPY PACKAGING MARKET, BY KEY GEOGRAPHICAL REGIONS
- 15.1. Chapter Overview
- 15.2. Key Assumptions and Methodology
- 15.3. Cell Therapy Packaging Market: Distribution by Key Geographical Regions
- 15.3.1. North America: Forecasted Estimates (till 2035)
- 15.3.2. Europe: Forecasted Estimates (till 2035)
- 15.3.3. Asia-Pacific: Forecasted Estimates (till 2035)
- 15.3.4. Rest of the World: Forecasted Estimates (till 2035)
- 15.4. Data Triangulation and Validation
16. CONCLUDING REMARKS
- 16.1. Chapter Overview
17. APPENDIX 1: TABULATED DATA
18. APPENDIX 2: LIST OF COMPANIES AND ORGANIZATIONS
List of Tables
- Table 4.1 Cell Therapy Packaging Service Providers: List of Industry Players
- Table 4.2 Cell Therapy Packaging Service Providers Market: Information on Services Offered
- Table 4.3 Cell Therapy Packaging Service Providers Market: Information on Type of Packaging
- Table 4.4 Cell Therapy Packaging Service Providers Market: Information on Type of Passive System Used
- Table 4.5 Cell Therapy Packaging Service Providers Market: Information on Type of Packaging
- Table 4.6 Cell Therapy Packaging Service Providers Market: Information on Phase Change Material
- Table 4.7 Cell Therapy Packaging Service Providers Market: Information on Temperature Ranges
- Table 4.8 Cell Therapy Packaging Service Providers Market: Information on Type of Cells Handled Supported
- Table 5.1 Cell Therapy Packaging Product Providers: Information on Type of Packaging Container
- Table 5.2 Cell Therapy Packaging Product Providers: Information on Type of Container Fabrication Material and Raw Material for Container Fabrication
- Table 5.3 Cell Therapy Packaging Product Providers Market: Information on Type of Cells Packed
- Table 5.4 Cell Therapy Packaging Product Providers: Information on Storage Conditions
- Table 5.5 Cell Therapy Packaging Product Providers: Information on Packaging Volume, Customization and Usability of Container
- Table 5.6 Cell Therapy Packaging Product Providers: List of Industry Players
- Table 6.1 Cell Therapy Packaging Service and Product Providers: List of Companies Profiled
- Table 6.2 Almac: Company Snapshot
- Table 6.3 Almac: Recent Developments and Future Outlook
- Table 6.4 Cryoport Systems: Company Snapshot
- Table 6.5 Cryoport Systems: Recent Developments and Future Outlook
- Table 6.6 Catalent Biologics: Company Snapshot
- Table 6.7 Catalent Biologics: Recent Developments and Future Outlook
- Table 6.8 Yourway: Company Snapshot
- Table 6.9 Saint-Gobain Life Sciences: Company Snapshot
- Table 6.10 Saint-Gobain Life Sciences: Product Portfolio
- Table 6.11 Thermo Fisher Scientific: Company Snapshot
- Table 6.12 Thermo Fisher Scientific: Product Portfolio
- Table 6.13 Thermo Fisher Scientific: Recent Developments and Future Outlook
- Table 6.14 West Pharmaceutical Services: Company Snapshot
- Table 6.15 West Pharmaceutical Services: Product Portfolio
- Table 6.16 West Pharmaceutical Services: Recent Developments and Future Outlook
- Table 7.1 Cell Therapy Packaging: List of Partnerships and Collaborations, since 2016
- Table 7.2 Partnerships and Collaborations: Information on Type of Service(s) Covered
- Table 9.1 Most Likely Partners for Cell Therapy Packaging Product and Service Providers in North America
- Table 9.2 Likely Partners for Cell Therapy Packaging Product and Service Providers in North America
- Table 9.3 Less Likely Partners for Cell Therapy Packaging Product and Service Providers in North America
- Table 9.4 Most Likely Partners for Cell Therapy Packaging Product and Service Providers in Europe
- Table 9.5 Likely Partners for Cell Therapy Packaging Product and Service Providers in Europe
- Table 9.6 Less Likely Partners for Cell Therapy Packaging Product and Service Providers in Europe
- Table 9.7 Most Likely Partners for Cell Therapy Packaging Product and Service Providers in Asia Pacific and RoW
- Table 9.8 Likely Partners for Cell Therapy Packaging Product and Service Providers in Asia Pacific and RoW
- Table 9.9 Less Likely Partners for Cell Therapy Packaging Product and Service Providers in Asia Pacific and RoW
- Table 10.1 Cell Therapy Manufacturers: List of Industry Players
- Table 10.2 Cell Therapy Manufacturers: Information on Type of Cells Manufactured
- Table 10.3 Cell Therapy Manufacturers: Information on Source of Cells
- Table 10.4 Cell Therapy Manufacturers: Information on Scale of Operation
- Table 10.5 Cell Therapy Manufacturers: Information on Type of Manufacturing Capabilities / Services
- Table 17.1 Cell Therapy Packaging Service Providers: Distribution by Year of Establishment
- Table 17.2 Cell Therapy Packaging Service Providers: Distribution by Company Size
- Table 17.3 Cell Therapy Packaging Service Providers: Distribution by Location of Headquarters
- Table 17.4 Cell Therapy Packaging Service Providers: Distribution by Package Engineering Design
- Table 17.5 Cell Therapy Packaging Service Providers: Distribution by Type of Packaging
- Table 17.6 Cell Therapy Packaging Service Providers: Distribution by Packaging Material
- Table 17.7 Cell Therapy Packaging Service Providers: Distribution by Type of Packaging and Packaging Material
- Table 17.8 Cell Therapy Packaging Service Providers: Distribution by Type of Passive System Used
- Table 17.9 Cell Therapy Packaging Service Providers: Distribution by Temperature Ranges Supported
- Table 17.10 Cell Therapy Packaging Service Providers: Distribution by Type of Packaging, Packaging Material and Temperature Ranges Supported
- Table 17.11 Cell Therapy Packaging Service Providers: Distribution by Type of Cells Handled
- Table 17.12 Cell Therapy Packaging Service Providers: Distribution by Type of Additional Services Offered
- Table 17.13 Cell Therapy Packaging Products: Distribution by Type of Packaging Container
- Table 17.14 Cell Therapy Packaging Products: Distribution by Container Fabrication Material
- Table 17.15 Cell Therapy Packaging Products: Distribution by Type of Packaging Container and Container Fabrication Material
- Table 17.16 Cell Therapy Packaging Products: Distribution by Storage Temperature Conditions
- Table 17.17 Cell Therapy Packaging Products: Distribution by Type of Container and Storage Temperature Conditions
- Table 17.18 Cell Therapy Packaging Products: Distribution by Type of Cells Packed
- Table 17.19 Cell Therapy Packaging Products: Distribution by Usability of Container
- Table 17.20 Cell Therapy Packaging Product Providers: Distribution by Year of Establishment
- Table 17.21 Cell Therapy Packaging Product Providers: Distribution by Company Size
- Table 17.22 Cell Therapy Packaging Product Providers: Distribution by Location of Headquarters
- Table 17.23 Partnerships and Collaborations: Cumulative Year-wise Trend, since 2016
- Table 17.24 Partnerships and Collaborations: Distribution by Type of Partnership
- Table 17.25 Partnerships and Collaborations: Distribution by Year and Type of Partnership, since 2016
- Table 17.26 Partnerships and Collaborations: Distribution by Purpose of Partnerships
- Table 17.27 Partnerships and Collaborations: Distribution by Type of Service(s) Covered
- Table 17.28 Most Active Players: Distribution by Number of Partnerships
- Table 17.29 Partnerships and Collaborations: Distribution by Location of Parent Company
- Table 17.30 Partnerships and Collaborations: Distribution by Location of Partner Company
- Table 17.31 Partnerships and Collaborations: Distribution by Intercontinental and Intracontinental Partnerships
- Table 17.32 Cell Therapy Manufacturers: Distribution by Year of Establishment
- Table 17.33 Cell Therapy Manufacturers: Distribution by Company Size
- Table 17.34 Cell Therapy Manufacturers: Distribution by Location of Headquarters
- Table 17.35 Cell Therapy Manufacturers: Distribution by Location of Headquarters (Country Wise)
- Table 17.36 Cell Therapy Manufacturers: Distribution by Location of Manufacturing Facility (Region-wise)
- Table 17.37 Cell Therapy Manufacturers: Distribution by Location of Manufacturing Facility (Country-wise)
- Table 17.38 Cell Therapy Manufacturers: Distribution by Type of Cells Manufactured
- Table 17.39 Cell Therapy Manufacturers: Distribution by Type of Manufacturers
- Table 17.40 Cell Therapy Manufacturers: Distribution by Source of Cells
- Table 17.41 Cell Therapy Manufacturers: Distribution by Scale of Operation
- Table 17.42 Cell Therapy Manufacturers: Distribution by Manufacturing Capabilities / Services
- Table 17.43 Global Cell Therapy Packaging Market, Forecasted Estimates (till 2035) (USD Million)
- Table 17.44 Global Cell Therapy Packaging Market, Forecasted Estimates (till 2035), Conservative Scenario (USD Million)
- Table 17.45 Global Cell Therapy Packaging Market, Forecasted Estimates (till 2035), Optimistic Scenario (USD Million)
- Table 17.46 Global Cell Therapy Packaging Market: Distribution by Type of Therapy, Current Year and 2035 (USD Million)
- Table 17.47 Cell Therapy Packaging Market for T-cell Therapies Packaging, Forecasted Estimates (till 2035) (USD Million)
- Table 17.48 Cell Therapy Packaging Market for Stem Cell Therapies Packaging, Forecasted Estimates (till 2035) (USD Million)
- Table 17.49 Cell Therapy Packaging Market for Dendritic Cell Vaccines Packaging, Forecasted Estimates (till 2035) (USD Million)
- Table 17.50 Cell Therapy Packaging Market for NK-Cell Therapies Packaging, Forecasted Estimates (till 2035) (USD Million)
- Table 17.51 Cell Therapy Packaging Market for Other Advanced Therapy Medicinal Products Packaging, Forecasted Estimates (till 2035) (USD Million)
- Table 17.52 Global Cell Therapy Packaging Market: Distribution by Scale of Operation, Current Year and 2035 (USD Million)
- Table 17.53 Cell Therapy Packaging Market for Clinical Scale, Forecasted Estimates (till 2035) (USD Million)
- Table 17.54 Cell Therapy Packaging Market for Commercial Scale, Forecasted Estimates (till 2035) (USD Million)
- Table 17.55 Global Cell Therapy Packaging Market: Distribution by Package Engineering Design, Current Year and 2035 (USD Million)
- Table 17.56 Cell Therapy Packaging Market for Primary Packaging, Forecasted Estimates (till 2035) (USD Million)
- Table 17.57 Cell Therapy Packaging Market for Secondary Packaging, Forecasted Estimates (till 2035) (USD Million)
- Table 17.58 Global Cell Therapy Packaging Market: Distribution by Key Geographical Regions, Current Year and 2035 (USD Million)
- Table 17.59 Cell Therapy Packaging Market for North America, Forecasted Estimates (till 2035) (USD Million)
- Table 17.60 Cell Therapy Packaging Market for Europe, Forecasted Estimates (till 2035) (USD Million)
- Table 17.61 Cell Therapy Packaging Market for Asia-Pacific, Forecasted Estimates (till 2035) (USD Million)
- Table 17.62 Cell Therapy Packaging Market for Rest of the World, Forecasted Estimates (till 2035) (USD Million)
List of Figures
- Figure 2.1 Executive Summary: Service Providers Landscape
- Figure 2.2 Executive Summary: Product Providers Landscape
- Figure 2.3 Executive Summary: Partnerships and Collaborations
- Figure 2.4 Executive Summary: Market Forecast and Opportunity Analysis
- Figure 3.1 Traditional Aseptic Pharmaceutical Filling
- Figure 3.2 Advantages of Pharmaceutical Packaging
- Figure 3.3 Types of Pharmaceutical Packaging
- Figure 3.4 Packaging Containers for Cell Therapies
- Figure 3.5 Challenging aspects of Cell Therapy Packaging
- Figure 4.1 Cell Therapy Packaging Service Providers: Distribution by Year of Establishment
- Figure 4.2 Cell Therapy Packaging Service Providers: Distribution by Company Size
- Figure 4.3 Cell Therapy Packaging Service Providers: Distribution by Location of Headquarters
- Figure 4.4 Cell Therapy Packaging Service Providers: Distribution by Company Size and Location of Headquarters
- Figure 4.5 Cell Therapy Packaging Service Providers: Distribution by Services Offered
- Figure 4.6 Cell Therapy Packaging Service Providers: Distribution by Type of Packaging
- Figure 4.7 Cell Therapy Packaging Service Providers: Distribution by Passive System Used
- Figure 4.8 Cell Therapy Packaging Service Providers: Distribution by Package Engineering Design
- Figure 4.9 Cell Therapy Packaging Service Providers: Distribution by Type of Phase Change Material
- Figure 4.10 Cell Therapy Packaging Service Providers: Distribution by Type of Packaging and Phase Change Material
- Figure 4.11 Cell Therapy Packaging Service Providers: Distribution by Temperature Ranges Supported
- Figure 4.12 Cell Therapy Packaging Service Providers: Distribution by Type of Packaging, Packaging Material and Temperature Ranges Supported
- Figure 4.13 Cell Therapy Packaging Service Providers: Distribution by Type of Cells Handled
- Figure 5.1 Cell Therapy Packaging Products: Distribution by Type of Packaging Container
- Figure 5.2 Cell Therapy Packaging Products: Distribution by Container Fabrication Material and Raw Materials for Container Fabrication
- Figure 5.3 Cell Therapy Packaging Products: Distribution by Type of Packaging and Type of Container Fabrication Material
- Figure 5.4 Cell Therapy Packaging Products: Distribution by Type of Cells Packed
- Figure 5.5 Cell Therapy Packaging Products: Distribution by Storage Temperature
- Figure 5.6 Cell Therapy Packaging Products: Distribution by Usability of Container
- Figure 5.7 Cell Therapy Packaging Product Providers: Distribution by Year of Establishment
- Figure 5.8 Cell Therapy Packaging Product Providers: Distribution by Company Size
- Figure 5.9 Cell Therapy Packaging Product Providers: Distribution by Location of Headquarters
- Figure 5.10 Cell Therapy Packaging Product Providers: Distribution by Company Size and Location of Headquarters
- Figure 5.11 Key Cell Therapy Packaging Product Providers: Distribution by Number of Products
- Figure 6.1 Almac: Cell Therapy Service Portfolio
- Figure 6.2 Catalent Biologics: Cell Therapy Service Portfolio
- Figure 6.3 Cryoport Systems: Cell Therapy Service Portfolio
- Figure 6.4 Yourway: Cell Therapy Service Portfolio
- Figure 7.1 Company Competitiveness Analysis: Cell Therapy Packaging Service Providers based in North America
- Figure 7.2 Company Competitiveness Analysis: Cell Therapy Packaging Service Providers based in Europe and Asia-Pacific
- Figure 8.1 Partnerships and Collaborations: Cumulative Year-wise Trend, since 2016
- Figure 8.2 Partnerships and Collaborations: Distribution by Type of Partnership
- Figure 8.3 Partnerships and Collaborations: Distribution by Year and Type of Partnership, since 2016
- Figure 8.4 Partnerships and Collaborations: Distribution by Purpose of Partnership
- Figure 8.5 Partnerships and Collaborations: Distribution by Type of Service(s) Covered
- Figure 8.6 Most Active Players: Distribution by Number of Partnerships
- Figure 8.7 Partnerships and Collaborations: Distribution by Location of Parent Company
- Figure 8.8 Partnerships and Collaborations: Distribution by Location of Partner Company
- Figure 8.9 Partnerships and Collaborations: Intercontinental and Intracontinental Agreements
- Figure 10.1 Cell Therapy Manufacturers: Distribution by Year of Establishment
- Figure 10.2 Cell Therapy Manufacturers: Distribution by Company Size
- Figure 10.3 Cell Therapy Manufacturers: Distribution by Location of Headquarters
- Figure 10.4 Cell Therapy Manufacturers: Distribution by Location of Headquarters (Country Wise)
- Figure 10.5 Cell Therapy Manufacturers: Distribution by Location of Manufacturing Facility (Region-wise)
- Figure 10.6 Cell Therapy Manufacturers: Distribution by Location of Manufacturing Facility (Country-wise)
- Figure 10.7 Cell Therapy Manufacturers: Distribution by Type of Cells Manufactured
- Figure 10.8 Cell Therapy Manufacturers: Distribution by Type of Manufacturers
- Figure 10.9 Cell Therapy Manufacturers: Distribution by Source of Cells
- Figure 10.10 Cell Therapy Manufacturers: Distribution by Scale of Operation
- Figure 10.11Cell Therapy Manufacturers: Distribution by Manufacturing Capabilities / Services
- Figure 11.1 Global Cell Therapy Packaging Market, Forecasted Estimates (till 2035) (USD Million)
- Figure 11.2 Global Cell therapy Packaging Market, Forecasted Estimates (till 2035), Conservative Scenario (USD Million)
- Figure 11.3 Global Cell therapy Packaging Market, Forecasted Estimates (till 2035), Optimistic Scenario (USD Million)
- Figure 12.1 Cell Therapy Packaging Market: Distribution by Type of Therapy, Current Year and 2035 (USD Million)
- Figure 12.2 Cell Therapy Packaging Market for T-cell Therapies Packaging, Forecasted Estimates (till 2035) (USD Million)
- Figure 12.3 Cell Therapy Packaging Market for Dendritic Cell Vaccines Packaging, Forecasted Estimates (till 2035) (USD Million)
- Figure 12.4 Cell Therapy Packaging Market for Stem Cell Therapies Packaging, Forecasted Estimates (till 2035) (USD Million)
- Figure 12.5 Cell Therapy Packaging Market for NK-Cell Therapies Packaging, Forecasted Estimates (till 2035) (USD Million)
- Figure 12.6 Cell Therapy Packaging Market for Other Advanced Therapy Medicinal Products Packaging, Forecasted Estimates (till 2035) (USD Million)
- Figure 13.1 Cell Therapy Packaging Market: Distribution by Scale of Operation, Current Year and 2035 (USD Million)
- Figure 13.2 Cell Therapy Packaging Market for Clinical Scale, Forecasted Estimates (till 2035) (USD Million)
- Figure 13.3 Cell Therapy Packaging Market for Commercial Scale, Forecasted Estimates (till 2035) (USD Million)
- Figure 14.1 Cell Therapy Packaging Market: Distribution by Package Engineering Design, Current Year and 2035 (USD Million)
- Figure 14.2 Cell Therapy Packaging Market for Primary Packaging, Forecasted Estimates (till 2035) (USD Million)
- Figure 14.3 Cell Therapy Packaging Market for Secondary Packaging, Forecasted Estimates (till 2035) (USD Million)
- Figure 15.1 Cell Therapy Packaging Market: Distribution by Key Geographical Regions, Current Year and 2035 (USD Million)
- Figure 15.2 Cell Therapy Packaging Market in North America, Forecasted Estimates (till 2035) (USD Million)
- Figure 15.3 Cell Therapy Packaging Market in Europe, Forecasted Estimates (till 2035) (USD Million)
- Figure 15.4 Cell Therapy Packaging Market in Asia-Pacific, Forecasted Estimates (till 2035) (USD Million)
- Figure 15.5 Cell Therapy Packaging Market in Rest of The World, Forecasted Estimates (till 2035) (USD Million)
- Figure 16.1 Concluding Remarks: Overall Service Providers Landscape
- Figure 16.2 Concluding Remarks: Overall Products Landscape
- Figure 16.3 Concluding Remarks: Partnerships and Collaborations
- Figure 16.4 Concluding Remarks: Likely Partner Analysis
- Figure 16.5 Concluding Remarks: Market Forecast

