
PUBLISHER: Roots Analysis | PRODUCT CODE: 1919790

PUBLISHER: Roots Analysis | PRODUCT CODE: 1919790
AI In Oncology Market, till 2040: Distribution by Type of Cancer, Type of End User, and Geographical Regions: Industry Trends and Global Forecasts
AI in Oncology Market Outlook
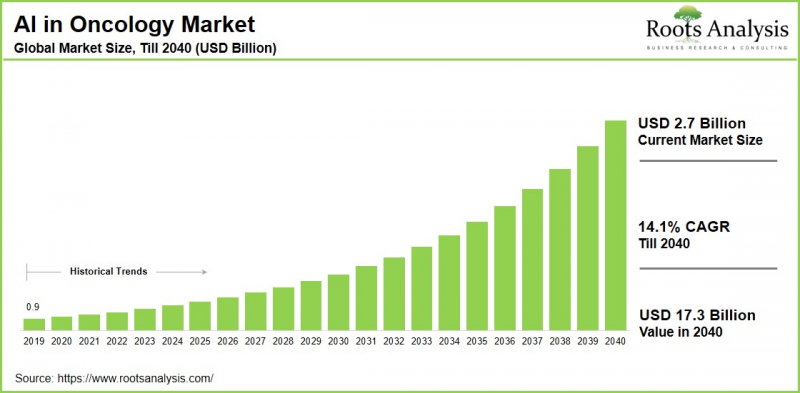
As per Roots Analysis, the global AI in oncology market size is estimated to grow from USD 2.7 billion in the current year to USD 17.3 billion by 2040, at a CAGR of 14.1% during the forecast period, till 2040. The new study provides information on market size, growth scenarios, industry trends and future forecasts.
Given the rising incidence of cancer globally, there has been an increased demand for advanced diagnostic and treatment methods to care for patients. Artificial Intelligence (AI) is transforming oncology by improving cancer care at every stage of the patient's journey, from early detection through imaging and pathology analysis (such as mammograms and CT scans) to personalized treatment. It also aids in predicting patient outcomes, thereby enhancing efficiency, accuracy, and accessibility of care.
AI in oncology market is expected to rise at a significant rate throughout the forecast period. This is due to urgent demand for early, accurate detection, the shift toward precision medicine, and the need for optimized, cost-effective treatment planning to manage a rising global cancer burden.
Strategic Insights for Senior Leaders
AI in Oncology Market: Competitive Landscape of Companies in this Industry
The competitive landscape of AI in oncology market is characterized by intense competition, featuring a combination of large and smaller firms. Siemens Healthineers and GE Healthcare hold dominant positions through extensive imaging equipment, using >70 FDA-cleared AI algorithms to generate recurring software revenue and ensure workflow integration. Further, other key players, such as IBM, NVIDIA, PathAI, ConcertAI, Tempus, Oracle, Medtronic, and Philips, along with emerging players like Azra AI, Paige AI, offer targeted solutions in diagnostics, drug discovery, pathology, and precision medicine.
What is the Opportunity for AI in Oncology?
The global AI in oncology market is projected to reach USD 17.3 billion by 2040. Solid tumors currently dominate the market share among other cancer types.
Rising cancer prevalence worldwide, along with the need for innovative AI-driven early detection tools, highlights the critical role of AI in oncology. Additionally, expanding AI applications in oncology and molecular biology for personalized therapies are likely to fuel market expansion throughout the forecast period.
AI in Oncology Evolution: Emerging Trends in the Industry
Emerging trends in artificial intelligence (AI) within the oncology sector emphasize precision diagnostics, personalized therapies, and expedited drug development pipelines. AI-driven algorithms significantly improve early-stage cancer identification via advanced imaging modalities such as PET / CT fusion and histopathological analysis, attaining tumor detection accuracies to 99%. For therapeutic decision-making, AI leverages multi-omics datasets, genomic profiling, and comprehensive patient records to forecast treatment efficacy, and model tumor microenvironments to advance precision interventions. Further, AI optimizes clinical trial recruitment via advanced platforms, facilitates nanocarrier engineering, and enables real-time surveillance with nano sensors.
Key Drivers Propelling Growth of AI in Oncology Market
The growth of the AI in oncology market is propelled by several pivotal drivers. The escalating global incidence of cancer has heightened demand for advanced diagnostic solutions, where AI-enhanced imaging and analytics enable earlier and more accurate tumor detection beyond human capabilities. Further, substantial investments from pharmaceutical and biotechnology sectors have accelerated drug discovery processes through predictive modeling, thereby reducing clinical trial expenses and timelines. Furthermore, regulatory endorsements such as FDA approvals, coupled with increased funding and widespread adoption in healthcare institutions, have enabled the practical deployment of AI across diagnostics, treatment planning, and operational efficiencies.
Key Market Challenges
The market for AI in oncology faces significant challenges, including limited access to large, high-quality, and representative multimodal datasets which affect model performance. High upfront costs for data acquisition, infrastructure, and integration into existing oncology workflows, combined with a lack of interoperability with legacy IT systems, also limits the adoption, especially in smaller or resource-limited centers. Additionally, unclear and evolving regulatory frameworks, coupled with heightened requirements for data security and protection of sensitive genomic and oncology data, slow approvals and scale-up of AI solutions in real-world oncology practice.
AI in Oncology Market: Key Market Segmentation
Type of Cancer
- Solid malignancies
- Breast cancer
- Lung cancer
- Prostate cancer
- Colorectal cancer
- Brain tumor
- Others
Type of End User
- Hospitals
- Pharmaceutical companies
- Research Institutes
- Others
Geographical Regions
- North America
- US
- Canada
- Mexico
- Other North American countries
- Europe
- Austria
- Belgium
- Denmark
- France
- Germany
- Ireland
- Italy
- Netherlands
- Norway
- Russia
- Spain
- Sweden
- Switzerland
- UK
- Other European countries
- Asia
- China
- India
- Japan
- Singapore
- South Korea
- Other Asian countries
- Latin America
- Brazil
- Chile
- Colombia
- Venezuela
- Other Latin American countries
- Middle East and North Africa
- Egypt
- Iran
- Iraq
- Israel
- Kuwait
- Saudi Arabia
- UAE
- Other MENA countries
- Rest of the World
- Australia
- New Zealand
AI in Oncology Market: Key Market Share Insights
Market Share by Type of Cancer
Based on the type of cancer, the global market is segmented into solid malignancies, breast cancer, lung cancer, prostate cancer, colorectal cancer, brain tumor and others. According to our estimates, currently, solid malignancies segment captures majority share of the market. This is due to the increasing prevalence of cancer, which creates the need for innovative, scalable, and precise tools.
Market Share by Geography
According to our estimates Europe currently captures a significant share of the AI in oncology market. This is due to the increasing utilization of AI-based tools by pharmaceutical companies for drug discovery and the rise in partnership agreements aimed at improving healthcare system in Europe. It is also important to note that the AI in oncology market in the Asia-Pacific region is expected to grow at a higher CAGR over the forecast period.
Example Players in AI in Oncology Market
- Berg (A part of BPGbio)
- CancerCenter.AI
- Concert AI
- GE Healthcare
- IBM Watson Health
- iCAD
- JLK Inspection
- Median Technologies
- Path AI
- Roche Diagnostics
AI in Oncology Market: Report Coverage
The report on the AI in oncology market features insights on various sections, including:
- Market Sizing and Opportunity Analysis: An in-depth analysis of the AI in oncology market, focusing on key market segments, including [A] type of cancer, [B] type of end user, and [C] key geographical regions.
- Competitive Landscape: A comprehensive analysis of the companies engaged in the AI in oncology market, based on several relevant parameters, such as [A] year of establishment, [B] company size, [C] location of headquarters and [D] ownership structure.
- Company Profiles: Elaborate profiles of prominent players engaged in the AI in oncology market, providing details on [A] location of headquarters, [B] company size, [C] company mission, [D] company footprint, [E] management team, [F] contact details, [G] financial information, [H] operating business segments, [I] technology / platform portfolio, [J] recent developments, and an informed future outlook.
- Megatrends: An evaluation of ongoing megatrends in the AI in oncology industry.
- Patent Analysis: An insightful analysis of patents filed / granted in the AI in oncology domain, based on relevant parameters, including [A] type of patent, [B] patent publication year, [C] patent age and [D] leading players.
- Recent Developments: An overview of the recent developments made in the AI in oncology market, along with analysis based on relevant parameters, including [A] year of initiative, [B] type of initiative, [C] geographical distribution and [D] most active players.
- Porter's Five Forces Analysis: An analysis of five competitive forces prevailing in the AI in oncology market, including threats of new entrants, bargaining power of buyers, bargaining power of suppliers, threats of substitute products and rivalry among existing competitors.
- SWOT Analysis: An insightful SWOT framework, highlighting the strengths, weaknesses, opportunities and threats in the domain. Additionally, it provides Harvey ball analysis, highlighting the relative impact of each SWOT parameter.
- Value Chain Analysis: A comprehensive analysis of the value chain, providing information on the different phases and stakeholders involved in the AI in oncology market.
Key Questions Answered in this Report
- What is the current and future market size?
- Who are the leading companies in this market?
- What are the growth drivers that are likely to influence the evolution of this market?
- What are the key partnership and funding trends shaping this industry?
- Which region is likely to grow at higher CAGR till 2040?
- How is the current and future market opportunity likely to be distributed across key market segments?
Reasons to Buy this Report
- Detailed Market Analysis: The report provides a comprehensive market analysis, offering detailed revenue projections of the overall market and its specific sub-segments. This information is valuable to both established market leaders and emerging entrants.
- In-depth Analysis of Trends: Stakeholders can leverage the report to gain a deeper understanding of the competitive dynamics within the market. Each report maps ecosystem activity across partnerships, funding, and patent landscapes to reveal growth hotspots and white spaces in the industry.
- Opinion of Industry Experts: The report features extensive interviews and surveys with key opinion leaders and industry experts to validate market trends mentioned in the report.
- Decision-ready Deliverables: The report offers stakeholders with strategic frameworks (Porter's Five Forces, value chain, SWOT), and complimentary Excel / slide packs with customization support.
Additional Benefits
- Complimentary Dynamic Excel Dashboards for Analytical Modules
- Exclusive 15% Free Content Customization
- Personalized Interactive Report Walkthrough with Our Expert Research Team
- Free Report Updates for Versions Older than 6-12 Months
TABLE OF CONTENTS
1. PREFACE
- 1.1. Overview
- 1.2. Scope of the Report
- 1.3. Market Segmentation
- 1.4. Research Methodology
- 1.5. Key Questions Answered
- 1.6. Chapter Outlines
2. EXECUTIVE SUMMARY
- 2.1 Chapter Overview
3. INTRODUCTION
- 3.1. Chapter Overview
- 3.2. Overview of Artificial Intelligence
- 3.3. Types Of Artificial Intelligence
- 3.4. Role of AI in Oncology
- 3.5. Key Challenges Associated with Use of AI
- 3.6. Future Perspectives
4. MARKET OVERVIEW
- 4.1. Chapter Overview
- 4.2. AI in Oncology: Market Landscape of Software providers
- 4.2.1. Analysis by Year of Establishment
- 4.2.2. Analysis by Company Size
- 4.2.3. Analysis by Location of Headquarters (Region-wise)
- 4.2.4. Analysis by Location of Headquarters (Country-wise)
- 4.2.5. Analysis by Type of End-User
- 4.2.6. Analysis by Year of Establishment, Company size and Location of Headquarters
- 4.3. AI in Oncology: Market Landscape of Software Solutions
- 4.3.1. Analysis by Type of Service(s) Offered
- 4.3.2. Analysis by Type of AI Technology Used
- 4.3.3. Analysis by Type of Platform
- 4.3.4. Analysis by Type of Service(s) Offered and Type of End-User
- 4.3.5. Analysis by Type of Platform and Type of AI Technology Used
- 4.3.6. Analysis by Type of Service(s) Offered, Location of Headquarters and Type of AI Technology Used
5. COMPANY PROFILES
- 5.1. Chapter Overview
- 5.2. Roche Diagnostics
- 5.2.1. Company Overview
- 5.2.2. Financial Information
- 5.2.3. Service Portfolio
- 5.2.4. Recent Developments and Future Outlook
- 5.3. IBM Watson Health
- 5.3.1. Company Overview
- 5.3.2. Financial Information
- 5.3.3. Service Portfolio
- 5.3.4. Recent Developments and Future Outlook
- 5.4. CancerCenter.AI
- 5.4.1. Company Overview
- 5.4.2. Service Portfolio
- 5.4.3. Recent Development and Future Outlooks
- 5.5. GE Healthcare
- 5.5.1. Company Overview
- 5.5.2. Financial Information
- 5.5.3. Service Portfolio
- 5.5.4. Recent Development and Future Outlook
- 5.6. Concert AI
- 5.6.1. Company Overview
- 5.6.2. Service Portfolio
- 5.6.3. Recent Developments and Future Outlook
- 5.7. Path AI
- 5.7.1. Company Overview
- 5.7.2. Service portfolio
- 5.7.3. Recent Development and Future Outlook
- 5.8. Berg
- 5.8.1. Company Overview
- 5.8.2. Service Portfolio
- 5.8.3. Recent Development and Future Outlook
- 5.9. Median Technologies
- 5.9.1. Company Overview
- 5.9.2. Financial Information
- 5.9.3. Service Portfolio
- 5.9.4. Recent Development and Future Outlook
- 5.10. iCAD
- 5.10.1. Company Overview
- 5.10.2. Financial Information
- 5.10.3. Service Portfolio
- 5.10.4. Recent Developments and Future Outlook
- 5.11. JLK Inspection
- 5.11.1. Company Overview
- 5.11.2. Service Portfolio
- 5.11.3. Recent Development and Future Outlook
6. COMPANY COMPETITIVENESS ANALYSIS
- 6.1. Chapter Overview
- 6.2. Assumptions and Key Parameters
- 6.3. Methodology
- 6.3.1. Company Competitiveness: Small Companies in North America
- 6.3.2. Company Competitiveness: Small Companies in Europe
- 6.3.3. Company Competitiveness: Small Companies in Asia Pacific
- 6.3.4. Company Competitiveness: Mid-sized companies in North America
- 6.3.5. Company Competitiveness: Mid-sized companies in Europe
- 6.3.6. Company Competitiveness: Mid-sized companies in Asia Pacific
- 6.3.7. Company Competitiveness: Large companies in North America and Europe
7. PATENT ANALYSIS
- 7.1. Chapter Overview
- 7.2. Scope and Methodology
- 7.3. AI in Oncology: Patent Analysis
- 7.3.1. Analysis by Type of Patent
- 7.3.2. Analysis by Patent Publication Year
- 7.3.3. Analysis by Year-wise Trend of Filed Patent Applications and Granted Patents
- 7.3.4. Analysis by Jurisdiction
- 7.3.5. Analysis by Type of Industry
- 7.3.6. Analysis by Patent Age
- 7.3.7. Analysis by Legal Status
- 7.3.8. Analysis by CPC Symbols
- 7.3.9. Most Active Players: Analysis by Number of Patents
- 7.3.10. Analysis by Key Inventors
- 7.4. AI in Oncology: Patent Benchmarking Analysis
- 7.4.1. Analysis by Patent Characteristics
- 7.4.2. AI in Oncology: Patent Valuation Analysis
8. PARTNERSHIPS AND COLLABORATIONS
- 8.1. Chapter Overview
- 8.2. Partnership Models
- 8.3 AI in Oncology: Recent Partnerships and Collaborations
- 8.3.1. Analysis by Year of Partnership
- 8.3.2. Analysis by Type of Partnership
- 8.3.3. Analysis by Year and Type of Partnership
- 8.3.4. Analysis by Company Size and Type of Partnership
- 8.3.5. Most Active Partners: Analysis by Number of Partnerships
- 8.3.6. Most Active Players: Analysis by Type of Partnership
- 8.3.7. Analysis by Type of Cancer
- 8.3.8. Analysis by Type of Partner
- 8.3.9. Analysis by Year and Type of Partner
- 8.3.10. Intercontinental and Intracontinental Agreements
- 8.3.11. Local and International Agreements
- 8.3.12. Country-Wise Distribution
- 8.3.13. Analysis by Region
9. FUNDING AND INVESTMENT ANALYSIS
- 9.1. Chapter Overview
- 9.2. Types of Funding Models
- 9.3. AI in Oncology: List of Funding and Investment Analysis
- 9.3.1. Analysis by Year and Number of Funding Instances
- 9.3.2. Analysis by Year and Amount Invested
- 9.3.3 Analysis by Type of Funding and Number of Instances
- 9.3.4. Analysis by Year, Type of Funding and Amount Invested
- 9.3.5. Analysis by Type of Funding and Amount Invested
- 9.3.6. Analysis by Area of Application
- 9.3.7. Analysis by Focus Area
- 9.3.8. Analysis by Type of Cancer Indication
- 9.3.9. Analysis by Geography
- 9.3.10. Most Active Players by Number of Instances
- 9.3.11. Most Active Players by Amount Invested
- 9.3.12. Analysis by Type of Investors
- 9.3.13. Analysis by Lead Investors
- 9.4. Summary of Investments
- 9.5. Concluding Remarks
10. BLUE OCEAN STRATEGY: A STRATEGIC GUIDE FOR START-UPS TO ENTER INTO HIGHLY COMPETITIVE MARKET
- 10.1. Chapter Overview
- 10.2. Overview of Blue Ocean Strategy
- 10.2.1 Red Ocean
- 10.2.2 Blue Ocean
- 10.2.3 Difference between Red Ocean Strategy and Blue Ocean Strategy
- 10.2.4. AI in Oncology: Blue Ocean Strategy and Shift Tools
- 10.2.4.1. Value Innovation
- 10.2.4.2. Strategy Canvas
- 10.2.4.3. Four Action Framework
- 10.2.4.4. Eliminate-Raise-Reduce-Create (ERRC) Grid
- 10.2.4.5. Six Path Framework
- 10.2.4.6. Pioneer-Migrator-Settler (PMS) Map
- 10.2.4.7. Three Tiers of Noncustomers
- 10.2.4.8. Sequence of Blue Ocean Strategy
- 10.2.4.9. Buyer Utility Map
- 10.2.4.10. The Price Corridor of the Mass
- 10.2.4.11. Four Hurdles to Strategy Execution
- 10.2.4.12. Tipping Point Leadership
- 10.2.4.13. Fair Process
- 10.3. Conclusion
11. MARKET SIZING AND OPPORTUNITY ANALYSIS
- 11.1. Chapter Overview
- 11.2 Key Assumptions and Methodology
- 11.3. Global Artificial Intelligence in Oncology Market
- 11.4. Artificial Intelligence in Oncology Market: Analysis by Type of Cancer
- 11.4.1. Artificial Intelligence in Oncology Market for Breast Cancer
- 11.4.2. Artificial Intelligence in Oncology Market for Lung Cancer
- 11.4.3. Artificial Intelligence in Oncology Market for Prostate Cancer
- 11.4.4. Artificial Intelligence in Oncology Market for Colorectal Cancer
- 11.4.5. Artificial Intelligence in Oncology Market for Brain Tumor
- 11.4.6. Artificial Intelligence in Oncology Market for Solid Malignancies
- 11.4.7. Artificial Intelligence in Oncology Market for Other Cancers
- 11.5. Artificial Intelligence in Oncology Market: Analysis by Type of End-User
- 11.5.1. Artificial Intelligence in Oncology Market for Hospitals
- 11.5.2. Artificial Intelligence in Oncology Market for Pharmaceutical Companies
- 11.5.3. Artificial Intelligence in Oncology Market for Research Institutes
- 11.5.4. Artificial Intelligence in Oncology Market for Other End-Users
- 11.6. Artificial Intelligence in Oncology Market: Analysis by Key Geographical Regions
- 11.6.1. Artificial Intelligence in Oncology Market for North America
- 11.6.2. Artificial Intelligence in Oncology Market for Europe
- 11.6.3. Artificial Intelligence in Oncology Market for Asia Pacific
- 11.6.4. Artificial Intelligence in Oncology Market for Rest of the World
12. CONCLUSION
- 12.1. Chapter Overview
13. EXECUTIVE INSIGHTS
14. APPENDIX 1: TABULATED DATA
15. APPENDIX 2: LIST OF COMPANIES AND ORGANIZATIONS

