
PUBLISHER: Roots Analysis | PRODUCT CODE: 1648564

PUBLISHER: Roots Analysis | PRODUCT CODE: 1648564
Global TIL Therapies Market by Target Indication, Key Players and Key Geographical Regions : Industry Trends and Global Forecasts, Till 2035
GLOBAL TIL THERAPIES MARKET: OVERVIEW
As per Roots Analysis, the global TIL therapy market is estimated to grow from USD 0.087 billion in the current year to USD 5 billion by 2035, at a CAGR of 40% during the forecast period, till 2035.
The market sizing and opportunity analysis has been segmented across the following parameters:
Target Indication
- Melanoma
- Head and Neck Carcinoma
- Chronic Lymphocytic Leukemia
- Sarcoma
- Hepatocellular Carcinoma
- Breast Cancer
- Acute Myeloid Leukemia
- Cervical Carcinoma
Key Geographical Regions
- North America
- Europe
- Asia-Pacific
- Middle East and North Africa
- Latin America
- Rest of the World
Key Players
GLOBAL TIL THERAPIES MARKET: GROWTH AND TRENDS
Recent advancements in modified tumor infiltrating lymphocytes (TIL)-based interventions highlight the potential of these innovative therapies for treating various oncological and non-oncological disorders. This highly specific and promising form of cell therapy, which is pre-sensitized to cancer specific antigens, is anticipated to revolutionize cancer treatment. It is worth noting that more than 100 clinical trials are currently underway to investigate TIL therapies across different geographies. Given the substantial evidence supporting the clinical advantages and therapeutic potential of TIL therapies, several investors have invested over USD 2.7 billion, across 30 instances. Moreover, clinical success is likely to draw in investments that are likely to support the ongoing and anticipated therapy development initiatives. Driven by the encouraging clinical trial results, ongoing pace of innovation and sufficient financial support from investors, the TIL therapy market is likely to witness significant growth during the forecast period.
GLOBAL TIL THERAPIES MARKET: KEY INSIGHTS
The report delves into the current state of the global TIL therapies market and identifies potential growth opportunities within the industry. Some key findings from the report include:
- Over 75 TIL-based therapies are being evaluated across different stages of preclinical / clinical development either as monotherapies or in combination with other drugs for the treatment of various oncological disorders.
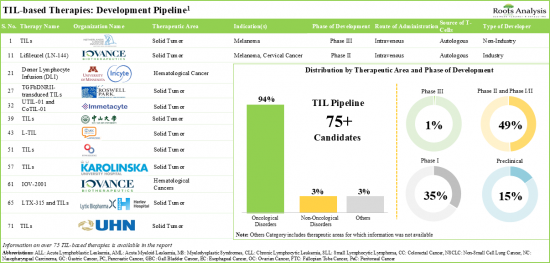
- Both industry and non-industry players have demonstrated keen interest in the development of novel TIL-based therapies; further, melanoma emerged as the most popular target indication.
- Majority (56%) of industry players based in North America are actively undertaking efforts for the development / commercialization of TIL-based cell therapies; the industry is dominated by the presence of mid-sized players.
- Over the past decade, close to 95 clinical trials have been registered across different geographies for the evaluation of TIL-based therapies; extensive efforts are underway to improve the successive generations of such therapies.
- Close to 55 scientists from renowned universities are presently involved in the clinical development of TIL-based therapies; majority of these KOLs are primarily based in the US and China.
- Close to 200 players claim to have the required capabilities to manufacture different types of cell therapies; such firms also offer a wide range of services across different stages of product development.
- A growing interest in the development of TIL-based therapies is reflected from the increase in R&D agreements in the last few years; majority of the such deals were signed between players based in North America.
- Several investors, having realized the opportunity within this upcoming segment of T-cell immunotherapy, have invested USD 2.7 billion, across 30 instances.
- More than 165 patents have been filed / granted by various stakeholders in order to protect the intellectual property generated within this field.
- With a growing focus on the development pipeline and encouraging clinical results, the market is expected to witness an annualized growth rate of 40% in the next decade.
GLOBAL TIL THERAPIES MARKET: KEY SEGMENTS
Currently, Melanoma Occupies the Largest Share of the Global TIL Therapies Market
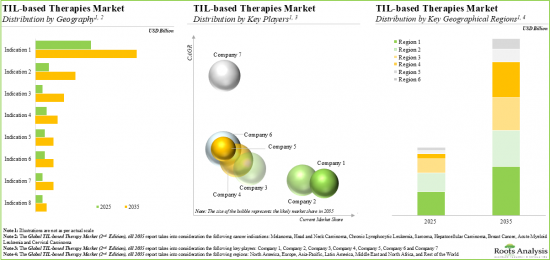
Based on the target indication, the market is segmented into melanoma, head and neck carcinoma, chronic lymphocytic leukemia, sarcoma, hepatocellular carcinoma, breast cancer, acute myeloid leukemia and cervical carcinoma. At present, melanoma holds the maximum share of the global TIL therapies market. This trend is unlikely to change in the near future.
North America Accounts for the Largest Share of the Market
Based on key geographical regions, the market is segmented into North America, Europe, Asia-Pacific, Middle East and North Africa, and Latin America. Currently, North America captures the maximum share of the global TIL therapies market. It is worth highlighting that, over the years, the market in Europe is expected to grow at a higher CAGR.
Example Players in the Global TIL Therapies Market
- Iovance Biotherapeutics
- Bristol-Myers Squibb
- Instil Bio
- Lytix Biopharma
- CAR-T (Shanghai) Cell Biotechnology
- Incyte Corporation
- Prometheus Laboratories
GLOBAL TIL THERAPIES MARKET: RESEARCH COVERAGE
- Market Sizing and Opportunity Analysis: The report features an in-depth analysis of the global TIL therapies market, focusing on key market segments, including [A] target indication, [B] key players and [C] key geographical regions.
- Market Landscape: A comprehensive evaluation of the overall market landscape of TIL therapy, considering various parameters, such as [A] type of developer, [B] phase of development, [C] therapeutic area, [D] key target indications, [E] source of T-cells, [F] route of administration, [G] dosing frequency, [H] target patient segment, [I] type of therapy and [J] developer landscape.
- Drug Profiles: In-depth profiles of mid- to late-stage clinical products (phase I/II or above), focusing on [A] overview of the therapy, [B] its mechanism of action, [C] dosage information, [D] details on the cost and sales information (wherever available), [E] a clinical development plan, and [F] clinical trial results.
- Company Profiles: In-depth profiles of key industry players in TIL therapy market, focusing on [A] company overviews, [B] product portfolio specific to TIL therapies [C] technology portfolio (if available), [D] recent developments related to TIL therapies and [E] the manufacturing capabilities of the companies.
- Clinical Trial Analysis: Examination of completed, ongoing, and planned clinical studies of various TIL therapies based on parameters like [A] trial registration year, [B] enrolled patient population, [C] trial status, [D] trial phase, [E] target patient segment, [F] type of sponsor / collaborator, [G] study design, [H] most active players (in terms of number of registered trials), [I] key focus areas and [J] geography.
- Key Opinion Leaders: An in-depth examination that emphasizes the key opinion leaders (KOLs) within this field includes an evaluation of various principal investigators overseeing clinical trials associated with TIL therapies. In addition, the chapter highlights the most prominent KOLs, based on third-party scoring criteria.
- Partnerships and Collaborations: An analysis of partnerships established in this sector, covering R&D agreements, license agreements (specific to technology platforms and product candidates), manufacturing agreements, clinical trial collaborations and others.
- Funding and Investment Analysis: A detailed evaluation of the investments made into companies having proprietary TIL therapies / technologies, encompassing venture capital financing, capital raised from IPOs and subsequent offerings, grants, and debt financing.
- Patent Analysis: Detailed analysis of various patents filed / granted related to tumor infiltrating lymphocytes based on [A] type of patent (granted and patent applications), [B] patent publication year, [C] geographical distribution, [D] type of player, [E] Cooperative Patent Classification (CPC) symbols, [F] emerging focus areas, [G] leading players (in terms of number of patents) and [H] patent benchmarking. It also includes a detailed patent valuation analysis.
- Case Study: A case study on manufacturing cell therapy products, highlighting the key challenges, and a detailed list of contract service providers and in-house manufacturers involved in this space.
- Cost Price Analysis: A comprehensive discussion on the various factors that are likely to influence the pricing of cell-based therapies. This includes an exploration of different models and approaches that pharmaceutical companies may consider while determining the prices of their lead therapy candidates that are likely to be marketed in the near future.
KEY QUESTIONS ANSWERED IN THIS REPORT
- How many companies are currently engaged in this market?
- Which are the leading companies in this market?
- What kind of partnership models are commonly adopted by industry stakeholders?
- What factors are likely to influence the evolution of this market?
- What is the current and future market size?
- What is the CAGR of this market?
- How is the current and future market opportunity likely to be distributed across key market segments?
REASONS TO BUY THIS REPORT
- The report provides a comprehensive market analysis, offering detailed revenue projections of the overall market and its specific sub-segments. This information is valuable to both established market leaders and emerging entrants.
- Stakeholders can leverage the report to gain a deeper understanding of the competitive dynamics within the market. By analyzing the competitive landscape, businesses can make informed decisions to optimize their market positioning and develop effective go-to-market strategies.
- The report offers stakeholders a comprehensive overview of the market, including key drivers, barriers, opportunities, and challenges. This information empowers stakeholders to stay abreast of market trends and make data-driven decisions to capitalize on growth prospects.
ADDITIONAL BENEFITS
- Complimentary PPT Insights Packs
- Complimentary Excel Data Packs for all Analytical Modules in the Report
- 10% Free Content Customization
- Detailed Report Walkthrough Session with Research Team
- Free Updated report if the report is 6-12 months old or older
TABLE OF CONTENTS
1. PREFACE
- 1.1. Introduction
- 1.2. Key Market Insights
- 1.3. Scope of the Report
- 1.4. Research Methodology
- 1.5. Key Questions Answered
- 1.6. Chapter Outlines
2. EXECUTIVE SUMMARY
3. INTRODUCTION
- 3.1. Chapter Overview
- 3.2. Pillars of Cancer Therapy
- 3.3. Overview of Immunotherapies
- 3.4. Fundamentals of Cancer Immunotherapy
- 3.5. Classification of Cancer Immunotherapies
- 3.5.1. By Mechanism of Action
- 3.5.2. By Type of Target
- 3.5.3. By Approach
- 3.5.4. By Product Class
- 3.6. T-Cell Immunotherapies
- 3.6.1. Historical Evolution
- 3.6.2. Key Considerations for Developing T-Cell Immunotherapies
- 3.6.3. Strategies Employed for the Redirection of T-Cells
- 3.6.4. Manufacturing of Engineered T-Cells
- 3.6.5. T-Cell Transduction and Transfection Methods
- 3.7. Tumor Infiltrating Lymphocyte (TIL)-based Cell Therapy
- 3.7.1. Development History
- 3.7.2. Development of TILs Therapy
- 3.8. Key Benefits and Roadblocks
- 3.9. Concluding Remarks
4. TIL-BASED THERAPIES: MARKET LANDSCAPE
- 4.1. Chapter Overview
- 4.2. TIL-based Therapies: Overall Market Landscape
- 4.2.1. Analysis by Type of Developer
- 4.2.2. Analysis by Phase of Development
- 4.2.3. Analysis by Therapeutic Area
- 4.2.4. Analysis by Key Target Indications
- 4.2.5. Analysis by Source of T-Cells
- 4.2.6. Analysis by Route of Administration
- 4.2.7. Analysis by Dosing Frequency
- 4.2.8. Analysis by Target Patient Segment
- 4.2.9. Analysis by Type of Therapy
- 4.2.10. Most Active Industry Players: Analysis by Number of TIL-based Therapies
- 4.2.11. Most Active Non-Industry Players: Analysis by Number of TIL-based Therapies
- 4.3. TIL-based Therapies: Overall Developer Landscape
- 4.3.1. Analysis by Year of Establishment
- 4.3.2. Analysis by Company Size
- 4.3.3. Analysis by Location of Headquarters
5. CLINICAL TRIAL ANALYSIS
- 5.1. Chapter Overview
- 5.2. Scope and Methodology
- 5.3. TIL-based Therapies: Clinical Trial Analysis
- 5.3.1. Analysis by Trial Registration Year
- 5.3.2. Analysis by Trial Registration Year and Enrolled Patient Population
- 5.3.3. Analysis by Trial Status
- 5.3.4. Analysis by Trial Registration Year and Trial Status
- 5.3.5. Analysis by Trial Phase
- 5.3.6. Analysis by Trial Phase and Enrolled Patient Population
- 5.3.7. Analysis by Target Patient Segment
- 5.3.8. Analysis by Type of Sponsor / Collaborator
- 5.3.9. Analysis by Study Design
- 5.3.10. Most Active Industry Players: Analysis by Number of Registered Trials
- 5.3.11. Most Active Non-Industry Players: Analysis by Number of Registered Trials
- 5.3.12. Word Cloud Analysis: Emerging Focus Areas
- 5.3.13. Analysis of Clinical Trials by Geography
- 5.3.14. Analysis of Enrolled Patient Population by Geography
6. KEY OPINION LEADERS
- 6.1. Chapter Overview
- 6.2. Assumptions and Key Parameters
- 6.3. Methodology
- 6.4. TIL-based Therapies: Key Opinion Leaders
- 6.4.1. Analysis by Type of Organization
- 6.4.2. Analysis by Affiliated Organization
- 6.4.3. Analysis by Qualification
- 6.4.4. Analysis by Geographical Location of KOLs
- 6.4.5. KOL Activeness versus KOL Strength
- 6.4.6. Most Prominent KOLs: Analysis by RA score
- 6.4.7. Most Prominent KOLs: Comparison of RA Score and Third-Party Score
7. TIL-BASED THERAPY PROFILES
- 7.1. Chapter Overview
- 7.2. LN-144 / Lifileucel (Iovance Biotherapeutics)
- 7.2.1. Therapy Overview
- 7.2.2. Clinical Trial Information
- 7.2.3. Clinical Trial Endpoints
- 7.2.4. Clinical Trial Results
- 7.2.5. Estimated Sales Revenues
- 7.3. LN-145 (Iovance Biotherapeutics)
- 7.3.1. Therapy Overview
- 7.3.2. Clinical Trial Information
- 7.3.3. Clinical Trial Endpoints
- 7.3.4. Clinical Trial Results
- 7.3.5. Estimated Sales Revenues
- 7.4. ITIL-168 (Instil Bio)
- 7.4.1. Therapy Overview
- 7.4.2. Clinical Trial Information
- 7.4.3. Clinical Trial Endpoints
- 7.4.4. Clinical Trial Results
- 7.4.5. Estimated Sales Revenues
- 7.5. LTX-315 (Lytix Biopharma)
- 7.5.1. Therapy Overview
- 7.5.2. Clinical Trial Information
- 7.5.3. Clinical Trial Endpoints
- 7.5.4. Clinical Trial Results
- 7.5.5. Estimated Sales Revenues
8. PARTNERSHIPS AND COLLABORATIONS
- 8.1. Chapter Overview
- 8.2. Partnership Models
- 8.3. TIL-based Therapies: Partnerships and Collaborations
- 8.3.1. Analysis by Year of Partnership
- 8.3.2. Analysis by Type of Partnership
- 8.3.3. Analysis by Year of Partnership and Type of Partnership
- 8.3.4. Analysis by Type of Partner
- 8.3.5. Most Popular Products: Analysis by Number of Partnerships
- 8.3.6. Most Active Industry Players: Analysis by Number of Partnerships
- 8.3.7. Most Active Non-Industry Players: Analysis by Number of Partnerships
- 8.3.8. Analysis by Geography
- 8.3.8.1. Intercontinental and Intracontinental Agreements
- 8.3.8.2. International and Local Deals
9. FUNDING AND INVESTMENT ANALYSIS
- 9.1. Chapter Overview
- 9.2. Type of Funding
- 9.3. TIL-based Therapies: Funding and Investment Analysis
- 9.3.1. Analysis by Year of Investment
- 9.3.2. Analysis by Amount Invested
- 9.3.3. Analysis by Type of Funding
- 9.3.4. Analysis by Type of Investor
- 9.3.5. Most Active Players: Analysis by Number of Instances
- 9.3.6. Most Active Investors: Analysis by Amount Invested
- 9.3.7. Analysis of Amount Invested by Geography
- 9.3.8. Most Active Investors: Analysis by Number of Funding Instances
10. PATENT ANALYSIS
- 10.1. Chapter Overview
- 10.2. Scope and Methodology
- 10.3. TIL-based Therapies: Patent Analysis
- 10.3.1. Analysis by Patent Publication Year
- 10.3.2. Analysis By Patent Application Year
- 10.3.3. Analysis by Geography
- 10.3.4. Analysis by Type of Player
- 10.3.5. Analysis by CPC Symbols
- 10.3.6. Word Cloud Analysis: Emerging Focus Areas
- 10.3.7. Leading Players: Analysis by Number of Patents
- 10.3.8. TIL-based Therapies: Patent Benchmarking
- 10.3.9. Analysis By Patent Characteristics
- 10.3.10. TIL-based Therapies: Patent Valuation
11. CASE STUDY: CELL THERAPY MANUFACTURING
- 11.1. Chapter Overview
- 11.2. Overview of Cell Therapy Manufacturing
- 11.3. Cell Therapy Manufacturing Models
- 11.3.1. Centralized Manufacturing Model
- 11.3.2. Decentralized Manufacturing Model
- 11.4. Scalability of Cell Therapy Manufacturing Processes
- 11.4.1. Scale-Up
- 11.4.2. Scale-Out
- 11.5. Types of Cell Therapy Manufacturers
- 11.6. Key Challenges Related to Manufacturing of Cell Therapies
- 11.7. Important Factors for Cell Therapy Manufacturing
- 11.7.1. Characterization
- 11.7.2. Cost of Goods
- 11.8. Automation of Cell Therapy Manufacturing Process
- 11.9. Cell Therapy Manufacturing Supply Chain
- 11.10. Comparison of Player Having In-House Capabilities and Contract Manufacturers
- 11.11. Regulatory Landscape
- 11.12. Future Perspectives
12. COST PRICE ANALYSIS
- 12.1. Chapter Overview
- 12.2. Factors Contributing to the High Price of Cell / Gene Therapies
- 12.3. Pricing Models for T-Cell Immunotherapies
- 12.3.1. Based on Associated Costs
- 12.3.2. Based on Availability of Competing Products
- 12.3.3. Based on Patient Segment
- 12.3.4. Based on Opinions of Industry Experts
- 12.4. Reimbursement related Considerations for T-Cell Immunotherapies
13. MARKET FORECAST AND OPPORTUNITY ANALYSIS
- 13.1. Chapter Overview
- 13.2. Scope and Limitations
- 13.3. Key Assumptions and Forecast Methodology
- 13.4. Global TIL-Based Therapies Market, since 2022
- 13.4.1. TIL-based Therapies Market: Analysis by Target Indication
- 13.4.2. TIL-based Therapies Market: Analysis by Key Players
- 13.4.3. TIL-based Therapies Market: Analysis by Key Geographical Regions
- 13.4.4. Product Wise Sales Forecast
- 13.4.4.1. Lifileucel / LN-144 (Iovance Biotherapeutics)
- 13.4.4.1.1. Sales Forecast (USD Million)
- 13.4.4.1.2. Net Present Value (USD Million)
- 13.4.4.1.3. Value Creation Analysis
- 13.4.4.2. LN-145 (Iovance Biotherapeutics)
- 13.4.4.2.1. Sales Forecast (USD Million)
- 13.4.4.2.2. Net Present Value (USD Million)
- 13.4.4.2.3. Value Creation Analysis
- 13.4.4.3. LTX-315 and TILs (Lytix Biopharma)
- 13.4.4.3.1. Sales Forecast (USD Million)
- 13.4.4.3.2. Net Present Value (USD Million)
- 13.4.4.3.3. Value Creation Analysis
- 13.4.4.4. TILs (Prometheus Laboratories)
- 13.4.4.4.1. Sales Forecast (USD Million)
- 13.4.4.4.2. Net Present Value (USD Million)
- 13.4.4.4.3. Value Creation Analysis
- 13.4.4.5. Donor Lymphocyte Infusion (Incyte)
- 13.4.4.5.1. Sales Forecast (USD Million)
- 13.4.4.5.2. Net Present Value (USD Million)
- 13.4.4.5.3. Value Creation Analysis
- 13.4.4.6. ITIL-168 (Instil Bio)
- 13.4.4.6.1. Sales Forecast (USD Million)
- 13.4.4.6.2. Net Present Value (USD Million)
- 13.4.4.6.3. Value Creation Analysis
- 13.4.4.7. IOV-2001 (Iovance Biotherapeutics)
- 13.4.4.7.1. Sales Forecast (USD Million)
- 13.4.4.7.2. Net Present Value (USD Million)
- 13.4.4.7.3. Value Creation Analysis
- 13.4.4.8. TILs (CAR-T (Shanghai) Cell Biotechnology)
- 13.4.4.8.1. Sales Forecast (USD Million)
- 13.4.4.8.2. Net Present Value (USD Million)
- 13.4.4.8.3. Value Creation Analysis
- 13.4.4.9. TILs (Bristol-Myers Squibb)
- 13.4.4.9.1. Sales Forecast (USD Million)
- 13.4.4.9.2. Net Present Value (USD Million)
- 13.4.4.9.3. Value Creation Analysis
- 13.4.4.1. Lifileucel / LN-144 (Iovance Biotherapeutics)
14. COMPANY PROFILES
- 14.1. Chapter Overview
- 14.2. Cellectis
- 14.3. Cellular Biomedicine Group
- 14.4. Iovance Biotherapeutics
- 14.5. Lytix Biopharma
- 14.6. Phio Pharmaceuticals
15. CONCLUDING REMARKS
16. EXECUTIVE INSIGHTS
17. APPENDIX I: TABULATED DATA
18. APPENDIX II: LIST OF COMPANIES AND ORGANIZATIONS
List of Tables
- Table 3.1 Types of Immunotherapies and Affiliated Mechanisms of Action
- Table 3.2 FDA Approved Antibody-based Cancer Therapeutics
- Table 3.3 Retroviral Vectors: Salient Features
- Table 3.4 Lentiviral Vectors: Salient Features
- Table 4.1 TIL-based Therapies: Clinical Pipeline
- Table 4.2 TIL-based Therapies: Information on Route of Administration, Source of T-Cells, Dosing Frequency, Target Patient Segment and Type of Therapy
- Table 4.3 TIL-based Therapies: Preclinical Pipeline
- Table 4.4 List of TIL-based Developers
- Table 7.1 TIL Cell Therapies: List of Therapies Profiled
- Table 7.2 Therapy Profile: LN-144 (Iovance Biotherapeutics)
- Table 7.3 LN-144: Clinical Trial Information
- Table 7.4 LN-144: Clinical Trial Endpoints
- Table 7.5 LN-144: Clinical Trial Results
- Table 7.6 Therapy Profile: LN-145 (Iovance Biotherapeutics)
- Table 7.7 LN-145: Clinical Trial Information
- Table 7.8 LN-145: Clinical Trial Endpoints
- Table 7.9 LN-145: Clinical Trial Results
- Table 7.10 Therapy Profile: ITIL-168 (Instil Bio)
- Table 7.11 ITIL-168: Clinical Trial Information
- Table 7.12 ITIL-168: Clinical Trial Endpoints
- Table 7.13 ITIL-168: Clinical Trial Results
- Table 7.14 Therapy Profile: LTX-315 (Lytix Biopharma)
- Table 7.15 LTX-315: Clinical Trial Information
- Table 7.16 LTX-315: Clinical Trial Endpoints
- Table 7.17 LTX-315: Clinical Trial Results
- Table 8.1 List of Partnerships and Collaborations, since 2005
- Table 9.1 List of Funding and Investments, since 2007
- Table 9.2 Funding and Investment Analysis: Summary of Investments
- Table 10.1 Patent Analysis: Prominent CPC Symbols
- Table 10.2 Patent Analysis: Most Popular CPC Symbols
- Table 10.3 Patent Analysis: List of Top CPC Symbols
- Table 10.4 Patent Analysis: Summary of Benchmarking Analysis
- Table 10.5 Patent Analysis: Categorization based on Weighted Valuation Scores
- Table 11.1 Assessment Strategies for Different Manufacturing Processes
- Table 11.2 Advantages and Disadvantages of Centralized and Decentralized Manufacturing Models
- Table 11.3 Cell Therapy Manufacturing: Companies with In-House Capabilities and Contract Manufacturers
- Table 12.1 Price of Marketed Gene / Cell Therapies
- Table 12.2 Price of Marketed Targeted Drugs
- Table 12.3 TIL-based Therapies: Expert Opinions on Pricing
- Table 12.4 TIL-based Therapies: Reimbursement Landscape
- Table 13.1 TIL-based Therapies: List of Forecasted Molecules
- Table 13.2 Lifileucel / LN-144 (Iovance Biotherapeutics): Net Present Value (USD Million)
- Table 13.3 Lifileucel / LN-144 (Iovance Biotherapeutics): Value Creation Analysis (USD Million)
- Table 13.4 LN-145 (Iovance Biotherapeutics): Net Present Value (USD Million)
- Table 13.5 LN-145 (Iovance Biotherapeutics): Value Creation Analysis (USD Million)
- Table 13.6 LTX-315 and TILs (Lytix Biopharma): Net Present Value (USD Million)
- Table 13.7 LTX-315 and TILs (Lytix Biopharma): Value Creation Analysis (USD Million)
- Table 13.8 TILs (Prometheus Laboratories): Net Present Value (USD Million)
- Table 13.9 TILs (Prometheus Laboratories): Value Creation Analysis (USD Million)
- Table 13.10 Donor Lymphocyte Infusion (Incyte): Net Present Value (USD Million)
- Table 13.11 Donor Lymphocyte Infusion (Incyte): Value Creation Analysis (USD Million)
- Table 13.12 ITIL-168 (Instil Bio): Net Present Value (USD Million)
- Table 13.13 ITIL-168 (Instil Bio): Value Creation Analysis (USD Million)
- Table 13.14 IOV-2001 (Iovance Biotherapeutics): Net Present Value (USD Million)
- Table 13.15 IOV-2001 (Iovance Biotherapeutics): Value Creation Analysis (USD Million)
- Table 13.16 TILs (CAR-T (Shanghai) Cell Biotechnology): Net Present Value (USD Million)
- Table 13.17 TILs (CAR-T (Shanghai) Cell Biotechnology): Value Creation Analysis (USD Million)
- Table 13.18 TILs (Bristol-Myers Squibb): Net Present Value (USD Million)
- Table 13.19 TILs (Bristol-Myers Squibb): Value Creation Analysis (USD Million)
- Table 14.1 Leading TIL-based Therapy Developers
- Table 14.2 Cellectis: Company Profile
- Table 14.3 Cellular Biomedicine Group: Company Profile
- Table 14.4 Iovance Biotherapeutics: Company Profile
- Table 14.5 Lytix Biopharma: Company Profile
- Table 14.6 Phio Pharmaceuticals: Company Profile
- Table 17.1 TIL-based Therapies: Distribution by Type of Developer
- Table 17.2 TIL-based Therapies: Distribution by Phase of Development
- Table 17.3 TIL-based Therapies: Distribution by Therapeutic Area
- Table 17.4 TIL-based Therapies: Distribution by Key Target Indications
- Table 17.5 TIL-based Therapies: Distribution by Source of T-Cells
- Table 17.6 TIL-based Therapies: Distribution by Route of Administration
- Table 17.7 TIL-based Therapies: Distribution by Dosing Frequency
- Table 17.8 TIL-based Therapies: Distribution by Target Patient Segment
- Table 17.9 TIL-based Therapies: Distribution by Type of Therapy
- Table 17.10 Most Active Industry Players: Analysis by Number of TIL-based Therapies
- Table 17.11 Most Active Non-Industry Players: Distribution by Number of TIL-based Therapies
- Table 17.12 TIL-based Therapy Developers: Distribution by Year of Establishment
- Table 17.13 TIL-based Therapy Developers: Distribution by Company Size
- Table 17.14 TIL-based Therapy Developers: Distribution by Location of Headquarters (Region-wise)
- Table 17.15 TIL-based Therapy Developers: Distribution by Location of Headquarters (Country-wise)
- Table 17.16 Clinical Trial Analysis: Cumulative Distribution of Trials by Trial Registration Year
- Table 17.17 Clinical Trial Analysis: Distribution of Enrolled Patient Population by Trial Registration Year
- Table 17.18 Clinical Trial Analysis: Distribution by Trial Status
- Table 17.19 Clinical Trial Analysis: Distribution by Trial Registration Year and Trial Status
- Table 17.20 Clinical Trial Analysis: Distribution of Trials by Trial Phase
- Table 17.21 Clinical Trial Analysis: Distribution of Enrolled Patient Population by Trial Phase
- Table 17.22 Clinical Trial Analysis: Distribution by Target Patient Segment
- Table 17.23 Clinical Trial Analysis: Distribution by Type of Sponsor / Collaborator
- Table 17.24 Clinical Trial Analysis: Distribution by Study Design
- Table 17.25 Most Active Industry Players: Distribution by Number of Registered Trials
- Table 17.26 Most Active Non-Industry Players: Distribution by Number of Registered Trials
- Table 17.27 Clinical Trial Analysis: Distribution of Trials by Geography
- Table 17.28 Clinical Trial Analysis: Distribution of Completed Clinical Trials by Geography
- Table 17.29 Clinical Trial Analysis: Distribution of Active Clinical Trials by Geography
- Table 17.30 Clinical Trial Analysis: Distribution of Enrolled Patient Population by Geography
- Table 17.31 KOL Analysis: Distribution by Type of Organization
- Table 17.32 KOL Analysis: Distribution by Affiliated Organization
- Table 17.33 KOL Analysis: Distribution by Qualification
- Table 17.34 KOL Analysis: Distribution by Geography
- Table 17.35 Most Prominent KOLs: Distribution by RA Score
- Table 17.36 Most Prominent KOLs: Comparison of RA Score with Third-Party Score
- Table 17.37 LN-144: Estimated Sales Revenues
- Table 17.38 LN-145: Estimated Sales Revenues
- Table 17.39 ITIL-168: Estimated Sales Revenues
- Table 17.40 LTX-315: Estimated Sales Revenues
- Table 17.41 Partnerships and Collaborations: Cumulative Year-Wise Trend
- Table 17.42 Partnerships and Collaborations: Distribution by Type of Partnership
- Table 17.44 Partnerships and Collaborations: Distribution by Type of Partnership
- Table 17.45 Partnerships and Collaborations: Distribution by Type of Partner
- Table 17.46 Partnerships and Collaborations: Year-Wise Distribution by Type of Partner
- Table 17.47 Most Popular Products: Distribution by Number of Partnerships
- Table 17.48 Most Active Industry Players: Distribution by Number of Partnerships
- Table 17.49 Most Active Non-Industry Players: Distribution by Number of Partnerships
- Table 17.50 Partnerships and Collaborations: Distribution of Intercontinental and Intracontinental Deals
- Table 17.51 Partnerships and Collaborations: Distribution of International and Local Deals
- Table 17.52 Funding and Investment Analysis: Cumulative Distribution of Instances by Year
- Table 17.53 Funding and Investment Analysis: Cumulative Distribution of Amount Invested by Year (USD Million)
- Table 17.54 Funding and Investment Analysis: Distribution of Instances by Type of Funding
- Table 17.55 Funding and Investment Analysis: Distribution of Total Amount Invested by Type of Funding (USD Million)
- Table 17.56 Funding and Investment Analysis: Distribution by Type of Investor
- Table 17.57 Funding and Investment Analysis: Distribution of Amount Invested by Type of Investor (USD Million)
- Table 17.58 Most Active Players: Distribution by Number of Instances
- Table 17.59 Most Active Players: Distribution by Amount Invested (USD Million)
- Table 17.60 Funding and Investment Analysis: Distribution of Amount Invested by Geography
- Table 17.61 Patent Analysis: Distribution by Type of Patent
- Table 17.62 Patent Analysis: Cumulative Distribution by Patent Publication Year
- Table 17.63 Patent Analysis: Cumulative Distribution Patent Application Year
- Table 17.64 Patent Analysis: Cumulative Distribution by Annual Granted Patents
- Table 17.65 Patent Analysis: Cumulative Year-wise Distribution of Filed Patent Applications
- Table 17.66 Patent Analysis: Year-wise Distribution of Granted Patents and Patent Applications
- Table 17.67 Patent Analysis: Distribution by Geography
- Table 17.68 Patent Analysis: Distribution by Type of Player
- Table 17.69 Patent Analysis: Distribution by CPC Symbols
- Table 17.70 Leading Industry Players: Distribution by Number of Patents
- Table 17.71 Leading Non-Industry Players: Distribution by Number of Patents
- Table 17.72 Leading Patent Assignees: Distribution by Number of Patents
- Table 17.73 Patent Analysis: Distribution by Patent Age
- Table 17.74 TIL-based Therapies: Patent Valuation Analysis
List of Figures
- Figure 2.1 Executive Summary: Overall Market Landscape
- Figure 2.2 Executive Summary: Clinical Trial Analysis
- Figure 2.3 Executive Summary: Partnerships and Collaborations
- Figure 2.4 Executive Summary: Funding and Investment Analysis
- Figure 2.5 Executive Summary: Patent Analysis
- Figure 2.6 Executive Summary: Market Forecast and Opportunity Analysis
- Figure 3.1 Pillars of Cancer Therapy
- Figure 3.2 Differences between Active and Passive Immunotherapies
- Figure 3.3 Differences between Specific and Non-Specific Immunotherapies
- Figure 3.4 Strategies Employed for the Redirection of T-Cells
- Figure 3.5 T-Cell Manufacturing: General Procedure
- Figure 3.6 TIL-based Therapies: Development Process
- Figure 4.1 TIL-based Therapies: Distribution by Type of Developer
- Figure 4.2 TIL-based Therapies: Distribution by Phase of Development
- Figure 4.3 TIL-based Therapies: Distribution by Therapeutic Area
- Figure 4.4 TIL-based Therapies: Distribution by Key Target Indications
- Figure 4.5 TIL-based Therapies: Distribution by Source of T-Cells
- Figure 4.6 TIL-based Therapies: Distribution by Route of Administration
- Figure 4.7 TIL-based Therapies: Distribution by Dosing Frequency
- Figure 4.8 TIL-based Therapies: Distribution by Target Patient Segment
- Figure 4.9 TIL-based Therapies: Distribution by Type of Therapy
- Figure 4.10 Most Active Industry Players: Distribution by Number of TIL-based Therapies
- Figure 4.11 Most Active Non-Industry Players: Distribution by Number of TIL-based Therapies
- Figure 4.12 TIL-based Therapy Developers: Distribution by Year of Establishment
- Figure 4.13 TIL-based Therapy Developers: Distribution by Company Size
- Figure 4.14 TIL-based Therapy Developers: Distribution by Location of Headquarters (Region-wise)
- Figure 4.15 TIL-based Therapy Developers: Distribution by Location of Headquarters (Country-wise)
- Figure 5.1 Clinical Trial Analysis: Scope and Methodology
- Figure 5.2 Clinical Trial Analysis: Cumulative Distribution of Trials by Trial Registration Year
- Figure 5.3 Clinical Trial Analysis: Distribution of Enrolled Patient Population by Trial Registration Year
- Figure 5.4 Clinical Trial Analysis: Distribution by Trial Status
- Figure 5.5 Clinical Trial Analysis: Distribution by Trial Registration Year and Trial Status
- Figure 5.6 Clinical Trial Analysis: Distribution of Trials by Trial Phase
- Figure 5.7 Clinical Trial Analysis: Distribution of Enrolled Patient Population by Trial Phase
- Figure 5.8 Clinical Trial Analysis: Distribution by Target Patient Segment
- Figure 5.9 Clinical Trial Analysis: Distribution by Type of Sponsor / Collaborator
- Figure 5.10 Clinical Trial Analysis: Distribution by Study Design
- Figure 5.11 Most Active Industry Players: Distribution by Number of Registered Trials
- Figure 5.12 Most Active Non-Industry Players: Distribution by Number of Registered Trials
- Figure 5.13 Word Cloud Analysis: Emerging Focus Areas
- Figure 5.14 Clinical Trial Analysis: Distribution of Trials by Geography
- Figure 5.15 Clinical Trial Analysis: Distribution of Completed Clinical Trials by Geography
- Figure 5.16 Clinical Trial Analysis: Distribution of Active Clinical Trials by Geography
- Figure 5.17 Clinical Trial Analysis: Distribution of Enrolled Patient Population by Geography
- Figure 6.1 KOL Analysis: Distribution by Type of Organization
- Figure 6.2 KOL Analysis: Distribution by Affiliated Organization
- Figure 6.3 KOL Analysis: Distribution by Qualification
- Figure 6.4 KOL Analysis: Distribution by Geography
- Figure 6.5 TIL-based Therapies Scatter Plot: KOL Activeness versus KOL Strength
- Figure 6.6 Most Prominent KOLs: KOL Activeness versus KOL Strength
- Figure 6.7 Most Prominent KOLs: Distribution by RA Score
- Figure 6.8 Most Prominent KOLs: Comparison of RA Score with Third-Party Score
- Figure 6.9 Most Prominent KOLs: Comparison of RA Score with Third-Party Score (Scatter Plot)
- Figure 7.1 LN-144: Estimated Sales Revenues
- Figure 7.2 LN-145: Estimated Sales Revenues
- Figure 7.3 ITIL-168: Estimated Sales Revenues
- Figure 7.4 LTX-315: Estimated Sales Revenues
- Figure 8.1 Partnerships and Collaborations: Cumulative Year-Wise Trend
- Figure 8.2 Partnerships and Collaborations: Distribution by Type of Partnership
- Figure 8.3 Partnerships and Collaborations: Distribution by Type of Partnership
- Figure 8.4 Partnerships and Collaborations: Distribution by Year and Type of Partnership
- Figure 8.5 Partnerships and Collaborations: Distribution by Type of Partner
- Figure 8.6 Partnerships and Collaborations: Year-Wise Distribution by Type of Partner
- Figure 8.7 Most Popular Products: Distribution by Number of Partnerships
- Figure 8.8 Most Active Industry Players: Distribution by Number of Partnerships
- Figure 8.9 Most Active Non-Industry Players: Distribution by Number of Partnerships
- Figure 8.10 Partnerships and Collaborations: Intercontinental and Intracontinental Deals
- Figure 8.11 Partnerships and Collaborations: International and Local Deals
- Figure 9.1 Funding and Investment Analysis: Cumulative Year-wise Distribution of Instances
- Figure 9.2 Funding and Investment Analysis: Cumulative Year-wise Distribution of Amount Invested (USD Million)
- Figure 9.3 Funding and Investment Analysis: Distribution of Instances by Type of Funding
- Figure 9.4 Funding and Investment Analysis: Distribution of Amount Invested by Type of Funding (USD Million)
- Figure 9.5 Funding and Investment Analysis: Distribution by Type of Investor
- Figure 9.6 Funding and Investment Analysis: Distribution of Amount Invested by Type of Investor (USD Million)
- Figure 9.7 Most Active Players: Distribution by Number of Instances
- Figure 9.8 Most Active Players: Distribution by Amount Invested (USD Million)
- Figure 9.9 Funding and Investment Analysis: Distribution of Amount Invested by Geography
- Figure 10.1 Patent Analysis: Distribution by Type of Patent
- Figure 10.2 Patent Analysis: Cumulative Distribution by Patent Publication Year
- Figure 10.3 Patent Analysis: Cumulative Distribution by Patent Application Year
- Figure 10.4 Patent Analysis: Cumulative Year-wise Distribution of Granted Patents
- Figure 10.5 Patent Analysis: Cumulative Year-wise Distribution of Filed Patent Applications
- Figure 10.6 Patent Analysis: Year-wise Distribution of Filed Patent Applications and Granted Patents
- Figure 10.7 Patent Analysis: Distribution by Geography
- Figure 10.8 Patent Analysis: Distribution by Type of Player
- Figure 10.9 Patent Analysis: Distribution by CPC Symbols
- Figure 10.10 Word Cloud Analysis: Emerging Focus Areas
- Figure 10.11 Leading Industry Players: Distribution by Number of Patents
- Figure 10.12 Leading Non-Industry Players: Distribution by Number of Patents
- Figure 10.13 Leading Patent Assignees: Distribution by Number of Patents
- Figure 10.14 Leading Players: Benchmarking by Patent Characteristics (CPC Symbols)
- Figure 10.15 Patent Analysis: Distribution by Patent Age
- Figure 10.16 TIL-based Cell Therapies: Patent Valuation Analysis
- Figure 11.1 Steps for Manufacturing Cell Therapies
- Figure 11.2 Centralized Manufacturing: Process Model
- Figure 11.3 Decentralized Manufacturing: Process Model
- Figure 11.4 Cell Therapy Manufacturing: Types of Manufacturers
- Figure 11.5 Cell Therapy: Challenges and Drivers
- Figure 11.6 Cell Therapies: Potency as Critical Quality Attribute
- Figure 11.7 Cell Therapy Manufacturing: Supply Chain Model
- Figure 11.8 Cell Therapy Manufacturing: Supply Chain Risk Assessment Considerations
- Figure 12.1 Approved T-Cell Therapies: Pricing Model based on Patient Segment
- Figure 13.1 Global TIL-based Therapies Market, till 2035 (USD Billion)
- Figure 13.2 TIL-based Therapies Market: Distribution by Target Indication, Current Year and 2035 (USD Billion)
- Figure 13.3 TIL-based Therapies Market: Distribution by Key Players, Current Year and 2035 (USD Billion)
- Figure 13.4 TIL-based Therapies Market: Distribution by Geography, Current Year and 2035 (USD Billion)
- Figure 13.5 Lifileucel / LN-144 (Iovance Biotherapeutics) Sales Forecast, till 2035 (USD Million)
- Figure 13.6 LN-145 (Iovance Biotherapeutics) Sales Forecast, till 2035 (USD Million)
- Figure 13.7 LTX-315 and TILs (Lytix Biopharma) Sales Forecast, till 2035 (USD Million)
- Figure 13.8 TILs (Prometheus Laboratories) Sales Forecast, till 2035 (USD Million)
- Figure 13.9 Donor Lymphocyte Infusion (Incyte) Sales Forecast, till 2035 (USD Million)
- Figure 13.10 ITIL-168 (Instil Bio) Sales Forecast, till 2035 (USD Million)
- Figure 13.11 IOV-2001 (Iovance Biotherapeutics) Sales Forecast, till 2035 (USD Million)
- Figure 13.12 TILs (CAR-T (Shanghai) Cell Biotechnology) Sales Forecast, till 2035 (USD Million)
- Figure 13.13 TILs (Bristol-Myers Squibb) Sales Forecast, till 2035 (USD Million)
- Figure 15.1 Concluding Remarks: Market Landscape
- Figure 15.2 Concluding Remarks: Clinical Trial Analysis
- Figure 15.3 Concluding Remarks: Key Opinion Leaders
- Figure 15.4 Concluding Remarks: Partnerships & Collaborations
- Figure 15.5 Concluding Remarks: Funding and Investment Analysis
- Figure 15.6 Concluding Remarks: Patent Analysis
- Figure 15.7 Concluding Remarks: Market Forecast

