
PUBLISHER: Roots Analysis | PRODUCT CODE: 1648560

PUBLISHER: Roots Analysis | PRODUCT CODE: 1648560
GLP-1 Market by Type of Molecule, Active Compound Used, Type of GLP-1 Agonist Drugs, Type of Agonist Route of Administration, Target indication and Key Geographical Regions : Industry Trends and Global Forecasts, Till 2035
GLP-1 MARKET: OVERVIEW
As per Roots Analysis, the global GLP-1 market is estimated to grow from USD 49.3 billion in the current year to USD 157.5 billion by 2035, at a CAGR of 11.1% during the forecast period, till 2035.
The market sizing and opportunity analysis has been segmented across the following parameters:
Type of Molecule
- Biologics
- Small Molecules
Active Compound Used
- Dulaglutide
- Liraglutide
- Orforglipron
- Retatrutide
- Semaglutide
- Survodutide
- Tirzepatide
- Other Active Compounds
Type of GLP-1 Agonist Drugs
- Long-acting GLP-1 Agonist
- Short-acting GLP-1 Agonist
Type of Agonist
- Single agonist
- Dual agonist
- Tri-agonist
Route of Administration
- Oral
- Parenteral
Target Indication
- Alzheimer's Disease
- Non-Alcoholic Steatohepatitis
- Obesity
- Sleep Apnea
- Type 2 Diabetes
Key Geographical Regions
- North America (US, Canada)
- Europe (Germany, UK, France, Italy, Spain, Netherlands, Rest of Europe)
- Asia-Pacific
- Latin America
GLP-1 MARKET: GROWTH AND TRENDS
According to the World Health Organization (WHO), more than 1 billion individuals are suffering from obesity, worldwide; of these, 650 million individuals are adults. It is estimated that 4 million people die annually due to obesity. In addition, a recent study indicates that close to 530 million adult population suffers from diabetes globally; of these, 98% of the population is expected to have type 2 diabetes. Considering the growing burden of obesity and diabetes, there has been a rise in the need for safe and effective medications. As a result, various companies have started developing and evaluating potential candidates targeting these indications.
In the recent past, GLP-1 drugs have emerged as a promising option. It is worth highlighting that 15 GLP-1 drugs have been commercialized for targeting various indications. Additionally, more than 135 drug candidates are currently being evaluated across various phases of development. Driven by the new drug approvals (for different applications), and extensive R&D efforts of the companies (to enhance delivery mechanisms of GLP-1 drugs), the market is anticipated to witness steady growth in the coming decade.
GLP-1 MARKET: KEY INSIGHTS
The report delves into the current state of the GLP-1 market and identifies potential growth opportunities within the industry. Some key findings from the report include:
- More than 150 GLP-1 drug candidates, intended for the treatment of multiple indications, are currently either approved or being investigated by pharmaceutical companies.
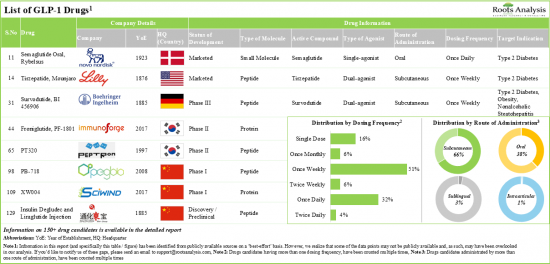
- ~60% of the GLP-1 drug candidates are currently being evaluated in clinical stages of development; of these, most of the candidates target metabolic disorders, such as Type 2 diabetes and obesity.
- The current market landscape of GLP-1 drugs is fragmented, featuring the presence of both new entrants and established players; majority of these firms are based in China (36%) and the US (28%).
- Partnerships related to GLP-1 drugs have steadily grown in the recent past; notably, close to 50% of these deals were signed for drug development and commercialization.
- Lifestyle changes, influence of social media, celebrity endorsements and direct to consumer advertisements have led to a surge in the demand for GLP-1 drugs.
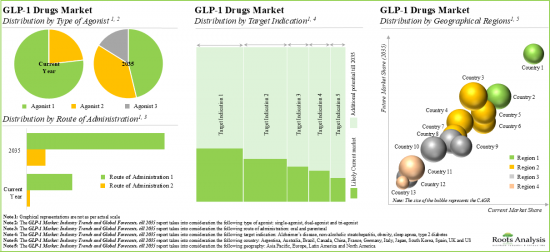
- The GLP-1 market is anticipated to grow at a CAGR of 11.1%, during the forecasted period; biologics segment is expected to capture the majority share (over 65%) of the market by 2035.
GLP-1 MARKET: KEY SEGMENTS
Currently, Small Molecules Occupy the Largest Share of the GLP-1 Market
Based on the type of molecule, the market is segmented into biologics and small molecules. At present, the small molecules segment holds the maximum share of the GLP-1 market. It is worth highlighting that owing to the unique physiological properties of biologics, including stability, specificity, selectivity and ability to block specific protein-protein interactions, the biologics segment is likely to grow at a relatively higher CAGR.
Survodutide Active Compound is the Fastest Growing Segment of the GLP-1 Market During the Forecast Period
Based on the active compound, the market is segmented into dulaglutide, liraglutide, orforglipron, retatrutide, semaglutide, survodutide, tirzepatide and other active compounds. At present, semaglutide holds the maximum share of the GLP-1 market. Further, it is worth highlighting that survodutide is likely to drive the market in the near future.
Currently, Long-Acting GLP-1 Agonists Occupy the Largest Share of the GLP-1 Market
Based on the type of GLP-1 agonists drugs, the market is segmented into short-acting GLP-1 agonist and long-acting GLP-1 agonist. At present, long-acting GLP-1 agonist holds the maximum share of the GLP-1 market and this trend is likely to remain the same in the forthcoming years. This can be attributed to the fact that the effect of the long-acting drug lasts longer than that of short-acting agonists. It is worth highlighting that short-acting GLP-1 agonist segment is likely to grow at a relatively higher CAGR.
At Present, Single-agonist Segment Occupies the Largest Share of the GLP-1 Market
Based on the type of GLP-1 agonist, the market is segmented into single-agonist, dual-agonist and tri-agonist. Currently, the single-agonist segment holds the maximum share of the GLP-1 market. It is worth highlighting that tri-agonist segment is likely to grow at a relatively higher CAGR.
Oral Route of Administration is the Fastest Growing Segment in the GLP-1 Market During the Forecast Period
Based on the route of administration, the market is segmented into oral route and parenteral route. At present, the parenteral route holds a larger share of the GLP-1 market. This trend is likely to remain the same in the coming decade. Further, it is worth noting that oral route of administration is likely to grow at a relatively higher CAGR.
Type 2 Diabetes Accounts for the Largest Share of the GLP-1 Market
Based on the target indication, the market is segmented into Alzheimer's Disease, non-alcoholic steatohepatitis, obesity, sleep apnea, and type 2 diabetes. While type 2 diabetes account for a relatively higher market share, it is worth highlighting that the non-alcoholic steatohepatitis segment is expected to witness substantial market growth in the coming years.
North America Accounts for the Largest Share of the Market
Based on key geographical regions, the market is segmented into North America, Europe, Asia-Pacific and Latin America. It is worth highlighting that, over the years, the market in Asia-Pacific is expected to grow at a higher CAGR.
Example Players in the GLP-1 Market
- AstraZeneca
- Biolingus
- Boehringer Ingelheim
- D&D Pharmatech
- Eli Lilly
- Gmax Biopharm
- Hanmi Pharmaceutical
- Innogen
- Novo Nordisk
- PegBio
- Pfizer
- QL Biopharma
- Roche
- Sanofi
- Sciwind Biosciences
- Tonghua Dongbao Pharmaceutical
- Viking Therapeutics
- Vivani
- vTv Therapeutic
GLP-1 MARKET: RESEARCH COVERAGE
- Market Sizing and Opportunity Analysis: The report features an in-depth analysis of the GLP-1 market, focusing on key market segments, including [A] type of molecule, [B] active compound used, [C] type of glp-1 agonist drugs, [D] type of agonist, [E] target indication and [F] geographical regions.
- Market Landscape: A comprehensive evaluation of GLP-1 drugs, considering various parameters, such as [A] stage of development, [B] type of molecule, [C] active compound used, [D] GLP-1 agonist, [E] route of administration, [F] dosing frequency, [G] type of therapy, [H] target indication and [I] therapeutic area. Additionally, it provides a detailed list of developers engaged in developing GLP-1 drugs, along with information on various parameters, such as [J] year of establishment, [K] company size (in terms of employee count) and [L] location of headquarters.
- Company Profiles: In-depth profiles of key industry players engaged in the development of GLP-1 drugs, focusing on [A] company overviews, [B] financial information, [C] drug portfolio, [D] recent developments and [E] an informed future outlook.
- Partnerships and Collaborations: An analysis of partnerships established in this sector, since 2020, based on several parameters, such as [A] year of partnership, [B] type of partnership, [C] type of molecule, [D] type of partner, [E] most active players (in terms of the number of partnerships signed) and [F] regional distribution of partnership activity in this domain.
- Market Impact Analysis: The report analyzes various factors such as drivers, restraints, opportunities, and challenges affecting the market growth.
KEY QUESTIONS ANSWERED IN THIS REPORT
- How many companies are currently engaged in this market?
- Which are the leading companies in this market?
- What kind of partnership models are commonly adopted by industry stakeholders?
- What factors are likely to influence the evolution of this market?
- What is the current and future market size?
- What is the CAGR of this market?
- How is the current and future market opportunity likely to be distributed across key market segments?
REASONS TO BUY THIS REPORT
- The report provides a comprehensive market analysis, offering detailed revenue projections of the overall market and its specific sub-segments. This information is valuable to both established market leaders and emerging entrants.
- Stakeholders can leverage the report to gain a deeper understanding of the competitive dynamics within the market. By analyzing the competitive landscape, businesses can make informed decisions to optimize their market positioning and develop effective go-to-market strategies.
- The report offers stakeholders a comprehensive overview of the market, including key drivers, barriers, opportunities, and challenges. This information empowers stakeholders to stay abreast of market trends and make data-driven decisions to capitalize on growth prospects.
ADDITIONAL BENEFITS
- Complimentary PPT Insights Packs
- Complimentary Excel Data Packs for all Analytical Modules in the Report
- 10% Free Content Customization
- Detailed Report Walkthrough Session with Research Team
- Free Updated report if the report is 6-12 months old or older
TABLE OF CONTENTS
1. BACKGROUND
- 1.1. Context
- 1.2. Project Objectives
2. RESEARCH METHODOLOGY
- 2.1. Chapter Overview
- 2.2. Research Assumptions
- 2.3. Project Methodology
- 2.4. Forecast Methodology
- 2.5. Robust Quality Control
- 2.6. Key Market Segmentations
- 2.7. Key Considerations
- 2.7.1. Demographics
- 2.7.2. Economic Factors
- 2.7.3. Government Regulations
- 2.7.4. Supply Chain
- 2.7.5. COVID Impact
- 2.7.6. Market Access
- 2.7.7. Healthcare Policies
- 2.7.8. Industry Consolidation
3. ECONOMIC AND OTHER PROJECT SPECIFIC CONSIDERATIONS
- 3.1. Chapter Overview
- 3.2. Market Dynamics
- 3.2.1. Time Period
- 3.2.1.1. Historical Trends
- 3.2.1.2. Current and Forecasted Estimates
- 3.2.2. Currency Coverage and Foreign Exchange Rate
- 3.2.2.1. Major Currencies Affecting the Market
- 3.2.2.2. Factors affecting Currency Fluctuations and Foreign Exchange Rates
- 3.2.2.3. Impact of Foreign Exchange Rate Volatility on Market
- 3.2.2.4. Strategies For Mitigating Foreign Exchange Risk
- 3.2.3. Trade Policies
- 3.2.3.1. Impact of Trade Barriers on the Market
- 3.2.3.2. Strategies for Mitigating the Risks Associated with Trade Barriers
- 3.2.4. Recession
- 3.2.4.1. Historical Analysis of Past Recessions and Lessons Learnt
- 3.2.4.2. Assessment of Current Economic Conditions and Potential Impact on the Market
- 3.2.5. Inflation
- 3.2.5.1. Measurement and Analysis of Inflationary Pressures in the Economy
- 3.2.5.2. Potential Impact of Inflation on the Market Evolution
- 3.2.1. Time Period
4. EXECUTIVE SUMMARY
5. INTRODUCTION
- 5.1. Overview of the GLP-1 Drug
- 5.1.1. Challenges Associated with GLP-1 Drugs
- 5.1.2. Mechanism of Action of GLP-1 Drugs
- 5.2. Important Facts in GLP-1 Domain
- 5.3. Future Perspectives
6. MARKET LANDSCAPE: GLP-1 DRUGS
- 6.1. GLP-1 Drugs: Market Landscape
- 6.1.1. Analysis by Status of Development
- 6.1.2. Analysis by Type of Molecule
- 6.1.3. Analysis by Active Compound Used
- 6.1.4. Analysis by Type of Agonist
- 6.1.5. Analysis by Route of Administration
- 6.1.6. Analysis by Dosing Frequency
- 6.1.7. Analysis by Type of Therapy
- 6.1.8. Analysis by Target Indication
- 6.1.9. Analysis by Therapeutic Area
- 6.2. GLP-1 Drugs: Developer Landscape
- 6.2.1. Analysis by Year of Establishment
- 6.2.2. Analysis by Company Size
- 6.2.3. Analysis by Location of Headquarters
- 6.2.3. Analysis by Location of Headquarters (Country) and Status of Development
- 6.2.4. Most Active Developers: Analysis by Number of Therapies
7. GLP-1 DRUGS: DETAILED COMPANY PROFILES
- 7.1. Chapter Overview
- 7.2.1. AstraZeneca
- 7.1.1.1. Company Overview
- 7.1.1.2. Pipeline Portfolio
- 7.1.1.3. Financial Details
- 7.1.1.4. Recent Developments and Future Outlook
- 7.1.2. D&D Pharmatech
- 7.1.2.1. Company Overview
- 7.1.2.2. Pipeline Portfolio
- 7.1.2.3. Financial Details
- 7.1.2.4. Recent Developments and Future Outlook
- 7.1.3. Eli Lilly
- 7.1.3.1. Company Overview
- 7.1.3.2. Pipeline Portfolio
- 7.1.3.3. Financial Details
- 7.1.3.4. Recent Developments and Future Outlook
- 7.1.4. Novo Nordisk
- 7.1.4.1. Company Overview
- 7.1.4.2. Pipeline Portfolio
- 7.1.4.3. Financial Details
- 7.1.4.4. Recent Developments and Future Outlook
- 7.1.5. Pfizer
- 7.1.5.1. Company Overview
- 7.1.5.2. Pipeline Portfolio
- 7.1.5.3. Financial Details
- 7.1.5.4. Recent Developments and Future Outlook
- 7.1.6. Sanofi
- 7.1.6.1. Company Overview
- 7.1.6.2. Pipeline Portfolio
- 7.1.6.3. Financial Details
- 7.1.6.4. Recent Developments and Future Outlook
- 7.1.7. Tonghua Dongbao Pharmaceutical
- 7.1.7.1. Company Overview
- 7.1.7.2. Pipeline Portfolio
- 7.1.7.3. Financial Details
- 7.1.7.4. Recent Developments and Future Outlook
- 7.1.8. Vivani
- 7.1.8.1. Company Overview
- 7.1.8.2. Pipeline Portfolio
- 7.1.8.3. Financial Details
- 7.2.8.4. Recent Developments and Future Outlook
- 7.2.1. AstraZeneca
8. GLP-1 DRUGS: BRIEF COMPANY PROFILES
- 8.1. Chapter Overview
- 8.1.1. Biolingus
- 8.1.1.1. Company Overview
- 8.1.1.2. Pipeline Portfolio
- 8.1.2. Boehringer Ingelheim
- 8.1.2.1. Company Overview
- 8.1.2.2. Pipeline Portfolio
- 8.1.3. Gmax Biopharm
- 8.1.3.1. Company Overview
- 8.1.3.2. Pipeline Portfolio
- 8.1.4. Hanmi Pharmaceutical
- 8.1.4.1. Company Overview
- 8.1.4.2. Pipeline Portfolio
- 8.1.5. Innogen
- 8.1.5.1. Company Overview
- 8.1.5.2. Pipeline Portfolio
- 8.1.6. PegBio
- 8.1.6.1. Company Overview
- 8.1.6.2. Pipeline Portfolio
- 8.1.7. QL Biopharma
- 8.1.7.1. Company Overview
- 8.1.7.2. Pipeline Portfolio
- 8.1.8. Roche
- 8.1.8.1. Company Overview
- 8.1.8.2. Pipeline Portfolio
- 8.1.9. Sciwind Biosciences
- 8.1.9.1. Company Overview
- 8.1.9.2. Pipeline Portfolio
- 8.1.10. Viking Therapeutics
- 8.1.10.1. Company Overview
- 8.1.10.2. Pipeline Portfolio
- 8.1.11. vTv Therapeutics
- 8.1.11.1. Company Overview
- 8.1.11.2. Pipeline Portfolio
- 8.1.1. Biolingus
9. PARTNERSHIPS AND COLLABORATIONS
- 9.1. Chapter Overview
- 9.2. Partnership Models
- 9.3. GLP-1 Market: Partnerships and Collaborations
- 9.3.1. Analysis by Year of Partnership
- 9.3.2. Analysis by Type of Partnership
- 9.3.3. Analysis by Focus Area
- 9.3.4. Analysis by Year and Type of Partnership
- 9.3.5. Most Active Players: Analysis by Number of Partnerships
- 9.3.7. Analysis by Geography
- 9.3.7.1. Intercontinental and Intracontinental Deals
- 9.3.7.2. Local and International Deals
10. MARKET IMPACT ANALYSIS: DRIVERS, RESTRAINTS, OPPORTUNITIES AND CHALLENGES
- 10.1. Chapter Overview
- 10.2. Market Drivers
- 10.3. Market Restraints
- 10.4. Market Opportunities
- 10.5. Market Challenges
- 10.6. Conclusion
11. GLOBAL GLP-1 MARKET
- 11.1. Assumptions and Methodology
- 11.2. Global GLP-1 Market, Historical Trends and Forecasted Estimates, till 2035
- 11.2.1. Scenario Analysis
- 11.2.1.1. Conservative Scenario
- 11.2.1.2. Optimistic Scenario
- 11.2.2. Key Market Segmentations
- 11.2.1. Scenario Analysis
12. GLP-1 MARKET, BY TYPE OF MOLECULE
- 12.1. Assumptions and Methodology
- 12.2. GLP-1 Market: Distribution by Type of Molecule, 2020, 2024 and 2035
- 12.2.1. GLP-1 Market for Biologics, till 2035
- 12.2.2. GLP-1 Market for Small Molecules, till 2035
- 12.3. Data Triangulation and Validation
13. GLP-1 MARKET, BY ACTIVE COMPOUND USED
- 13.1. Assumptions and Methodology
- 13.2. GLP-1 Market: Distribution by Active Compound Used, 2020, 2024 and 2035
- 13.2.1. GLP-1 Market for Dulaglutide, till 2035
- 13.2.2. GLP-1 Market for liraglutide, till 2035
- 13.2.3. GLP-1 Market for Orforglipron, till 2035
- 13.2.4. GLP-1 Market for Retatrutide, till 2035
- 13.2.5. GLP-1 Market for Semaglutide, till 2035
- 13.2.6. GLP-1 Market for Survodutide, till 2035
- 13.2.7. GLP-1 Market for Tirzepatide, till 2035
- 13.2.8. GLP-1 Market for Other Active Compounds, till 2035
- 13.3 Data Triangulation and Validation
14. GLP-1 MARKET, BY TYPE OF GLP-1 AGONIST DRUGS
- 14.1. Assumptions and Methodology
- 14.2. GLP-1 Market: Distribution by Type Of GLP-1 Agonist Drugs, 2020, 2024 and 2035
- 14.2.1. GLP-1 Market for Long-acting GLP-1 Agonist, till 2035
- 14.2.2. GLP-1 Market for Short-acting GLP-1 Agonist, till 2035
- 14.3. Data Triangulation and Validation
15. GLP-1 MARKET, BY GLP-1 AGONIST
- 15.1. Assumptions and Methodology
- 15.2. GLP-1 Market: Distribution by GLP-1 Agonist, 2020, 2024 and 2035
- 15.2.1. GLP-1 Market for Single-agonist, till 2035
- 15.2.2. GLP-1 Market for Dual-agonist, till 2035
- 15.2.3. GLP-1 Market for Tri-agonist, till 2035
- 15.3. Data Triangulation and Validation
16. GLP-1 MARKET, BY ROUTE OF ADMINISTRATION
- 16.1. Assumptions and Methodology
- 16.2. GLP-1 Market: Distribution by Route of Administration, 2020, 2024 and 2035
- 16.2.1. GLP-1 Market for Oral Route, till 2035
- 16.2.2. GLP-1 Market for Parenteral Route, till 2035
- 16.3. Data Triangulation and Validation
17. GLP-1 MARKET, BY TARGET INDICATION
- 17.1. Assumptions and Methodology
- 17.2. GLP-1 Market: Distribution by Target Indication, 2020, 2024 and 2035
- 17.2.1. GLP-1 Market for Alzheimer's Disease, till 2035
- 17.2.2. GLP-1 Market for Non-Alcoholic Steatohepatitis, till 2035
- 17.2.3. GLP-1 Market for Obesity, till 2035
- 17.2.4. GLP-1 Market for Sleep Apnea, till 2035
- 17.2.5. GLP-1 Market for Type 2 Diabetes, till 2035
- 17.3. Data Triangulation and Validation
18. GLP-1 MARKET, BY GEOGRAPHY
- 18.1. Assumptions and Methodology
- 18.2. GLP-1 Market: Distribution by Geography, 2020, 2024 and 2035
- 18.2.1. GLP-1 Market in North America, till 2035
- 18.2.2. GLP-1 Market in Europe, till 2035
- 18.2.3. GLP-1 Market in Asia-Pacific, till 2035
- 18.2.4. GLP-1 Market in Latin America, till 2035
- 18.3. Data Triangulation and Validation
19. GLP-1 MARKET, SALES FORECAST OF GLP-1 DRUGS
- 19.1. Chapter Overview
- 19.2. Approved GLP-1 Drugs: Sales Forecast
- 19.2.1. Feisumei (Benaglutide) Sales Forecast
- 19.2.2. Fu Laimei (Polyethylene Glycol Loxenatide) Sales Forecast
- 19.2.3. Mounjaro (Tirzepatide) Sales Forecast
- 19.2.4. Ozempic (Semaglutide Subcutaneous) Sales Forecast
- 19.2.5. Rybelsus (Semaglutide Oral) Sales Forecast
- 19.2.6. Saxenda (Liraglutide) Sales Forecast
- 19.2.7. Trulicity (Dulaglutide) Sales Forecast
- 19.2.8. Victoza (Liraglutide) Sales Forecast
- 19.2.9. Wegovy (Semaglutide Subcutaneous) Sales Forecast
- 19.2.10. XULTOPHY (Insulin Degludec / Liraglutide) Sales Forecast
- 19.2.11. Zepbound (Tirzepatide) Sales Forecast
- 19.3. Phase III GLP-1 Drugs: Sales Forecast
- 19.3.1. GMA102 / Glutazumab Sales Forecast
- 19.3.2. JY09 Sales Forecast
- 19.3.3. LY3298176 / Tirzepatide Sales Forecast
- 19.3.4. Mazdutide / LY3305677/ IBI-362 Sales Forecast
- 19.3.5. Orforglipron / LY3502970 Sales Forecast
- 19.3.6. PB-119 / PEG-exenatide / Polyethylene glycol exenatide Sales Forecast
- 19.3.7. Retatrutide / LY3437943 Sales Forecast
- 19.3.8. Semaglutide Oral Sales Forecast
- 19.3.9. Semaglutide Subcutaneous Sales Forecast
- 19.3.10. Survodutide / BI 456906 Sales Forecast
- 19.3.11. XW003 / Ecnoglutide Sales Forecast
- 19.3.12. YN011-isupaglutide Sales Forecast
20. GLP-1 MARKET, BY LEADING DRUG DEVELOPERS
- 20.1. Chapter Overview
- 20.2. GLP-1 Market: Distribution by Leading Drug Developers, 2020 (USD Million)
- 20.3. GLP-1 Market: Distribution by Leading Drug Developers, 2024 (USD Million)
- 20.4. GLP-1 Market: Distribution by Leading Drug Developers, 2035 (USD Million)
21. APPENDIX 1: TABULATED DATA
22. APPENDIX 2: LIST OF COMPANIES AND ORGANIZATIONS
List of Tables
- Table 6.1 List of GLP-1 Drugs
- Table 6.2 List of GLP-1 Drug Developers
- Table 7.1 AstraZeneca: Pipeline Portfolio
- Table 7.2 AstraZeneca: Recent Developments and Future Outlook
- Table 7.3 D&D Pharmatech: Pipeline Portfolio
- Table 7.4 D&D Pharmatech: Recent Developments and Future Outlook
- Table 7.5 Eli Lilly: Pipeline Portfolio
- Table 7.6 Eli Lilly: Recent Developments and Future Outlook
- Table 7.7 Novo Nordisk: Pipeline Portfolio
- Table 7.8 Novo Nordisk: Recent Developments and Future Outlook
- Table 7.9 Pfizer: Pipeline Portfolio
- Table 7.1 Pfizer: Recent Developments and Future Outlook
- Table 7.11 Sanofi: Pipeline Portfolio
- Table 7.12 Sanofi: Recent Developments and Future Outlook
- Table 7.13 Tonghua Dongbao Pharmaceutical: Pipeline Portfolio
- Table 7.14 Tonghua Dongbao Pharmaceutical: Recent Developments and Future Outlook
- Table 7.15 Vivani: Pipeline Portfolio
- Table 7.16 Vivani: Recent Developments and Future Outlook
- Table 8.1 Biolingus: Pipeline Portfolio
- Table 8.2 Boehringer Ingelheim: Pipeline Portfolio
- Table 8.3 Gmax Biopharm: Pipeline Portfolio
- Table 8.4 Hanmi Pharmaceutical: Pipeline Portfolio
- Table 8.5 PegBio: Pipeline Portfolio
- Table 8.6 QL Biopharma: Pipeline Portfolio
- Table 8.7 Roche: Pipeline Portfolio
- Table 8.8 Sciwind Biosciences: Pipeline Portfolio
- Table 8.9 Viking Therapeutics: Pipeline Portfolio
- Table 8.10 vTv Therapeutics: Pipeline Portfolio
- Table 9.1 GLP-1 Drug Market: List of Partnerships and Collaborations, Since 2020
- Table 11.1 List of GLP-1 Drugs Forecasted
- Table 21.1 GLP-1 Drugs: Distribution by Status of Development
- Table 21.2 GLP-1 Drugs: Distribution by Type of Molecule
- Table 21.3 GLP-1 Drugs: Distribution by Active Compound Used
- Table 21.4 GLP-1 Drugs: Distribution by Type of Agonist
- Table 21.5 GLP-1 Drugs: Distribution by Route of Administration
- Table 21.6 GLP-1 Drugs: Distribution by Dosing Frequency
- Table 21.7 GLP-1 Drugs: Distribution by Type of Therapy
- Table 21.8 GLP-1 Drugs: Distribution by Target Indication
- Table 21.9 GLP-1 Drugs: Therapeutic Area
- Table 21.10 GLP-1 Drugs Developer: Distribution by Year of Establishment
- Table 21.11 GLP-1 Drugs Developer: Distribution by Company Size
- Table 21.12 GLP-1 Drugs Developer: Distribution by Location of Headquarters
- Table 21.13 GLP-1 Drugs Developer: Distribution by Location of Headquarters (Country) and Status of Development
- Table 21.14 Most Active Developers: Distribution by Number of Drugs
- Table 21.15 AstraZeneca: Annual Revenues, FY 2021 Onwards (USD Billion)
- Table 21.16 D&D Pharmatech: Annual Revenues, FY 2021 Onwards (KRW Billion)
- Table 21.17 Eli Lilly: Annual Revenues, FY 2021 Onwards (USD Billion)
- Table 21.18 Novo Nordisk: Annual Revenues, FY 2021 Onwards (DKK Billion)
- Table 21.19 Pfizer: Annual Revenues, FY 2021 Onwards (USD Billion)
- Table 21.20 Sanofi: Annual Revenues, FY 2021 Onwards (EUR Billion)
- Table 21.21 Tonghua Dongbao Pharmaceutical: Annual Revenues, FY 2021 Onwards (RMB Billion)
- Table 21.22 Partnerships and Collaborations: Distribution by Year of Partnership
- Table 21.23 Partnerships and Collaborations: Distribution by Type of Partnership
- Table 21.24 Partnerships and Collaborations: Distribution by Focus Area
- Table 21.25 Partnerships and Collaborations: Distribution by Year of Partnership and Type of Partnership
- Table 21.26 Most Active Players: Distribution by Number of Partnerships
- Table 21.27 Partnerships and Collaborations: Distribution by Intracontinental and Intercontinental Deals
- Table 21.28 Partnerships and Collaborations: Distribution by Local and International Deals
- Table 21.29 Global GLP-1 Market, Historical Trends (since 2020) (USD Billion)
- Table 21.30 Global GLP-1 Market, Forecasted Estimates, till 2035, Conservative, Base and Optimistic Scenario, (USD Billion)
- Table 21.31 GLP-1 Market: Distribution by Type of Molecule
- Table 21.32 GLP-1 Market for Biologics, Forecasted Estimates, till 2035, Conservative, Base and Optimistic Scenario (USD Billion)
- Table 21.33 GLP-1 Market for Small Molecule, Forecasted Estimates, till 2035, Conservative, Base and Optimistic Scenario (USD Billion)
- Table 21.34 GLP-1 Market: Distribution by Active Compound Used
- Table 21.35 GLP-1 Market for Dulaglutide, Forecasted Estimates, till 2035, Conservative, Base and Optimistic Scenario (USD Billion)
- Table 21.36 GLP-1 Market for Liraglutide, Forecasted Estimates, till 2035, Conservative, Base and Optimistic Scenario (USD Billion)
- Table 21.37 GLP-1 Market for Orforglipron, Forecasted Estimates, till 2035, Conservative, Base and Optimistic Scenario (USD Billion)
- Table 21.38 GLP-1 Market for Retatrutide, Forecasted Estimates, till 2035, Conservative, Base and Optimistic Scenario (USD Billion)
- Table 21.39 GLP-1 Market for Semaglutide, Forecasted Estimates, till 2035, Conservative, Base and Optimistic Scenario (USD Billion)
- Table 21.40 GLP-1 Market for Survodutide, Forecasted Estimates, till 2035, Conservative, Base and Optimistic Scenario (USD Billion)
- Table 21.41 GLP-1 Market for Tirzepatide, Forecasted Estimates, till 2035, Conservative, Base and Optimistic Scenario (USD Billion)
- Table 21.42 GLP-1 Market for Other Active Compounds, Forecasted Estimates, till 2035, Conservative, Base and Optimistic Scenario (USD Billion)
- Table 21.43 GLP-1 Market: Distribution by Type of GLP-1 Agonist Drug
- Table 21.44 GLP-1 Market for Long-acting GLP-1 Agonist, Forecasted Estimates, till 2035, Conservative, Base and Optimistic Scenario (USD Billion)
- Table 21.45 GLP-1 Market for Short-acting GLP-1 Agonist, Forecasted Estimates, till 2035, Conservative, Base and Optimistic Scenario (USD Billion)
- Table 21.46 GLP-1 Market: Distribution by GLP-1 Agonist
- Table 21.47 GLP-1 Market for Single-agonist, Forecasted Estimates, till 2035, Conservative, Base and Optimistic Scenario (USD Billion)
- Table 21.48 GLP-1 Market for Dual-agonist, Forecasted Estimates, till 2035, Conservative, Base and Optimistic Scenario (USD Billion)
- Table 21.49 GLP-1 Market for Tri-agonist, Forecasted Estimates, till 2035, Conservative, Base and Optimistic Scenario (USD Billion)
- Table 21.50 GLP-1 Market: Distribution by Route of Administration
- Table 21.51 GLP-1 Market for Oral Route, Forecasted Estimates, till 2035, Conservative, Base and Optimistic Scenario (USD Billion)
- Table 21.52 GLP-1 Market for Parenteral Route, Forecasted Estimates, till 2035, Conservative, Base and Optimistic Scenario (USD Billion)
- Table 21.53 GLP-1 Market: Distribution by Target Indication
- Table 21.54 GLP-1 Market for Alzheimer's Disease, Forecasted Estimates, till 2035, Conservative, Base and Optimistic Scenario (USD Billion)
- Table 21.55 GLP-1 Market for Non-alcoholic Steatohepatitis, Forecasted Estimates, till 2035, Conservative, Base and Optimistic Scenario (USD Billion)
- Table 21.56 GLP-1 Market for Obesity, Forecasted Estimates, till 2035, Conservative, Base and Optimistic Scenario (USD Billion)
- Table 21.57 GLP-1 Market for Sleep Apnea, Forecasted Estimates, till 2035, Conservative, Base and Optimistic Scenario (USD Billion)
- Table 21.58 GLP-1 Market for Type 2 Diabetes, Forecasted Estimates, till 2035, Conservative, Base and Optimistic Scenario (USD Billion)
- Table 21.59 GLP-1 Market: Distribution by Geography
- Table 21.60 GLP-1 Market in North America, Forecasted Estimates, till 2035, Conservative, Base and Optimistic Scenario (USD Billion)
- Table 21.61 GLP-1 Market in US, Forecasted Estimates, till 2035, Conservative, Base and Optimistic Scenario (USD Billion)
- Table 21.62 GLP-1 Market in Canada, Forecasted Estimates, till 2035, Conservative, Base and Optimistic Scenario (USD Billion)
- Table 21.63 GLP-1 Market in Europe, Forecasted Estimates, till 2035, Conservative, Base and Optimistic Scenario (USD Billion)
- Table 21.64 GLP-1 Market in Germany, Forecasted Estimates, till 2035, Conservative, Base and Optimistic Scenario (USD Billion)
- Table 21.65 GLP-1 Market in UK, Forecasted Estimates, till 2035, Conservative, Base and Optimistic Scenario (USD Billion)
- Table 21.66 GLP-1 Market in France, Forecasted Estimates, till 2035, Conservative, Base and Optimistic Scenario (USD Billion)
- Table 21.67 GLP-1 Market in Italy, Forecasted Estimates, till 2035, Conservative, Base and Optimistic Scenario (USD Billion)
- Table 21.68 GLP-1 Market in Spain, Forecasted Estimates, till 2035, Conservative, Base and Optimistic Scenario (USD Billion)
- Table 21.69 GLP-1 Market in Asia Pacific, Forecasted Estimates, till 2035, Conservative, Base and Optimistic Scenario (USD Billion)
- Table 21.70 GLP-1 Market in China, Forecasted Estimates, till 2035, Conservative, Base and Optimistic Scenario (USD Billion)
- Table 21.71 GLP-1 Market in Japan, Forecasted Estimates, till 2035, Conservative, Base and Optimistic Scenario (USD Billion)
- Table 21.72 GLP-1 Market in Australia, Forecasted Estimates, till 2035, Conservative, Base and Optimistic Scenario (USD Billion)
- Table 21.73 GLP-1 Market in South Korea, Forecasted Estimates, till 2035, Conservative, Base and Optimistic Scenario (USD Billion)
- Table 21.74 GLP-1 Market in Latin America, Forecasted Estimates, till 2035, Conservative, Base and Optimistic Scenario (USD Billion)
- Table 21.75 GLP-1 Market in Brazil, Forecasted Estimates, till 2035, Conservative, Base and Optimistic Scenario (USD Billion)
- Table 21.76 GLP-1 Market in Argentina, Forecasted Estimates, till 2035, Conservative, Base and Optimistic Scenario (USD Billion)
- Table 21.77 Approved GLP-1 Drug, Feisumei (Benaglutide) Sales Forecast, till 2035, Conservative, Base and Optimistic Scenario (USD Billion)
- Table 21.78 Approved GLP-1 Drug, Fu Laimei (Polyethylene Glycol Loxenatide) Sales Forecast, till 2035, Conservative, Base and Optimistic Scenario (USD Billion)
- Table 21.79 Approved GLP-1 Drug, Mounjaro (Tirzepatide) Sales Forecast, till 2035, Conservative, Base and Optimistic Scenario (USD Billion)
- Table 21.80 Approved GLP-1 Drug, Ozempic (Semaglutide Subcutaneous) Sales Forecast, till 2035, Conservative, Base and Optimistic Scenario (USD Billion)
- Table 21.81 Approved GLP-1 Drug, Rybelsus (Semaglutide Oral) Sales Forecast, till 2035, Conservative, Base and Optimistic Scenario (USD Billion)
- Table 21.82 Approved GLP-1 Drug, Saxenda (Liraglutide) Sales Forecast, till 2035, Conservative, Base and Optimistic Scenario (USD Billion)
- Table 21.83 Approved GLP-1 Drug, Trulicity (Dulaglutide) Sales Forecast, till 2035, Conservative, Base and Optimistic Scenario (USD Billion)
- Table 21.84 Approved GLP-1 Drug, Victoza (Liraglutide) Sales Forecast, till 2035, Conservative, Base and Optimistic Scenario (USD Billion)
- Table 21.85 Approved GLP-1 Drug, Wegovy (Semaglutide Subcutaneous) Sales Forecast, till 2035, Conservative, Base and Optimistic Scenario (USD Billion)
- Table 21.86 Approved GLP-1 Drug, XULTOPHY (Insulin Degludec / Liraglutide) Sales Forecast, till 2035, Conservative, Base and Optimistic Scenario (USD Billion)
- Table 21.87 Approved GLP-1 Drug, Zepbound (Tirzepatide) Sales Forecast, till 2035, Conservative, Base and Optimistic Scenario (USD Billion)
- Table 21.88 Phase III GLP-1 Drug, GMA102 / Glutazumab Sales Forecast, till 2035, Conservative, Base and Optimistic Scenario (USD Billion)
- Table 21.89 Phase III GLP-1 Drug, JY09 Sales Forecast, till 2035, Conservative, Base and Optimistic Scenario (USD Billion)
- Table 21.90 Phase III GLP-1 Drug, LY3298176 / Tirzepatide Sales Forecast, till 2035, Conservative, Base and Optimistic Scenario (USD Billion)
- Table 21.91 Phase III GLP-1 Drug, Mazdutide / LY3305677/ IBI-362 Sales Forecast, till 2035, Conservative, Base and Optimistic Scenario (USD Billion)
- Table 21.92 Phase III GLP-1 Drug, Orforglipron / LY3502970 Sales Forecast, till 2035, Conservative, Base and Optimistic Scenario (USD Billion)
- Table 21.93 Phase III GLP-1 Drug, PB-119 / PEG-exenatide / Polyethylene glycol exenatide Sales Forecast, till 2035, Conservative, Base and Optimistic Scenario (USD Billion)
- Table 21.94 Phase III GLP-1 Drug, Retatrutide / LY3437943 Sales Forecast, till 2035, Conservative, Base and Optimistic Scenario (USD Billion)
- Table 21.95 Phase III GLP-1 Drug, Semaglutide Oral Sales Forecast, till 2035, Conservative, Base and Optimistic Scenario (USD Billion)
- Table 21.96 Phase III GLP-1 Drug, Semaglutide Subcutaneous Sales Forecast, till 2035, Conservative, Base and Optimistic Scenario (USD Billion)
- Table 21.97 Phase III GLP-1 Drug, Survodutide / BI 456906 Sales Forecast, till 2035, Conservative, Base and Optimistic Scenario (USD Billion)
- Table 21.98 Phase III GLP-1 Drug, XW003 / Ecnoglutide Sales Forecast, till 2035, Conservative, Base and Optimistic Scenario (USD Billion)
- Table 21.99 Phase III GLP-1 Drug, YN011-isupaglutide Sales Forecast, till 2035, Conservative, Base and Optimistic Scenario (USD Billion)
- Table 21.100 GLP-1 Market: Distribution by Leading Drug Developers (in terms of GLP-1 drug sales in 2020, Conservative, Base and Optimistic Scenario (USD Billion))
- Table 21.101 GLP-1 Market: Distribution by Leading Drug Developers (in terms of GLP-1 drug sales in the Current Year, Conservative, Base and Optimistic Scenario (USD Billion))
- Table 21.102 GLP-1 Market: Distribution by Leading Drug Developers (in terms of GLP-1 drug sales estimated in 2035, Conservative, Base and Optimistic Scenario (USD Billion))
List of Figures
- Figure 2.1 Research Methodology: Project Methodology
- Figure 2.2 Research Methodology: Forecast Methodology
- Figure 3.1 Lessons Learnt from Past Recessions
- Figure 4.1 Executive Summary: Market Landscape
- Figure 4.2 Executive Summary: Partnerships and Collaborations
- Figure 4.3 Executive Summary: Market Sizing and Opportunity Analysis
- Figure 5.1 Advantage of GLP-1 Drugs
- Figure 5.2 Challenges Associated with GLP-1 Drugs
- Figure 5.3 Mechanisms of Action of GLP-1 Drugs
- Figure 6.1 GLP-1 Drugs: Distribution by Status of Development
- Figure 6.2 GLP-1 Drugs: Distribution by Type of Molecule
- Figure 6.3 GLP-1 Drugs: Distribution by Active Compound Used
- Figure 6.4 GLP-1 Drugs: Distribution by Type of Agonist
- Figure 6.5 GLP-1 Drugs: Distribution by Route of Administration
- Figure 6.6 GLP-1 Drugs: Distribution by Dosing Frequency
- Figure 6.7 GLP-1 Drugs: Distribution by Type of Therapy
- Figure 6.8 GLP-1 Drugs: Distribution by Target Indication
- Figure 6.9 GLP-1 Drugs: Distribution by Therapeutic Area
- Figure 6.10 GLP-1 Drugs Developer: Distribution by Year of Establishment
- Figure 6.11 GLP-1 Drugs Developer: Distribution by Company Size
- Figure 6.12 GLP-1 Drugs Developer: Distribution by Location of Headquarters
- Figure 6.13 GLP-1 Drugs Developer: Distribution by Location of Headquarters (Country) and Status of Development
- Figure 6.14 Most Active Developers: Distribution by Number of Drugs
- Figure 7.1 AstraZeneca: Annual Revenues, FY 2021 Onwards (USD Billion)
- Figure 7.2 D&D Pharmatech: Annual Revenues, FY 2021 Onwards (Korean Won Billion)
- Figure 7.3 Eli Lilly: Annual Revenues, FY 2021 Onwards (USD Billion)
- Figure 7.4 Novo Nordisk: Annual Revenues, FY 2021 Onwards (DKK Billion)
- Figure 7.5 Pfizer: Annual Revenues, FY 2021 Onwards (USD Billion)
- Figure 7.6 Sanofi: Annual Revenues, FY 2021 Onwards (EUR Billion)
- Figure 7.7 Tonghua Dongbao Pharmaceutical: Annual Revenues, FY 2021 Onwards (RMB Billion)
- Figure 9.1 Partnerships and Collaborations: Distribution by Year of Partnership
- Figure 9.2 Partnerships and Collaborations: Distribution by Type of Partnership
- Figure 9.3 Partnerships and Collaborations: Distribution by Focus Area
- Figure 9.4 Partnerships and Collaborations: Distribution by Year of Partnership and Type of Partnership
- Figure 9.5 Most Active Players: Distribution by Number of Partnerships
- Figure 9.6 Partnerships and Collaborations: Distribution by Intracontinental and Intercontinental Deals
- Figure 9.7 Partnerships and Collaborations: Distribution by Local and International Deals
- Figure 10.1 GLP-1 Drugs: Market Drivers
- Figure 10.2 GLP-1 Drugs: Market Restraints
- Figure 10.3 GLP-1 Drugs: Market Opportunities
- Figure 10.4 GLP-1 Drugs: Market Challenges
- Figure 11.1 Global GLP-1 Market, Historical Trends and Forecasted Estimates, till 2035
- Figure 11.2 Global GLP-1 Market, Forecasted Estimates (till 2035): Conservative Scenario (USD Billion)
- Figure 11.3 Global GLP-1 Market, Forecasted Estimates (till 2035): Optimistic Scenario (USD Billion)
- Figure 12.1 GLP-1 Market: Distribution by Type of Molecule
- Figure 12.2 GLP-1 Market for Biologics, till 2035 (USD Billion)
- Figure 12.3 GLP-1 Market for Small Molecule, till 2035 (USD Billion)
- Figure 13.1 GLP-1 Market: Distribution by Active Compound Used
- Figure 13.2 GLP-1 Market for Dulaglutide, till 2035 (USD Billion)
- Figure 13.3 GLP-1 Market for Liraglutide, till 2035 (USD Billion)
- Figure 13.4 GLP-1 Market for Orforglipron, till 2035 (USD Billion)
- Figure 13.5 GLP-1 Market for Retatrutide, till 2035 (USD Billion)
- Figure 13.6 GLP-1 Market for Semaglutide, till 2035 (USD Billion)
- Figure 13.7 GLP-1 Market for Survodutide, till 2035 (USD Billion)
- Figure 13.8 GLP-1 Market for Tirzepatide, till 2035 (USD Billion)
- Figure 13.9 GLP-1 Market for Other Active Compounds, till 2035 (USD Billion)
- Figure 14.1 GLP-1 Market: Distribution by Type of GLP-1 Agonist Drug
- Figure 14.2 GLP-1 Market for Long-acting GLP-1 Agonist, till 2035 (USD Billion)
- Figure 14.3 GLP-1 Market for Short-acting GLP-1 Agonist, till 2035 (USD Billion)
- Figure 15.1 GLP-1 Market: Distribution by GLP-1 Agonist
- Figure 15.2 GLP-1 Market for Single-agonist, till 2035 (USD Billion)
- Figure 15.3 GLP-1 Market for Dual-agonist, till 2035 (USD Billion)
- Figure 15.4 GLP-1 Market for Tri-agonist, till 2035 (USD Billion)
- Figure 16.1 GLP-1 Market: Distribution by Route of Administration
- Figure 16.2 GLP-1 Market for Oral, till 2035 (USD Billion)
- Figure 16.3 GLP-1 Market for Parenteral, till 2035 (USD Billion)
- Figure 17.1 GLP-1 Market: Distribution by Target Indication
- Figure 17.2 GLP-1 Market for Alzheimer's Disease, till 2035 (USD Billion)
- Figure 17.3 GLP-1 Market for Non-alcoholic Steatohepatitis, till 2035 (USD Billion)
- Figure 17.4 GLP-1 Market for Obesity, till 2035 (USD Billion)
- Figure 17.5 GLP-1 Market for Sleep Apnea, till 2035 (USD Billion)
- Figure 17.6 GLP-1 Market for Type 2 Diabetes, till 2035 (USD Billion)
- Figure 18.1 GLP-1 Market: Distribution by Geography
- Figure 18.2 GLP-1 Market in North America, till 2035 (USD Billion)
- Figure 18.3 GLP-1 Market in Europe, till 2035 (USD Billion)
- Figure 18.4 GLP-1 Market in Asia Pacific, till 2035 (USD Billion)
- Figure 18.5 GLP-1 Market in Latin America, till 2035 (USD Billion)
- Figure 19.1 Approved GLP-1 Drug, Feisumei (Benaglutide) Sales Forecast, till 2035 (USD Billion)
- Figure 19.2 Approved GLP-1 Drug, Fu Laimei (Polyethylene Glycol Loxenatide) Sales Forecast, till 2035 (USD Billion)
- Figure 19.3 Approved GLP-1 Drug, Mounjaro (Tirzepatide) Sales Forecast, till 2035 (USD Billion)
- Figure 19.4 Approved GLP-1 Drug, Ozempic (Semaglutide Subcutaneous) Sales Forecast, till 2035 (USD Billion)
- Figure 19.5 Approved GLP-1 Drug, Rybelsus (Semaglutide Oral) Sales Forecast, till 2035 (USD Billion)
- Figure 19.6 Approved GLP-1 Drug, Saxenda (Liraglutide) Sales Forecast, till 2035 (USD Billion)
- Figure 19.7 Approved GLP-1 Drug, Trulicity (Dulaglutide) Sales Forecast, till 2035 (USD Billion)
- Figure 19.8 Approved GLP-1 Drug, Victoza (Liraglutide) Sales Forecast, till 2035 (USD Billion)
- Figure 19.9 Approved GLP-1 Drug, Wegovy (Semaglutide Subcutaneous) Sales Forecast, till 2035 (USD Billion)
- Figure 19.10 Approved GLP-1 Drug, XULTOPHY (Insulin Degludec / Liraglutide) Sales Forecast, till 2035 (USD Billion)
- Figure 19.11 Approved GLP-1 Drug, Zepbound (Tirzepatide) Sales Forecast, till 2035 (USD Billion)
- Figure 19.12 Phase III GLP-1 Drug, GMA102 / Glutazumab Sales Forecast, till 2035 (USD Billion)
- Figure 19.13 Phase III GLP-1 Drug, JY09 Sales Forecast, till 2035 (USD Billion)
- Figure 19.14 Phase III GLP-1 Drug, LY3298176 / Tirzepatide Sales Forecast, till 2035 (USD Billion)
- Figure 19.15 Phase III GLP-1 Drug, Mazdutide / LY3305677/ IBI-362 Sales Forecast, till 2035 (USD Billion)
- Figure 19.16 Phase III GLP-1 Drug, Orforglipron / LY3502970 Sales Forecast, till 2035 (USD Billion)
- Figure 19.17 Phase III GLP-1 Drug, PB-119 / PEG-exenatide / Polyethylene glycol exenatide Sales Forecast, till 2035 (USD Billion)
- Figure 19.18 Phase III GLP-1 Drug, Retatrutide / LY3437943 Sales Forecast, till 2035 (USD Billion)
- Figure 19.19 Phase III GLP-1 Drug, Semaglutide Oral Sales Forecast, till 2035 (USD Billion)
- Figure 19.20 Phase III GLP-1 Drug, Semaglutide Subcutaneous Sales Forecast, till 2035 (USD Billion)
- Figure 19.21 Phase III GLP-1 Drug, Survodutide / BI 456906 Sales Forecast, till 2035 (USD Billion)
- Figure 19.22 Phase III GLP-1 Drug, XW003 / Ecnoglutide Sales Forecast, till 2035 (USD Billion)
- Figure 19.23 Phase III GLP-1 Drug, YN011-isupaglutide Sales Forecast, till 2035 (USD Billion)
- Figure 20.1 GLP-1 Market: Distribution by Leading Drug Developers (in terms of GLP-1 drug sales in 2020 (USD Billion))
- Figure 20.2 GLP-1 Market: Distribution by Leading Drug Developers (in terms of GLP-1 drug sales in the Current Year (USD Billion))
- Figure 20.3 GLP-1 Market: Distribution by Leading Drug Developers (in terms of GLP-1 drug sales estimated in 2035 (USD Billion))

