
PUBLISHER: Roots Analysis | PRODUCT CODE: 1648558

PUBLISHER: Roots Analysis | PRODUCT CODE: 1648558
Digital Therapeutics Market by Type of Solution, Type of Therapy, Purpose of Solution, Type of Business Model, Target Therapeutic Area and Key Geographical Regions : Industry Trends and Global Forecasts, Till 2035
DIGITAL THERAPEUTICS MARKET: OVERVIEW
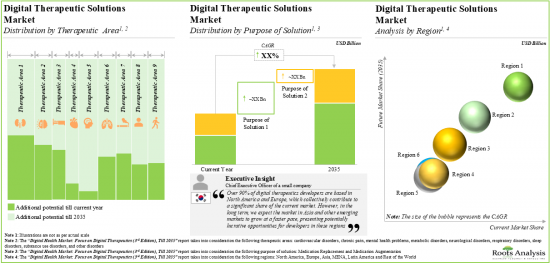
As per Roots Analysis, the global digital therapeutics market is estimated to grow from USD 2.83 billion in the current year to USD 19.76 billion by 2035, at a CAGR of 19.32% during the forecast period, till 2035.
The market sizing and opportunity analysis has been segmented across the following parameters:
Type of Solution
- Software Solution
- Gaming Solution
- Combination Solution
Type of Therapy
- Curative
- Preventive
Purpose of Solution
- Medication Replacement
- Medication Augmentation
Type of Business Model
- B2B
- B2C
Therapeutic Area
- Cardiovascular Disorders
- Chronic Pain
- Mental Health Problems
- Metabolic Disorders
- Neurological Disorders
- Respiratory Disorders
- Sleep Disorders
- Substance Use Disorders
- Other Disorders
Key Geographical Regions
- North America
- Europe
- Asia
- Latin America
- Middle East and North Africa
- Rest of the World
DIGITAL THERAPEUTICS MARKET: GROWTH AND TRENDS
Digital health is one of the most promising approaches to improving healthcare, at a global scale. In recent years, digital therapeutics have garnered significant interest from several stakeholders, especially for conditions that remain poorly addressed by pharmacological interventions, including chronic diseases and mental health issues. Moreover, given the ongoing efforts to promote the use of digital health solutions, along with the incorporation of patient centric features and advanced technologies, their adoption rates are anticipated to improve significantly in the long term. On the contrary, low digital literacy rates among patients and staff members are a major concern. With persistent advancements in digital health, hospitals have started taking initiatives to provide sessions to their staff members to spread awareness and implement such digital solutions.
Given the rising popularity of digital therapeutics and the emergence of several novel technologies, digital therapeutics companies are integrating advanced techniques to their respective portfolio to ensure higher adoptions. Driven by the growing awareness among patients and active efforts undertaken by the government, as well as industry stakeholders to meet the existing demand, the digital therapeutics market is expected to witness lucrative growth opportunities.
DIGITAL THERAPEUTICS MARKET: KEY INSIGHTS
The report delves into the current state of the digital therapeutics market and identifies potential growth opportunities within the industry. Some key findings from the report include:
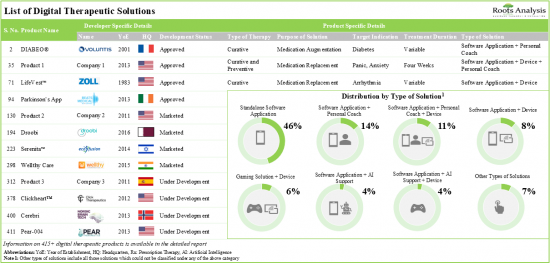
- At present, over 415 digital therapeutics are either commercially available or under development for various target indications; more than 45% of such solutions are offered as standalone software applications.
- Amongst these, 220 digital solutions are focused on women's health; around 30% of such solutions target reproductive health related applications.
- 150+ developers are engaged in the development / evaluation of digital therapeutic solutions, targeting different age groups and a wide range of disease indications.
- In pursuit of gaining a competitive edge, the digital therapeutic solution developers are focused on the integration of advanced features into their respective products and affiliated offerings.
- More than 1.6 million patients have been recruited / enrolled across 500+ clinical trials registered for this novel class of therapies; nearly 40% of such studies are still actively recruiting patients.
- To support the ongoing innovation in this field, several private and public investors have made substantial capital investments, amounting to over USD 8 billion, across ~370 instances.
- Owing to the growing interest and lucrative opportunity associated with this domain, industry stakeholders are actively forging partnerships; ~20% of the deals have been focused on the commercialization of proprietary solutions.
- In order to promote the adoption of their digital health solutions, developers are exploring various marketing strategies that highlight the key features of their products, across a number of platforms.
- Given the rising incidence of chronic clinical conditions and the recent surge in demand for remote and digital health solutions, the market for digital therapeutics is anticipated to grow at a CAGR of ~20%, till 2035.
DIGITAL THERAPEUTICS MARKET: KEY SEGMENTS
Currently, Software Solutions Occupy the Largest Share of the Digital Therapeutics Market
Based on the type of solution, the market is segmented into software solution, gaming solution and combination solution. At present, the software solution segment holds the maximum share of the digital therapeutics market. This trend is unlikely to change in the near future.
Curative Solutions are Likely to Dominate the Digital Therapeutics Market During the Forecast Period
Based on the type of therapy, the market is segmented into curative and preventive solutions. At present, curative solution holds the maximum share within the digital therapeutics market. This trend is likely to remain the same in the forthcoming years.
Medication Replacement Solutions Segment is Likely to Dominate the Digital Therapeutics Market During the Forecast Period
Based on the purpose of solution, the market is segmented into medication replacement solutions and medical augmentation solutions. At present, medication replacement solution holds a larger share of the digital therapeutics market. This trend is likely to remain the same in the coming decade. It is worth highlighting that medical augmentation solution is likely to grow at a relatively higher CAGR.
Currently, B2B Model Occupies the Largest Share of the Digital Therapeutics Market
Based on the business model, the market is segmented into B2B and B2C. It is worth highlighting that majority of the current digital therapeutics market is captured by the B2B model.
Metabolic Disorders Account for the Largest Share of the Digital Therapeutics Market
Based on the target therapeutic area, the market is segmented into cardiovascular disorders, chronic pain, mental health problems, metabolic disorders, neurological disorders respiratory disorders, sleep disorders, substance use disorders and other disorders. While metabolic disorders account for a relatively higher market share, it is worth highlighting that the neurological disorders segment is expected to witness substantial market growth in the coming years.
North America Accounts for the Largest Share of the Market
Based on key geographical regions, the market is segmented into North America, Europe, Asia, Middle East and North Africa, Latin America, and the Rest of the world. The majority share is expected to be captured by developers based in North America. It is worth highlighting that, over the years, the market in Asia is expected to grow at a higher CAGR.
Example Players in the Digital Therapeutics Market
- Ampersand Health
- Akili Interactives
- Better Therapeutics
- Brain+
- Click Therapeutics
- CogniFit
- GAIA
- Healios
- JOGO Health
- Jolly Good
- KORE Digital Health Therapeutics
- Livongo Health
- Lucid
- MedRhythms
- Pear Therapeutics
- Redicare Control
- Susmed
- The Learning Corp
- Voluntis
- WellDoc
Primary Research Overview
The opinions and insights presented in this study were influenced by discussions conducted with multiple stakeholders. The research report features detailed transcripts of interviews held with the following industry stakeholders:
- Chief of Staffs to CEO and Strategy Lead, Ampersand Health
- Ex-Chief Executive Officer, Canary Health
- Marketing Director, Dnurse Technology
- Chief Strategy Officer, EMBR Labs
- Founder and Chief Executive Officer, Exosystems
- Chief Executive Officer, Floreo
- Chief Commercial Officer, GAIA
- Chairman and Chief Executive Officer, Healios
- Co-Founder and President, Joggo Health
- Chief Executive Officer, metaMe Health
- Chief Executive Officer, SelfBack
- Ex-Chief Executive Officer, Somatix
- Chief Executive Officer, Tilak Healthcare
- Chief Executive Officer, Turnaround Health
- Co-Founder and Chief Executive Officer, Vida Health
- Ex-Communication Manager, Voluntis
- Ex-Vice President Marketing, Ex-Senior Manager Consumer Marketing, and Ex-Marketing and Public Relations, Wellthy Therapeutics
- Founder and Chief Executive Officer, Undisclosed
DIGITAL THERAPEUTICS MARKET: RESEARCH COVERAGE
- Market Sizing and Opportunity Analysis: The report features an in-depth analysis of the digital therapeutics market, focusing on key market segments, including [A] type of solution, [B] type of therapy, [C] purpose of solution, [D] type of business model, [E] target therapeutic area and [F] key geographical regions.
- Market Landscape: A comprehensive evaluation of digital therapeutics solutions, considering various parameters, such as [A] status of development, [B] type of solution, [C] type of therapy, [D] purpose of solution, [E] target indication(s), [F] therapeutic area and [G] target population. Additionally, it includes information related to digital therapeutics solution developers, highlighting their [H] year of establishment, [I] company size, [J] type of business model and [K] location of their headquarters.
- Product Competitiveness Analysis: A comprehensive competitive analysis of digital therapeutics solutions, examining factors, such as [A] product portfolio (based on the number of digital therapeutic solutions being developed for that therapeutic area) and [B] key product specific parameters (such as status of development, type of solution, type of therapy, prescription requirement and purpose of solution).
- Company Profiles: In-depth profiles of key industry players that are either offering or engaged in the development of digital therapeutics solutions, focusing on [A] company overviews, [B] product portfolio, [C] recent developments and [D] an informed future outlook.
- Clinical Trials Analysis: Examination of completed, ongoing, and planned clinical studies of various digital therapeutics, based on parameters like [A] trial registration year, [B] trial phase, [C] number of patients enrolled, [D] study design, [E] trial recruitment status and trial focus, [F] type of organization, [G] regional distribution of trials and [H] an insightful clinical end-points analysis (for top ten recent initiated trials for popular therapeutic areas).
- Funding and Investment Analysis: A detailed evaluation of the investments made in the digital therapeutics' market, encompassing grants, debt financing, seed funding, venture series, initial public offering, secondary offerings, private placements and other equity.
- Partnerships and Collaborations: An analysis of partnerships established in this sector, since 2016, covering marketing and distribution agreements, mergers / acquisitions, pilot product offerings, product / technology integration agreements, product / technology licensing agreements, product development agreements, product evaluation agreements, product training agreements, product development agreements, research and development agreements, and commercialization agreements.
- Go-To-Market Strategy: A detailed analysis of various business models and go-to-market strategies adopted by firms engaged in developing digital therapeutics solutions, highlighting details on various channels adopted by the stakeholders in order to raise awareness and offer access to their proprietary products.
- Bowman's Clock Pricing Strategy: A Bowman's clock pricing strategy framework evaluates the competitive position of various companies within this sector by examining their product prices and features. Additionally, it introduces an equation designed to estimate the potential price of digital therapeutics based on their attributes.
KEY QUESTIONS ANSWERED IN THIS REPORT
- How many companies are currently engaged in this market?
- Which are the leading companies in this market?
- What kind of partnership models are commonly adopted by industry stakeholders?
- What factors are likely to influence the evolution of this market?
- What is the current and future market size?
- What is the CAGR of this market?
- How is the current and future market opportunity likely to be distributed across key market segments?
REASONS TO BUY THIS REPORT
- The report provides a comprehensive market analysis, offering detailed revenue projections of the overall market and its specific sub-segments. This information is valuable to both established market leaders and emerging entrants.
- Stakeholders can leverage the report to gain a deeper understanding of the competitive dynamics within the market. By analyzing the competitive landscape, businesses can make informed decisions to optimize their market positioning and develop effective go-to-market strategies.
- The report offers stakeholders a comprehensive overview of the market, including key drivers, barriers, opportunities, and challenges. This information empowers stakeholders to stay abreast of market trends and make data-driven decisions to capitalize on growth prospects.
ADDITIONAL BENEFITS
- Complimentary PPT Insights Packs
- Complimentary Excel Data Packs for all Analytical Modules in the Report
- 10% Free Content Customization
- Detailed Report Walkthrough Session with Research Team
- Free Updated report if the report is 6-12 months old or older
TABLE OF CONTENTS
1. PREFACE
- 1.1. Introduction
- 1.2. Key Market Insights
- 1.3. Scope of the Report
- 1.4. Research Methodology
- 1.5. Frequently Asked Questions
- 1.6. Chapter Outlines
2. EXECUTIVE SUMMARY
3. INTRODUCTION
- 3.1 Chapter Overview
- 3.2. Digitization in the Healthcare Sector
- 3.3. Next-Generation Healthcare Solutions
- 3.4. Key Concepts Associated with Digital Health Solutions
- 3.4.1. Cognitive Behavioral Therapy (CBT)
- 3.4.2. Internet of Things (IoT)
- 3.4.3. Big Data
- 3.4.4. Artificial Intelligence (AI)
- 3.4.5. Gamification
- 3.5. Overview of Digital Therapeutics
- 3.5.1. Key Strategic Initiatives
- 3.5.1.1. Digital Therapeutics Alliance (DTA)
- 3.5.1.2. Personal Connected Health (PCH) Alliance
- 3.5.1.3. Programs Initiated by The Centers for Disease Control and Prevention (CDC)
- 3.5.1.4. Health Insurance Portability and Accountability Act (HIPAA)
- 3.5.1.5. National Health Service (NHS) Guidelines
- 3.5.1.6. United States Food and Drug Administration (USFDA) Regulations for Digital Therapeutics
- 3.5.2. Typical Development and Commercialization Path for Digital Therapeutics
- 3.5.2.1. Discovery and Preclinical Phase
- 3.5.2.2. Clinical Trials and Validation
- 3.5.2.3. Negotiation Involving Insurance Providers / Payers
- 3.5.2.4. Distribution and Marketing
- 3.5.1. Key Strategic Initiatives
- 3.6 Concluding Remarks
4. CURRENT MARKET LANDSCAPE
- 4.1. Chapter Overview
- 4.2. Digital Therapeutics: Overall Market Landscape
- 4.2.1. Analysis by Status of Development
- 4.2.2. Analysis by Type of Solution
- 4.2.3. Analysis by Type of Therapy
- 4.2.4. Analysis by Purpose of Solution
- 4.2.5. Analysis by Target Indication
- 4.2.6. Analysis by Therapeutic Area
- 4.2.7. Analysis by Target Population
- 4.3. Digital Therapeutics: Additional Information
- 4.3.1. Analysis by Requirement of Prescription
- 4.3.2. Analysis by Duration of Course
- 4.3.3. Analysis by Cost of Solution
- 4.4. Digital Therapeutics: List of Developers
- 4.4.1. Analysis by Year of Establishment
- 4.4.2. Analysis by Company Size
- 4.4.3. Analysis by Type of Business Model
- 4.4.4 Analysis by Location of Headquarters
- 4.5. Leading Developers: Analysis by Number of Digital Therapeutic Solutions
- 4.6. Leading Developers: Analysis by Portfolio Strength, Target Indication, and Company Size (4D Bubble Representation)
- 4.7. Analysis by Therapeutic Area and Company Size (Tree Map Representation)
- 4.8. Analysis of Regional Activity (World Map Representation)
5. PRODUCT COMPETITIVENESS ANALYSIS
- 5.1. Chapter Overview
- 5.2. Assumptions / Key Parameter
- 5.3. Methodology
- 5.4. Key Therapeutic Areas
- 5.4.1. Product Competitive Analysis: Digital Therapeutics Targeting Cardiovascular Disorders
- 5.4.2. Product Competitive Analysis: Digital Therapeutics Targeting Mental Health Problems
- 5.4.3. Product Competitive Analysis: Digital Therapeutics Targeting Metabolic Disorders
- 5.4.4. Product Competitive Analysis: Digital Therapeutics Targeting Neurological Disorders
- 5.4.5. Product Competitive Analysis: Digital Therapeutics Targeting Substance Use Disorders
- 5.4.6. Product Competitive Analysis: Digital Therapeutics Targeting Other Therapeutic Areas
6. COMPANY PROFILES
- 6.1. Chapter Overview
- 6.2. Akili Interactive
- 6.2.1 Company Overview
- 6.2.2. Product Portfolio
- 6.2.3. Recent Developments and Future Outlook
- 6.3. Big Health
- 6.3.1. Company Overview
- 6.3.2. Product Portfolio
- 6.3.3. Recent Developments and Future Outlook
- 6.4. dreem
- 6.4.1. Company Overview
- 6.4.2. Product Portfolio
- 6.4.3. Recent Developments and Future Outlook
- 6.5 Kaia Health
- 6.5.1. Company Overview
- 6.5.2. Product Portfolio
- 6.5.3. Recent Developments and Future Outlook
- 6.6. MindMaze
- 6.6.1. Company Overview
- 6.6.2. Product Portfolio
- 6.6.3. Recent Developments and Future Outlook
- 6.7. Omada Health
- 6.7.1. Company Overview
- 6.7.2. Product Portfolio
- 6.7.3. Recent Developments and Future Outlook
- 6.8. Pear Therapeutics
- 6.8.1. Company Overview
- 6.8.2. Product Portfolio
- 6.8.3 Recent Developments and Future Outlook
- 6.9. Vida Health
- 6.9.1. Company Overview
- 6.9.2. Product Portfolio
- 6.9.3. Recent Developments and Future Outlook
- 6.10. Voluntis
- 6.10.1. Company Overview
- 6.10.2. Product Portfolio
- 6.10.3. Recent Developments and Future Outlook
- 6.11. WellDoc
- 6.11.1. Company Overview
- 6.11.2. Product Portfolio
- 6.11.3. Recent Developments and Future Outlook
- 6.12. Wellthy Therapeutics
- 6.12.1. Company Overview
- 6.12.2. Product Portfolio
- 6.12.3. Recent Developments and Future Outlook
7. CLINICAL TRIAL ANALYSIS
- 7.1. Chapter Overview
- 7.2. Scope and Methodology
- 7.3. Digital Therapeutics: Clinical Trial Analysis
- 7.3.1. Analysis by Trial Registration Year
- 7.3.2. Analysis by Trial Status
- 7.3.3. Analysis by Trial Registration Year and Trial Status
- 7.3.4. Analysis by Trial Phase
- 7.3.5. Analysis by Type of Study
- 7.3.6. Analysis by Study Design
- 7.3.7. Analysis by Study Age
- 7.3.8. Analysis by Gender of Patients
- 7.3.9. Analysis of Patients Enrolled by Trial Registration Year
- 7.3.10. Analysis by Type of Sponsor
- 7.3.11. Analysis by Focus Area
- 7.3.12. Analysis by Geography
- 7.3.13. Analysis by Trial Registration Year, Recruitment Status and Geography
- 7.3.14. Analysis of Patients Enrolled by Geography
- 7.4. Clinical End-Points Analysis
8. FUNDING AND INVESTMENT ANALYSIS
- 8.1. Chapter Overview
- 8.2. Type of Funding Models
- 8.3. Digital therapeutics: List of Funding and Investments
- 8.3.1 Analysis of Number of Funding Instances by Year of Establishment and Type of Funding
- 8.3.2. Analysis of Funding Instances by Year
- 8.3.3. Analysis of Amount Invested by Year
- 8.3.4. Analysis by Type of Funding
- 8.3.5. Analysis of Instances and Amount Invested by Type of Therapy
- 8.3.6. Analysis by Therapeutic Area
- 8.3.7. Analysis by Geography
- 8.3.8. Most Active Players: Analysis by Number of Instances
- 8.3.9. Most Active Players: Analysis by Amount Raised
- 8.3.10. Most Active Investors: Analysis by Number of Instances
- 8.4. Concluding Remarks
9. PARTNERSHIPS AND COLLABORATIONS
- 9.1. Chapter Overview
- 9.2. Partnership Models
- 9.3. Digital Therapeutics: List of Partnerships and Collaborations
- 9.3.1. Analysis by Year of Partnership
- 9.3.2. Analysis by Type of Partnership
- 9.3.2.1. Analysis by Year of Partnership and Type of Partnership
- 9.3.2.2. Analysis by Type of Partnership and Company Size
- 9.3.3. Analysis by Type of Partner
- 9.3.3.1. Analysis by Year of Partnership and Type of Partner
- 9.3.3.2. Analysis by Type of Partnership and Type of Partner
- 9.3.3.3 Analysis by Type of Partner and Company Size
- 9.3.4. Analysis by Type of Therapy
- 9.3.4.1. Analysis by Type of Partnership and Type of Therapy
- 9.3.4.2. Analysis by Type of Partner and Type of Therapy
- 9.3.5. Analysis by Therapeutic Area
- 9.3.5.1. Analysis by Year of Partnership and Therapeutic Area
- 9.3.5.2 Analysis by Type of Partner and Therapeutic Area
- 9.3.6. Most Active Players: Analysis by Number of Partnerships
- 9.3.7. Analysis by Geography
- 9.3.8. Intercontinental and Intracontinental Agreements
10. GO-TO-MARKET STRATEGY
- 10.1. Chapter Overview
- 10.2. Marketing Strategies Adopted by Digital Therapeutic Developers
- 10.2.1. Participation in Global Events
- 10.2.2. Marketing on Social Media Platforms
- 10.2.3. Marketing on Online / Print Media Platforms
- 10.2.4. Undertaking Various Promotional Activities through Official Websites
- 10.2.5. Adoption of Different Business Models
- 10.2.5.1. B2C Business Model
- 10.2.5.2. B2B Business Model
- 10.2.5.2. B2B2C Business Model
- 10.2.6. Undertaking Various Promotional Activities through Product Add-ons
- 10.3. Concluding Remarks
11. BOWMAN CLOCK PRICING STRATEGY ANALYSIS
- 11.1. Chapter Overview
- 11.2. Bowman Strategy Clock
- 11.2.1. Two Dimensions of Bowman Strategy Clock
- 11.2.2. Eight Positions on Bowman Strategic Clock
- 11.3 Roots Analysis Framework
- 11.3.1. Methodology
- 11.3.2. Theoretical Framework and Price Evaluation Hypothesis
- 11.3.3. Results and Interpretation
- 11.3.3.1. Product Price Evaluation Matrix: Based on Status of Development
- 11.3.3.2. Product Price Evaluation Matrix: Based on Type of Solution
- 11.3.3.3. Product Price Evaluation Matrix: Based on Purpose of Solution
- 11.3.3.4. Product Price Evaluation Matrix: Based on Type of Therapy
- 11.3.3.5. Product Price Evaluation Matrix: Based on Therapeutic Area
- 11.3.3.6. Product Price Evaluation Matrix: Based on Prescription Requirement
- 11.3.3.7. Product Price Evaluation Matrix: Based on Duration of Course
- 11.3.3.8. Product Price Evaluation Matrix: Based on Distribution Channel
- 11.4. Concluding Remarks
12. MARKET FORECAST
- 12.1. Chapter Overview
- 12.2. Forecast Methodology and Key Assumptions
- 12.3. Global Digital Therapeutics Market, till 2035
- 12.4. Digital Therapeutics Market: Analysis by Type of Solution, till 2035
- 12.4.1. Digital Therapeutics Market for Standalone Software Applications, till 2035
- 12.4.2. Digital Therapeutics Market for Combination Offerings focused on Software Application, Device and Personal Coach, till 2035
- 12.4.3. Digital Therapeutics Market for Combination Offerings focused on Software Application and Personal Coach, till 2035
- 12.4.4. Digital Therapeutics Market for Combination Offerings focused on Software Application and AI Support, till 2035
- 12.4.5. Digital Therapeutics Market for Combination Offerings focused on Software Application and Device), till 2035
- 12.4.6. Digital Therapeutics Market for Combination Offerings focused on Software Application, Device and AI Support), till 2035
- 12.4.7. Digital Therapeutics Market for Other Types of Solutions, till 2035
- 12.5. Digital Therapeutics Market: Analysis by Purpose of Solution, till 2035
- 12.5.1. Digital Therapeutics Market for Medication Replacement Solutions, till 2035
- 12.5.2. Digital Therapeutics Market for Medication Augmentation Solutions, till 2035
- 12.6. Digital Therapeutics Market: Analysis by Type of Therapy, till 2035
- 12.6.1 Digital Therapeutics Market for Curative Therapy, till 2035
- 12.6.2. Digital Therapeutics Market for Preventive Therapy, till 2035
- 12.7. Digital Therapeutics Market: Analysis by Business Model, till 2035
- 12.7.1. Digital Therapeutics Market for B2C Model, till 2035
- 12.7.2. Digital Therapeutics Market for B2B Model, till 2035
- 12.8. Digital Therapeutics Market: Analysis by Therapeutic Area, till 2035
- 12.8.1. Digital Therapeutics Market for Cardiovascular Disorders, till 2035
- 12.8.2. Digital Therapeutics Market for Chronic Pain, till 2035
- 12.8.3. Digital Therapeutics Market for Mental Health Problems, till 2035
- 12.8.4. Digital Therapeutics Market for Metabolic Disorders, till 2035
- 12.8.5. Digital Therapeutics Market for Neurological Disorders, till 2035
- 12.8.6. Digital Therapeutics Market for Respiratory Disorders, till 2035
- 12.8.7. Digital Therapeutics Market for Sleep Disorders, till 2035
- 12.8.8. Digital Therapeutics Market for Substance Use Disorders, till 2035
- 12.8.9. Digital Therapeutics Market for Other Disorders, till 2035
- 12.9. Digital Therapeutics Market: Analysis by Geography, till 2035
- 12.9.1. Digital Therapeutics Market in North America, till 2035
- 12.9.2. Digital Therapeutics Market in Europe, till 2035
- 12.9.3. Digital Therapeutics Market in Asia, till 2035
- 12.9.4. Digital Therapeutics Market in MENA, till 2035
- 12.9.5. Digital Therapeutics Market in Latin America, till 2035
- 12.9.6. Digital Therapeutics Market in Rest of the World, till 2035
- 12.10. Concluding Remarks
13. WOMEN DIGITAL HEALTH: AN EMERGING NEW CONCEPT
- 13.1. Introduction: Women Digital Health
- 13.2. Chapter Overview
- 13.3. Women's Digital Health: Product Pipeline
- 13.3.1. Analysis by Type of Solution
- 13.3.2. Analysis by Status of Development
- 13.3.3. Analysis by Product Ratings
- 13.3.4. Analysis by Application Area
- 13.3.5. Analysis of Products by Different Stages of Pregnancy
- 13.3.6. Analysis by Purpose of Solution
- 13.3.7. Analysis by Type of End-Users
- 13.3.8. Analysis by Type of Solution and Application Area
- 13.4. Women's Digital Health: Developer's Landscape
- 13.4.1. Analysis by Year of Establishment
- 13.4.2. Analysis by Company Size
- 13.4.3. Analysis by Location of Headquarters (Region-wise)
- 13.4.4. Analysis by Company Size and Region
- 13.4.5. Analysis by Location of Headquarters (Country-Wise)
- 13.4.6. Leading Players: Analysis by Number of Solutions
- 13.4.7. Regional Landscape: Analysis by Type of Solution
14. SWOT ANALYSIS
- 14.1. Chapter Overview
- 14.2. Comparison of SWOT Factors
- 14.2.1. Strengths
- 14.2.2. Weaknesses
- 14.2.3. Opportunities
- 14.2.4. Threats
- 14.2.5. Conclusion
15. EXECUTIVE INSIGHTS
- 15.1. Chapter Overview
- 15.2. Ampersand Health
- 15.2.1. Company Snapshot
- 15.2.2. Interview Transcript: Chief of Staffs to CEO and Strategy Lead
- 15.3. Canary Health
- 15.3.1. Company Snapshot
- 15.3.2. Interview Transcript: Ex-Chief Executive Officer
- 15.4. Dnurse Technology
- 15.4.1. Company Snapshot
- 15.4.2. Interview Transcript: Marketing Director
- 15.5. Embr Labs
- 15.5.1. Company Snapshot
- 15.5.2. Interview Transcript: Chief Strategy Officer
- 15.6. Exosystems
- 15.6.1. Company Snapshot
- 15.6.2. Interview Transcript: Founder and Chief Executive Officer
- 15.7. Floreo
- 15.7.1. Company Snapshot
- 15.7.2. Interview Transcript: Chief Executive Officer
- 15.8. GAIA
- 15.8.1. Company Snapshot
- 15.8.2. Interview Transcript: Chief Commercial Officer
- 15.9. Healios
- 15.9.1. Company Snapshot
- 15.9.2. Interview Transcript: Founder and Chief Executive Officer
- 15.10 JOGGO Health
- 15.10.1. Company Snapshot
- 15.10.2. Interview Transcript: Co-Founder and President
- 15.11. metaMe Health
- 15.11.1. Company Snapshot
- 15.11.2 Interview Transcript: Chief Executive Officer
- 15.12. SelfBack
- 15.12.1. Company Snapshot
- 15.12.2. Interview Transcript: Chief Executive Officer
- 15.13. Somatix
- 15.13.1. Company Snapshot
- 15.13.2. Interview Transcript: Ex-Chief Executive Officer
- 15.14. Tilak Healthcare
- 15.14.1. Company Snapshot
- 15.14.2. Interview Transcript: Chief Executive Officer
- 15.15. Turnaround Health
- 15.15.1. Company Snapshot
- 15.15.2. Interview Transcript: Chief Executive Officer
- 15.16. Vida Health
- 15.16.1. Company Snapshot
- 15.16.2. Interview Transcript: Co-Founder and Chief Executive Officer
- 15.17. Voluntis
- 15.17.1. Company Snapshot
- 15.17.2. Interview Transcript: Ex-Communication Manager
- 15.18. Wellthy Therapeutics
- 15.18.1. Company Snapshot
- 15.18.2. Interview Transcript: Ex-Vice President Marketing, Ex-Senior Manager Consumer Marketing, and Ex-Marketing and Public Relations
- 15.19. Undisclosed
- 15.19.1. Interview Transcript: Founder and Chief Executive Officer
16. CONCLUDING REMARKS
17. APPENDIX 1: TABULATED DATA
18. APPENDIX 2: LIST OF COMPANIES AND ORGANIZATIONS
List of Tables
- Table 4.1 Digital Therapeutics: Information on Status of Development and Launch Year
- Table 4.2 Digital Therapeutics: Information on Type of Solution
- Table 4.3 Digital Therapeutics: Information on Type of Therapy and Purpose of Solution
- Table 4.4 Digital Therapeutics: Information on Target Indication(s), Therapeutic Area and Target Population
- Table 4.5 Digital Therapeutic Solutions: Information on Prescription Requirement, Duration of Course and Cost of Solution
- Table 4.6 Digital Therapeutics: List of Developers
- Table 6.1 Digital Therapeutics: List of Companies Profiled
- Table 6.2 Akili Interactive: Company Snapshot
- Table 6.3 Akili Interactive: Digital Therapeutic Solutions Portfolio
- Table 6.4 Akili Interactive: Recent Developments and Future Outlook
- Table 6.5 Big Health: Company Snapshot
- Table 6.6 Big Health: Digital Therapeutic Solutions Portfolio
- Table 6.7 Big Health: Recent Developments and Future Outlook
- Table 6.8 dreem: Company Snapshot
- Table 6.9 dreem: Digital Therapeutic Solutions Portfolio
- Table 6.10 dreem: Recent Developments and Future Outlook
- Table 6.11 Kaia Health: Company Snapshot
- Table 6.12 Kaia Health: Digital Therapeutic Solutions Portfolio
- Table 6.13 Kaia Health: Recent Developments and Future Outlook
- Table 6.14 MindMaze: Company Snapshot
- Table 6.15 MindMaze: Digital Therapeutic Solutions Portfolio
- Table 6.16 MindMaze: Recent Developments and Future Outlook
- Table 6.17 Omada Health: Company Snapshot
- Table 6.18 Omada Health: Digital Therapeutic Solutions Portfolio
- Table 6.19 Omada Health: Recent Developments and Future Outlook
- Table 6.20 Pear Therapeutics: Company Snapshot
- Table 6.21 Pear Therapeutics: Digital Therapeutic Solutions Portfolio
- Table 6.22 Pear Therapeutics: Recent Developments and Future Outlook
- Table 6.23 Vida Health: Company Snapshot
- Table 6.24 Vida Health: Digital Therapeutic Solutions Portfolio
- Table 6.25 Vida Health: Recent Developments and Future Outlook
- Table 6.26 Voluntis: Company Snapshot
- Table 6.27 Voluntis: Digital Therapeutic Solutions Portfolio
- Table 6.28 Voluntis: Recent Developments and Future Outlook
- Table 6.29 WellDoc: Company Snapshot
- Table 6.30 WellDoc: Digital Therapeutic Solutions Portfolio
- Table 6.31 WellDoc: Recent Developments and Future Outlook
- Table 6.32 Wellthy Therapeutics: Company Snapshot
- Table 6.33 Wellthy Therapeutics: Digital Therapeutic Solutions Portfolio
- Table 6.34 Wellthy Therapeutics: Recent Developments and Future Outlook
- Table 8.1 Digital Therapeutics: Funding and Investments, Information on Year of Investment, Type of Funding, Amount Invested and Investor(s), since 2016
- Table 8.2 Digital Therapeutics: Funding and Investments, Information on Year of Establishment, Location of Headquarters of Recipients, Type of Therapy and Therapeutic Area
- Table 9.1 Digital Therapeutics: List of Collaborations
- Table 9.2 Digital Therapeutics: Partnerships and Collaborations, Information on Type of Agreement (Region-wise and Geography-wise)
- Table 10.1 Digital Therapeutics: Summary of Marketing Strategies
- Table 10.2 Go-to-Market Strategy: Product Specific Websites
- Table 11.1 Product Price Evaluation Matrix: Based on Status of Development
- Table 11.2 Product Price Evaluation Matrix: Based on Type of Solution
- Table 11.3 Product Price Evaluation Matrix: Based on Purpose of Solution
- Table 11.4 Product Price Evaluation Matrix: Based on Type of Therapy
- Table 11.5 Product Price Evaluation Matrix: Based on Therapeutic Area
- Table 11.6 Product Price Evaluation Matrix: Based on Prescription Requirement
- Table 11.7 Product Price Evaluation Matrix: Based on Duration of Course
- Table 11.8 Product Price Evaluation Matrix: Based on Distribution Channel
- Table 15.1 Company Snapshot: Ampersand Health
- Table 15.2 Company Snapshot: Canary Health
- Table 15.3 Company Snapshot: Dnurse Technology
- Table 15.4 Company Snapshot: Embr Labs
- Table 15.5 Company Snapshot: Exosystems
- Table 15.6 Company Snapshot: Floreo
- Table 15.7 Company Snapshot: GAIA
- Table 15.8 Company Snapshot: Healios
- Table 15.9 Company Snapshot: JOGGO Health
- Table 15.10 Company Snapshot: metaMe Health
- Table 15.11 Company Snapshot: SelfBack
- Table 15.12 Company Snapshot: Somatix
- Table 15.13 Company Snapshot: Tilak Healthcare
- Table 15.14 Company Snapshot: Turnaround Health
- Table 15.15 Company Snapshot: Vida Health
- Table 15.16 Company Snapshot: Voluntis
- Table 15.17 Company Snapshot: Wellthy Therapeutics
- Table 17.1 Digital Therapeutics: Distribution by Status of Development
- Table 17.2 Digital Therapeutics: Distribution by Type of Solution
- Table 17.3 Digital Therapeutics: Distribution by Type of Therapy
- Table 17.4 Digital Therapeutics: Distribution by Purpose of Solution
- Table 17.5 Digital Therapeutics: Distribution by Type of Therapy and Purpose of Solution
- Table 17.6 Digital Therapeutics: Distribution by Target Indication(s)
- Table 17.7 Digital Therapeutics: Distribution by Therapeutic Area
- Table 17.8 Digital Therapeutics: Distribution by Target Population
- Table 17.9 Digital Therapeutics: Distribution by Prescription Requirement
- Table 17.10 Digital Therapeutics: Distribution by Duration of Course
- Table 17.11 Digital Therapeutics: Distribution by Cost of Solution (USD)
- Table 17.12 Digital Therapeutics Developers: Distribution by Year of Establishment
- Table 17.13 Digital Therapeutics Developers: Distribution by Company Size
- Table 17.14 Digital Therapeutics Developers: Distribution by Business Model
- Table 17.15 Digital Therapeutics Developers: Distribution by Location of Headquarters
- Table 17.16 Leading Digital Therapeutics Developers: Distribution by Number of Digital Therapeutics Solutions
- Table 17.17 Leading Digital Therapeutics Developers: Distribution by Portfolio Strength, Therapeutic Area and Company Size (4-D Bubble Representation)
- Table 17.18 Digital Therapeutics: Distribution by Therapeutic Area and Company Size (Tree Map Representation)
- Table 17.19 Digital Therapeutics: Distribution by Regional Activity
- Table 17.20 Cardiovascular Disorders: Shift in Trends (since 2018)
- Table 17.21 Mental Health Problems: Shift in Trends (since 2018)
- Table 17.22 Metabolic Disorders: Shift in Trends (since 2018)
- Table 17.23 Neurological Disorders: Shift in Trends (since 2018)
- Table 17.24 Substance Use Disorders: Shift in Trends (since 2018)
- Table 17.25 Other Therapeutic Areas: Shift in Trends (since 2018)
- Table 17.26 Clinical Trial Analysis: Scope and Methodology
- Table 17.27 Clinical Trial Analysis: Cumulative Year-wise Trend of Trials by Trial Registration Year
- Table 17.28 Clinical Trial Analysis: Distribution by Trial Status
- Table 17.29 Clinical Trial Analysis: Distribution by Trial Registration Year and Trial Status
- Table 17.30 Clinical Trial Analysis: Distribution by Trial Phase
- Table 17.31 Clinical Trial Analysis: Distribution by Type of Study
- Table 17.32 Clinical Trial Analysis: Distribution by Study Design
- Table 17.33 Clinical Trial Analysis: Distribution by Study Age
- Table 17.34 Clinical Trial Analysis: Distribution by Gender of Patients
- Table 17.35 Clinical Trial Analysis: Distribution of Patient Enrolled by Trial Registration Year
- Table 17.36 Clinical Trial Analysis: Distribution by Type of Sponsor
- Table 17.37 Clinical Trial Analysis: Distribution by Focus Area
- Table 17.38 Clinical Trial Analysis: Distribution of Trials by Geography
- Table 17.39 Clinical Trial Analysis: Distribution by Trial Registration Year, Recruitment Status and Geography
- Table 17.40 Clinical Trial Analysis: Distribution of Patients Enrolled by Geography
- Table 17.41 Clinical End-Points Analysis
- Table 17.42 Clinical Trials Analysis: Key Clinical End-Points for Metabolic Disorders
- Table 17.43 Clinical Trial Analysis: Primary and Secondary Clinical End-Points for Metabolic Disorders
- Table 17.44 Funding and Investment Analysis: Distribution of Instances by Year of Establishment and Type of Funding
- Table 17.45 Funding and Investment Analysis: Cumulative Year-wise Distribution of Instances
- Table 17.46 Funding and Investment Analysis: Cumulative Year-wise Distribution of Amount Invested (USD Million)
- Table 17.47 Funding and Investment Analysis: Distribution of Instances by Type of Funding
- Table 17.48 Funding and Investment Analysis: Distribution of Instances by Year and Type of Funding, since 2016
- Table 17.49 Funding and Investment Analysis: Distribution of Amount Invested by Year and Type of Funding, 2016- 2022 (USD Million)
- Table 17.50 Funding and Investment Analysis: Summary of Amount Invested, since 2016
- Table 17.51 Funding and Investment Analysis: Distribution of Instances and Amount Invested by Type of Therapy (USD Million)
- Table 17.52 Funding and Investment Analysis: Distribution of Instances by Year and Type of Therapy, since 2016
- Table 17.53 Funding and Investment Analysis: Distribution of Amount Invested by Year and Type of Therapy (USD Million)
- Table 17.54 Funding and Investment Analysis: Distribution of Instances by Therapeutic Area
- Table 17.55 Funding and Investment Analysis: Distribution of Amount Invested by Therapeutic Area (USD Million)
- Table 17.56 Funding and Investment Analysis: Distribution of Instances by Geography
- Table 17.57 Funding and Investment Analysis: Distribution of Amount Invested by Geography (USD Million)
- Table 17.58 Most Active Players: Distribution by Number of Instances
- Table 17.59 Most Active Players: Distribution by Amount Raised (USD Million)
- Table 17.60 Most Active Investors: Distribution by Number of Instances
- Table 17.61 Partnerships and Collaborations: Cumulative Year-Wise Trend
- Table 17.62 Partnerships and Collaborations: Distribution by Type of Partnership
- Table 17.63 Partnerships and Collaborations: Year-Wise Trend by Type of Partnership
- Table 17.64 Partnerships and Collaborations: Distribution by Type of Partnership and Company Size
- Table 17.65 Partnerships and Collaborations: Distribution by Type of Partner
- Table 17.66 Partnerships and Collaborations: Year-Wise Trend by Type of Partner
- Table 17.67 Partnerships and Collaborations: Distribution by Type of Partnership and Type of Partner
- Table 17.68 Partnerships and Collaborations: Distribution by Type of Partner and Company Size
- Table 17.69 Partnerships and Collaborations: Distribution by Type of Therapy
- Table 17.70 Partnerships and Collaborations: Distribution by Type of Partnership and Type of Therapy
- Table 17.71 Partnerships and Collaborations: Distribution by Type of Partner and Type of Therapy
- Table 17.72 Partnerships and Collaborations: Distribution by Therapeutic Area
- Table 17.73 Partnerships and Collaborations: Year-Wise Trend by Therapeutic Area
- Table 17.74 Partnerships and Collaborations: Distribution by Type of Partner and Therapeutic Area
- Table 17.75 Most Active Players: Distribution by Number of Partnerships
- Table 17.76 Partnerships and Collaborations: Regional Distribution
- Table 17.77 Partnerships and Collaborations: Country-Wise Distribution
- Table 17.78 Partnerships and Collaborations: Intercontinental and Intracontinental Agreements
- Table 17.79 Go-to-Market Strategy: Commonly Used Social Media Platforms
- Table 17.80 Go-to-Market Strategy: Online / Print Media Platforms
- Table 17.81 Go-to-Market Strategy: Promotional Activities through Official Websites
- Table 17.82 Go-to-Market Strategy: Adoption of Different Business Model
- Table 17.83 Go-to-Market Strategy: Promotional Activities through Product Websites
- Table 17.84 Overall Digital Therapeutics Market, till 2035: Conservative, Base and Optimistic Scenarios (USD Million)
- Table 17.85 Digital Therapeutics Market: Distribution by Type of Solution, till 2035 (USD Million)
- Table 17.86 Digital Therapeutics Market for Standalone Software Applications, till 2035: Conservative, Base and Optimistic Scenarios (USD Million)
- Table 17.87 Digital Therapeutics Market for Combination Offerings of Software Application, Device and Personal Coach, till 2035: Conservative, Base and Optimistic Scenarios (USD Million)
- Table 17.88 Digital Therapeutics Market for Combination Offerings of Software Application and Personal Coach, till 2035: Conservative, Base and Optimistic Scenarios (USD Million)
- Table 17.89 Digital Therapeutics Market for Combination Offerings of Software Application and AI Support, till 2035: Conservative, Base and Optimistic Scenarios (USD Million)
- Table 17.90 Digital Therapeutics Market for Combination Offerings of Software Application and Device, till 2035: Conservative, Base and Optimistic Scenarios (USD Million)
- Table 17.91 Digital Therapeutics Market for Combination Offerings of Software Application, Device and AI Support, till 2035: Conservative, Base and Optimistic Scenarios (USD Million)
- Table 17.92 Digital Therapeutics Market for Other Type of Solutions, till 2035: Conservative, Base and Optimistic Scenarios (USD Million)
- Table 17.93 Digital Therapeutics Market: Distribution by Purpose of Solution, till 2035 (USD Million)
- Table 17.94 Digital Therapeutics Market for Medication Replacement Solutions, till 2035: Conservative, Base and Optimistic Scenarios (USD Million)
- Table 17.95 Digital Therapeutics Market for Medication Augmentation Solutions, till 2035: Conservative, Base and Optimistic Scenarios (USD Million)
- Table 17.96 Global Digital Therapeutics Market: Distribution by Type of Therapy, Current Year and 2035 (USD Million)
- Table 17.97 Digital Therapeutics Market for Curative Therapy, till 2035: Conservative, Base and Optimistic Scenarios (USD Million)
- Table 17.98 Digital Therapeutics Market for Preventive Therapy, till 2035: Conservative, Base and Optimistic Scenarios (USD Million)
- Table 17.99 Global Digital Therapeutics Market: Distribution by Business Model, till 2035 (USD Million)
- Table 17.100 Digital Therapeutics Market for B2C Model, till 2035: Conservative, Base and Optimistic Scenarios (USD Million)
- Table 17.101 Digital Therapeutics Market for B2B Model, till 2035: Conservative, Base and Optimistic Scenarios (USD Million)
- Table 17.102 Global Digital Therapeutics Market: Distribution by Therapeutic Area, till 2035 (USD Million)
- Table 17.103 Digital Therapeutics Market for Cardiovascular Disorders, till 2035: Conservative, Base and Optimistic Scenarios (USD Million)
- Table 17.104 Digital Therapeutics Market for Chronic Pain, till 2035: Conservative, Base and Optimistic Scenarios (USD Million)
- Table 17.105 Digital Therapeutics Market for Mental Health Problems, till 2035: Conservative, Base and Optimistic Scenarios (USD Million)
- Table 17.106 Digital Therapeutics Market for Metabolic Disorders, till 2035: Conservative, Base and Optimistic Scenarios (USD Million)
- Table 17.107 Digital Therapeutics Market for Neurological Disorders, till 2035: Conservative, Base and Optimistic Scenarios (USD Million)
- Table 17.108 Digital Therapeutics Market for Respiratory Disorders, till 2035: Conservative, Base and Optimistic Scenarios (USD Million)
- Table 17.109 Digital Therapeutics Market for Sleep Disorders, till 2035: Conservative, Base and Optimistic Scenarios (USD Million)
- Table 17.110 Digital Therapeutics Market for Substance Use Disorders, till 2035: Conservative, Base and Optimistic Scenarios (USD Million)
- Table 17.111 Digital Therapeutics Market for Other Disorders, till 2035: Conservative, Base and Optimistic Scenarios (USD Million)
- Table 17.112 Global Digital Therapeutics Market: Distribution by Geography, Current Year and 2035
- Table 17.113 Digital Therapeutics Market in North America, till 2035: Conservative, Base and Optimistic Scenarios (USD Million)
- Table 17.114 Digital Therapeutics Market in Europe, till 2035: Conservative, Base and Optimistic Scenarios (USD Million)
- Table 17.115 Digital Therapeutics Market in Asia, till 2035: Conservative, Base and Optimistic Scenarios (USD Million)
- Table 17.116 Digital Therapeutics Market in MENA, till 2035: Conservative, Base and Optimistic Scenarios (USD Million)
- Table 17.117 Digital Therapeutics Market in Latin America, till 2035: Conservative, Base and Optimistic Scenarios (USD Million)
- Table 17.118 Digital Therapeutics Market in Rest of the World, till 2035: Conservative, Base and Optimistic Scenarios (USD Million)
- Table 17.119 Women's Digital Health: Distribution by Type of Solution
- Table 17.120 Women's Digital Health: Distribution by Status of Development
- Table 17.121 Women's Digital Health: Distribution by Product Ratings
- Table 17.122 Women's Digital Health: Distribution by Application Area
- Table 17.123 Women's Digital Health: Distribution by Products Usage with respect to Pregnancy
- Table 17.124 Women's Digital Health: Distribution by Purpose of Solution
- Table 17.125 Women's Digital Health: Distribution by Type of End-Users
- Table 17.126 Women's Digital Health: Distribution by Type of Solution and Application Area
- Table 17.127 Women's Digital Health Developers: Distribution by Year of Establishment
- Table 17.128 Women's Digital Health Developers: Distribution by Company Size
- Table 17.129 Women's Digital Health Developers: Distribution by Location of Headquarters (Region-wise)
- Table 17.130 Women's Digital Health Developers: Distribution by Company Size and Region
- Table 17.131 Women's Digital Health Developers: Distribution by Location of Headquarters (Country-wise)
- Table 17.132 Leading Players: Distribution by Number of Solutions
- Table 17.133 Regional Landscape: Distribution by Type of Solution
List of Figures
- Figure 3.1 Digital Health: Major Causes for Chronic Diseases
- Figure 3.2 Historical Timeline of Digital Health: Analysis of Google Trends
- Figure 3.3 Internet of Things: General Framework
- Figure 3.4 Internet of Things: Applications in the Healthcare Sector
- Figure 3.5 Prescription Digital Therapeutics: Process Map
- Figure 3.6 Characteristics of a Digital Therapeutic Program: An Illustration
- Figure 4.1 Digital Therapeutics: Distribution by Status of Development
- Figure 4.2 Digital Therapeutics: Distribution by Type of Solution
- Figure 4.3 Digital Therapeutics: Distribution by Type of Therapy
- Figure 4.4 Digital Therapeutics: Distribution by Purpose of Solution
- Figure 4.5 Digital Therapeutics: Distribution by Type of Therapy and Purpose of Solution
- Figure 4.6 Digital Therapeutics: Distribution by Target Indication
- Figure 4.7 Digital Therapeutics: Distribution by Therapeutic Area
- Figure 4.8 Digital Therapeutics: Distribution by Target Population
- Figure 4.9 Digital Therapeutic Solutions: Distribution by Prescription Requirements
- Figure 4.10 Digital Therapeutic Solutions: Distribution by Duration of Course
- Figure 4.11 Digital Therapeutic Solutions: Distribution by Cost of Solutions (USD)
- Figure 4.12 Digital Therapeutic Developers: Distribution by Year of Establishment
- Figure 4.13 Digital Therapeutics Developers: Distribution by Company Size
- Figure 4.14 Digital Therapeutics Developers: Distribution by Business Model
- Figure 4.15 Digital Therapeutics Developers: Distribution by Location of Headquarters
- Figure 4.16 Leading Digital Therapeutics Developers: Distribution by Number of Digital Therapeutic Solutions
- Figure 4.17 Leading Digital Therapeutics Developers: Distribution by Portfolio Strength, Therapeutic Area and Company Size (4-D Bubble Representation)
- Figure 4.18 Digital Therapeutics: Distribution by Therapeutic Area and Company Size (Tree Map Representation)
- Figure 4.19 Digital Therapeutics: Distribution of Regional Activity (World Map Representation)
- Figure 5.1 Cardiovascular Disorders: Shift in Trends (since 2018)
- Figure 5.2 Product Competitiveness Analysis: Cardiovascular Disorders
- Figure 5.3 Mental Health Problems: Shift in Trends (since 2018)
- Figure 5.4 Product Competitiveness Analysis: Mental Health Problems
- Figure 5.5 Metabolic Disorders: Shift in Trends (since 2018)
- Figure 5.6 Product Competitiveness Analysis: Metabolic Disorders
- Figure 5.7 Neurological Disorders: Shift in Trends (since 2018)
- Figure 5.8 Product Competitiveness Analysis: Neurological Disorders
- Figure 5.9 Substance Use Disorders: Shift in Trends (since 2018)
- Figure 5.10 Product Competitiveness Analysis: Substance Use Disorders
- Figure 5.11 Other Therapeutic Areas: Shift in Trends (since 2018)
- Figure 5.12 Product Competitiveness Analysis: Other Therapeutic Areas
- Figure 6.1 Akili Interactive: Core Technologies and Benefits of Digital Products
- Figure 6.2 Big Health: Digital Therapeutics Products and Clinical Trial Outcomes
- Figure 6.3 WellDoc: Key Benefits of Diabetes Management Program
- Figure 6.4 Wellthy Therapeutics: Diabetes Program
- Figure 7.1 Key Methods to Validate Digital Therapeutic Solutions
- Figure 7.2 Clinical Trial Analysis: Scope and Methodology
- Figure 7.3 Clinical Trial Analysis: Cumulative Year-wise Trend of Trials by Trial Registration Year
- Figure 7.4 Clinical Trial Analysis: Distribution by Trial Status
- Figure 7.5 Clinical Trial Analysis: Distribution by Trial Registration Year and Trial Status
- Figure 7.6 Clinical Trial Analysis: Distribution by Trial Phase
- Figure 7.7 Clinical Trial Analysis: Distribution by Type of Study
- Figure 7.8 Clinical Trial Analysis: Distribution by Study Design
- Figure 7.9 Clinical Trial Analysis: Distribution by Study Age
- Figure 7.10 Clinical Trial Analysis: Distribution by Gender of Patients
- Figure 7.11 Clinical Trial Analysis: Distribution of Patient Enrolled by Trial Registration Year
- Figure 7.12 Clinical Trial Analysis: Distribution by Type of Sponsor
- Figure 7.13 Clinical Trial Analysis: Distribution by Focus Area
- Figure 7.14 Clinical Trial Analysis: Distribution of Trials by Geography
- Figure 7.15 Clinical Trial Analysis: Distribution by Trial Registration Year, Recruitment Status and Geography
- Figure 7.16 Clinical Trial Analysis: Distribution of Patients Enrolled by Geography
- Figure 7.17 Clinical End-Points Analysis
- Figure 7.18 Clinical Trials Analysis: Key Clinical End-Points for Metabolic Disorders
- Figure 7.19 Clinical Trial Analysis: Primary and Secondary Clinical End-Points for Metabolic Disorders
- Figure 8.1 Funding and Investment Analysis: Distribution of Instances by Year of Establishment and Type of Funding
- Figure 8.2 Funding and Investment Analysis: Cumulative Year-wise Distribution of Instances
- Figure 8.3 Funding and Investment Analysis: Cumulative Year-wise Distribution of Amount Invested (USD Million)
- Figure 8.4 Funding and Investment Analysis: Distribution of Instances by Type of Funding
- Figure 8.5 Funding and Investment Analysis: Distribution of Instances by Year and Type of Funding
- Figure 8.6 Funding and Investment Analysis: Distribution of Amount Invested by Year and Type of Funding (USD Million)
- Figure 8.7 Funding and Investment Analysis: Summary of Amount Invested
- Figure 8.9 Funding and Investment Analysis: Distribution of Instances and Amount Invested by Type of Therapy (USD Million)
- Figure 8.10 Funding and Investment Analysis: Distribution of Instances by Year and Type of Therapy
- Figure 8.11 Funding and Investment Analysis: Distribution of Amount Invested by Year and Type of Therapy (USD Million)
- Figure 8.12 Funding and Investment Analysis: Distribution of Instances by Therapeutic Area
- Figure 8.13 Funding and Investment Analysis: Distribution of Amount Invested by Therapeutic Area (USD Million)
- Figure 8.14 Funding and Investment Analysis: Distribution of Instances by Geography
- Figure 8.15 Funding and Investment Analysis: Distribution of Amount Invested by Geography (USD Million)
- Figure 8.16 Most Active Players: Distribution by Number of Instances
- Figure 8.17 Most Active Players: Distribution by Amount Raised (USD Million)
- Figure 8.18 Most Active Investors: Distribution by Number of Instances
- Figure 8.19 Funding and Investment Summary
- Figure 9.1 Partnerships and Collaborations: Cumulative Year-Wise Trend
- Figure 9.2 Partnerships and Collaborations: Distribution by Type of Partnership
- Figure 9.3 Partnerships and Collaborations: Year-Wise Trend by Type of Partnership
- Figure 9.4 Partnerships and Collaborations: Distribution by Type of Partnership and Company Size
- Figure 9.5 Partnerships and Collaborations: Distribution by Type of Partner
- Figure 9.6 Partnerships and Collaborations: Year-Wise Trend by Type of Partner
- Figure 9.7 Partnerships and Collaborations: Distribution by Type of Partnership and Type of Partner
- Figure 9.8 Partnerships and Collaborations: Distribution by Type of Partner and Company Size
- Figure 9.9 Partnerships and Collaborations: Distribution by Type of Therapy
- Figure 9.10 Partnerships and Collaborations: Distribution by Type of Partnership and Type of Therapy
- Figure 9.11 Partnerships and Collaborations: Distribution by Type of Partner and Type of Therapy
- Figure 9.12 Partnerships and Collaborations: Distribution by Therapeutic Area
- Figure 9.13 Partnerships and Collaborations: Year-Wise Trend by Therapeutic Area
- Figure 9.14 Partnerships and Collaborations: Distribution by Type of Partner and Therapeutic Area
- Figure 9.15 Most Active Players: Distribution by Number of Partnerships
- Figure 9.16 Partnerships and Collaborations: Regional Distribution
- Figure 9.17 Partnerships and Collaborations: Country-Wise Distribution
- Figure 9.18 Partnerships and Collaborations: Intercontinental and Intracontinental Agreements
- Figure 10.1 Go-to-Market Strategy: Commonly Used Social Media Platforms
- Figure 10.2 Go-to-Market Strategy: Online / Print Media Platforms
- Figure 10.3 Go-to-Market Strategy: Promotional Activities through Official Websites
- Figure 10.4 Go-to-Market Strategy: Adoption of Different Business Model
- Figure 10.5 Go-to-Market Strategy: Promotional Activities through Product Websites
- Figure 10.6 Go-to-Market Strategy: Key Marketing Strategies for New Entrants
- Figure 10.7 Go-to-Market Strategy: Industry Stakeholder Opinions
- Figure 11.1 Digital Therapeutics: Bowman Clock Pricing Strategy Matrix
- Figure 11.2 Digital Therapeutics: Bowman Clock Pricing Strategy Graphical Interpretation
- Figure 12.1 Overall Digital Therapeutics Market, till 2035 (USD Million)
- Figure 12.2 Digital Therapeutics Market: Distribution by Type of Solution, till 2035 (USD Million)
- Figure 12.3 Digital Therapeutics Market for Standalone Software Applications till 2035 (USD Million)
- Figure 12.4 Digital Therapeutics Market for Combination Offerings of Software Application, Device and Personal Coach, till 2035 (USD Million)
- Figure 12.5 Digital Therapeutics Market for Combination Offerings of Software Application and Personal Coach, till 2035 (USD Million)
- Figure 12.6 Digital Therapeutics Market for Combination Offerings of Software Application and AI Support, till 2035 (USD Million)
- Figure 12.7 Digital Therapeutics Market for Combination Offerings of Software Application and Device, till 2035 (USD Million)
- Figure 12.8 Digital Therapeutics Market for Combination Offerings of Software Application, Device and AI Support, till 2035 (USD Million)
- Figure 12.9 Digital Therapeutics Market for Other Types of Solutions, till 2035 (USD Million)
- Figure 12.10 Digital Therapeutics Market: Distribution by Purpose of Solution, till 2035
- Figure 12.11 Digital Therapeutics Market for Medication Replacement Solutions, till 2035 (USD Million)
- Figure 12.12 Digital Therapeutics Market for Medication Augmentation Solutions, till 2035 (USD Million)
- Figure 12.13 Digital Therapeutics Market: Distribution by Type of Therapy, till 2035 (USD Million)
- Figure 12.14 Digital Therapeutics Market for Curative Therapies, till 2035 (USD Million)
- Figure 12.15 Digital Therapeutics Market for Preventive Therapies, till 2035 (USD Million)
- Figure 12.16 Digital Therapeutics Market: Distribution by Business Model, till 2035 (USD Million)
- Figure 12.17 Digital Therapeutics Market for B2C Model, till 2035 (USD Million)
- Figure 12.18 Digital Therapeutics Market for B2B Model, till 2035 (USD Million)
- Figure 12.19 Digital Therapeutics Market: Distribution by Therapeutic Area, till 2035 (USD Million)
- Figure 12.20 Digital Therapeutics Market for Cardiovascular Disorders, till 2035 (USD Million)
- Figure 12.21 Digital Therapeutics Market for Chronic Pain, till 2035 (USD Million)
- Figure 12.22 Digital Therapeutics Market for Mental Health Problems, till 2035 (USD Million)
- Figure 12.23 Digital Therapeutics Market for Metabolic Disorders, till 2035 (USD Million)
- Figure 12.24 Digital Therapeutics Market for Neurological Disorders, till 2035 (USD Million)
- Figure 12.25 Digital Therapeutics Market for Respiratory Disorders, till 2035 (USD Million)
- Figure 12.26 Digital Therapeutics Market for Sleep Disorders till 2035 (USD Million)
- Figure 12.27 Digital Therapeutics Market for Substance Use Disorders, till 2035 (USD Million)
- Figure 12.28 Digital Therapeutics Market for Other Disorders, till 2035 (USD Million)
- Figure 12.29 Digital Therapeutics Market: Distribution by Geography, till 2035 (USD Million)
- Figure 12.30 Digital Therapeutics Market in North America, till 2035 (USD Million)
- Figure 12.31 Digital Therapeutics Market in Europe, till 2035 (USD Million)
- Figure 12.32 Digital Therapeutics Market in Asia, till 2035 (USD Million)
- Figure 12.33 Digital Therapeutics Market in MENA, till 2035 (USD Million
- Figure 12.34 Digital Therapeutics Market in Latin America, till 2035 (USD Million
- Figure 12.35 Digital Therapeutics Market in Rest of the World, till 2035 (USD Million)
- Figure 13.1 Women's Digital Health: Distribution by Type of Solution
- Figure 13.2 Women's Digital Health: Distribution by Status of Development
- Figure 13.3 Women's Digital Health: Distribution by Product Ratings
- Figure 13.4 Women's Digital Health: Distribution by Application Area
- Figure 13.5 Women's Digital Health: Distribution of Products used during Stages of Pregnancy
- Figure 13.6 Women's Digital Health: Distribution by Purpose of Solution
- Figure 13.7 Women's Digital Health: Distribution by Type of End-Users
- Figure 13.8 Women's Digital Health: Distribution by Type of Solution and Application Area
- Figure 13.9 Women's Digital Health Developers: Distribution by Year of Establishment
- Figure 13.10 Women's Digital Health Developers: Distribution by Company Size
- Figure 13.11 Women's Digital Health Developers: Distribution by Location of Headquarters (Region-wise)
- Figure 13.12 Women's Digital Health Developers: Distribution by Company Size and Region
- Figure 13.13 Women's Digital Health Developers: Distribution by Location of Headquarters (Country-wise)
- Figure 13.14 Leading Players: Distribution by Number of Solutions
- Figure 13.15 Regional Landscape: Distribution by Type of Solution
- Figure 14.1 Digital Therapeutics: Overview of SWOT Analysis
- Figure 14.2 Comparison of SWOT Factors: Harvey Ball Analysis

