
PUBLISHER: Roots Analysis | PRODUCT CODE: 1643958

PUBLISHER: Roots Analysis | PRODUCT CODE: 1643958
Probiotics Market: Industry Trends and Global Forecasts, Till 2035: Distribution by Type of Probiotic, Type of Food and Beverage Type of Probiotic Dietary Supplement, Type of Ingredient, End User, Distribution Channel, Geographical Regions, Key Players
PROBIOTICS MARKET:
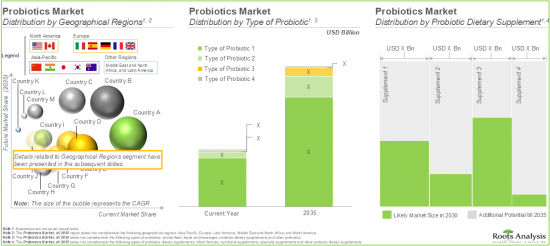
As per Roots Analysis, the global probiotics market size is estimated to grow from USD 70.9 million in the current year to USD 165.1 billion by 2035, at a CAGR of 8.0% during the forecast period, till 2035.
The opportunity for probiotics market has been distributed across the following segments:
- Type of Probiotic
- Foods and Beverages
- Animal Feed
- Probiotic Dietary Supplements
- Other Probiotics
- Hypermarkets / Supermarkets
- Pharmacies / Drug Stores
- Specialty Stores
- Online Stores
- Other Distribution Channels
- Type of Probiotic Dietary Supplement
- Nutritional Supplements
- Specialty Supplements
- Infant Formula
- Other Probiotic Dietary Supplements
- Type of Ingredient
- Bacteria
- Yeast
- End User
- Humans
- Animals
- Target Human Population
- Adults
- Children / Infants
- Distribution Channel
- Hypermarkets / Supermarkets
- Pharmacies / Drug Stores
- Specialty Stores
- Online Stores
Other Distribution Channels
- Geographical Regions
- North America
- Europe
- Asia-Pacific
- Middle East and North Africa
- Latin America
- Key Players
PROBIOTICS MARKET: GROWTH AND TRENDS
Probiotics are gut-friendly microbes (bacteria or yeast) that play a pivotal role in balancing the intestinal microflora in humans and animals. Some of the commonly found strains in the probiotics include Lactobacillus, Bifidobacterium, Bacillus, Saccharomyces and Streptococcus. Notably, probiotics are now widely recognized as mainstream wellness products amongst the health-conscious population. Such consumer products have known to enhance the overall health of an individual, through various mechanisms of action, such as competitive exclusion to eliminate pathogens, promote gut colonization, and strengthen the epithelial barrier.
Interestingly, owing to the increasing health awareness amongst consumers and preventive health benefits offered by probiotics, there has been a significant rise in the global demand for probiotic supplements post the COVID-19 pandemic. Moreover, the ongoing regulatory advancements related to specialty supplements encompassing probiotics have further driven this industry. Collectively these factors have propelled the companies involved in this domain to significantly invest in the development of novel probiotic strains. It is worth highlighting that, in 2023, French regulatory authorities granted permission to use the term probiotic on the labels of dietary supplements, given that these supplements offer a minimum of 107 to 109 live cells of the strain per day to the consumer. Further, online stores have made the entire purchasing process easy and significantly contributed to the improved accessibility of these products, thus providing consumers with a wide range of options.
Owing to the abovementioned benefits and the ongoing research and development (R&D) efforts aimed at creating more effective and novel probiotics, global probiotics market growth is expected to grow at a healthy CAGR during the forecast period.
PROBIOTICS MARKET: KEY INSIGHTS
The report delves into the current state of the probiotics market and identifies potential growth opportunities within the industry. The key takeaways of the report are:
1.Several key companies (established as well as start ups) in the probiotics domain offer various types of products, including probiotic foods, beverages, dietary supplements and infant formula
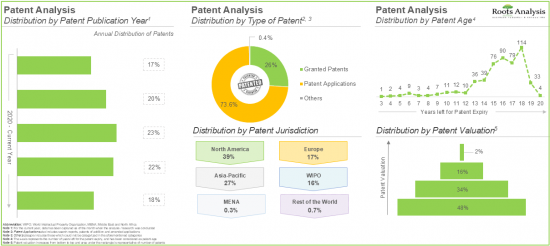
2.More than 500 patents related to probiotics have been filed / granted by the probiotic providers to protect the intellectual property generated within this field.
3.Owing to the numerous advantages offered by probiotics for the prevention and treatment of diseases, the market is anticipated to grow at an annualized rate of 8.0% in the coming decade
4.The projected market opportunity is likely to be well-distributed across different food and beverages, ingredients, end users and distribution channels
PROBIOTICS MARKET: KEY SEGMENTS
Foods and Beverages is the Fastest Growing Segment of the Probiotics Market
Based on the type of probiotic, the global market for probiotics is segmented into foods and beverages, probiotic dietary supplements, animal feed and other probiotics. Currently, the majority share of the probiotic market is captured by foods and beverages, owing to its higher consumer preference (as general foods), easy availability (without any prescription) and high nutritional value of functional foods. Further, the probiotic dietary supplement segment is likely to grow at a higher CAGR (around 8.9%) in the coming years.
Fermented Foods are Likely to Hold the Largest Share of the Probiotics Market During the Forecast Period
Based on the types of foods and beverages, the global market for probiotics is segmented into fermented foods, beverages, dry foods and other foods and beverages. Amongst these types, the fermented foods segment occupies the largest share of the current overall market and is expected to witness substantial growth during the forecast period.
Probiotics Market for Nutritional Supplements is Likely to Grow at a Relatively Faster Pace During the Forecast Period
Based on the types of probiotic dietary supplements, the global market for probiotics is segmented across nutritional supplements, specialty supplements, infant formula, and other probiotic dietary supplements. Notably, the nutritional supplements segment dominates the current market. This can be attributed to the increasing consumption of these probiotics amongst the consumers owing to their health benefits.
Probiotics Market for Bacteria is Likely to Grow at a Higher CAGR During the Forecast Period
Based on the types of ingredients, the global market is segmented into bacteria and yeast. The current market is dominated by the revenues generated from probiotic bacteria; this segment is expected to continue dominating the market, during the forecast period.
In terms of End user, Probiotics for Humans Hold the Largest Share of the Probiotics Market
Based on the end users, the global market is segmented across humans and animals. Presently, the probiotics intended for human consumption is anticipated to dominate the probiotics market and this trend is unlikely to change during the forecast period.
By Target Human Population, Probiotics for Adults are Likely to Dominate the Market During the Forecast Period
Based on the target human population, the global market for probiotics is segmented across adults, children / infants. Currently, probiotics for adults hold the maximum share in the overall market. It is worth highlighting that probiotic market for children / infants is likely to grow at a relatively higher CAGR.
Hypermarkets / Supermarkets Supporting the sale of Probiotics are Likely to Dominate the Probiotics Market During the Forecast Period
Based on the distribution channels, the global market for probiotics is distributed as hypermarkets / supermarkets, pharmacies / drug stores, specialty stores, online stores, and other distribution channels. It is worth highlighting that, currently, hypermarkets / supermarkets occupy majority of the market share. This can be attributed to the easy accessibility of diversified food probiotics and probiotic supplements through the abovementioned distribution / sales channel.
Asia-Pacific Accounts for the Largest Share of the Market
Based on key geographical regions, the market is segmented into North America, Europe, Asia-Pacific, Middle East and North Africa and Latin America. In the current scenario, Asia-Pacific is likely to capture the largest market share. This can be attributed to the high acceptance and consumption of probiotics foods, nutritional supplements and specialty supplements within this region (due to the heightened focus of the consumers towards preventative healthcare). However, Middle East and North Africa is expected to grow at a higher CAGR during the forecast period.
Example Players in the Probiotics Market
- AB-BIOTICS
- ADM
- Arla Foods
- BioGaia
- Danone
- General Mills
- i-Health
- IFF
- Kerry
- Lallemand
- Lifeway Foods
- Meiji
- Morinaga Milk
- Mother Dairy
- Nestle
- Novonesis (a merger of Novozymes and Chr Hansen)
- Probi
- Velbiom
- Winclove Probiotics
- Yakult Honsha
Primary Research Overview
The opinions and insights presented in this study were influenced by discussions conducted with multiple stakeholders in this domain. The market report features detailed transcripts of interviews conducted with the following individuals:
- Co-Founder and Chief Executive Officer, Small Company, Belgium
- Chief Executive Officer, Mid-sized Company, India
- Business Head, Small Company, India
PROBIOTICS MARKET: RESEARCH COVERAGE
The report on Probiotics Market features insights on various sections, including:
- Market Sizing and Opportunity Analysis: An in-depth analysis of the current market opportunity and the future growth potential of probiotics market, across several segments, including [A] type of probiotic, [B] type of food and beverage, [C] type of probiotic dietary supplement, [D] type of ingredient, [E] end user, [F] target human population, [G] distribution channel, [H] geographical regions.
- Market Impact Analysis: A thorough analysis of various factors, such as drivers, restraints, opportunities, and existing challenges that are likely to impact market growth.
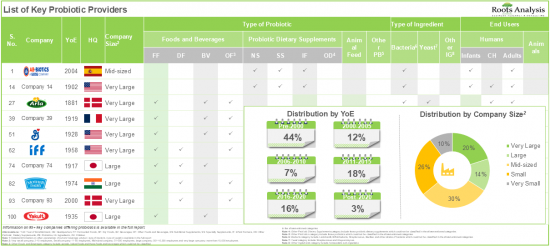
- Probiotics Market Landscape: A comprehensive evaluation of probiotics providers, based on several relevant parameters, such as [A] number of probiotics brands, [B] type of probiotic, [C] type of Ingredient, and [D] end user.
- Probiotics Developer Landscape: The report features a list of leading players engaged in the probiotics domain, along with analyses based on [A] year of establishment, [B] company size, [C] location of headquarters.
- Company Competitiveness Analysis: An insightful competitiveness analysis of the leading players in the probiotics domain, based on various relevant parameters, such as [A] company strength, [B] portfolio strength, and [C] benchmarking analysis.
- Company Profiles: In-depth profiles of key industry players offering probiotics across various geographies, focusing on [A] company overview, [B] probiotics portfolio, [C] financial information (if available), [D] recent developments, [E] future outlook statements.
- Patents Analysis: An in-depth analysis of patents filed / granted till date in the probiotics domain, based on various relevant parameters, such as [A] type of patent, [B] publication year, [C] patent jurisdiction, [E] CPC symbols, [F] patent age, [G] leading industry players, [H] patent benchmarking, and [I] patent valuation analysis.
- Value Chain Analysis: A detailed analysis of the value chain including various steps involved in the production of probiotics, along with the stakeholders involved at each step.
- Strategy Framework Analysis: A detailed outline of various approaches that help in devising strategies for the players engaged in this domain, including [A] business-related strategies, and [B] operation-related strategies.
- Porter Five Forces: A qualitative analysis, highlighting five most prevalent competitive forces in probiotics domain, including [A] threats of new entrants, [B] Bargaining power of buyers, [C] Bargaining power of probiotics providers, [D] threats of substitute products, and [E] rivalry among existing competitors.
KEY QUESTIONS ANSWERED IN THIS REPORT
- What is the patent filing activity trend in the market?
- How many companies are currently engaged in this market?
- Which are the leading companies in this market?
- What factors are likely to influence the evolution of this market?
- What is the current and future market size of this industry?
- What is the CAGR of this market?
- How is the current and future market opportunity likely to be distributed across key market segments?
REASONS TO BUY THIS REPORT
- The report provides a comprehensive market analysis, offering detailed revenue projections of the overall market and its specific sub-segments. This information is valuable to both established market leaders and emerging entrants.
- Stakeholders can leverage the report to gain a deeper understanding of the competitive dynamics within the market. By analyzing the competitive landscape, businesses can make informed decisions to optimize their market positioning and develop effective go-to-market strategies.
- The report offers stakeholders a comprehensive overview of the market, including key drivers, barriers, opportunities, and challenges. This information empowers stakeholders to stay abreast of market trends and make data-driven decisions to capitalize on growth prospects.
ADDITIONAL BENEFITS
- Complimentary PPT Insights Packs
- Complimentary Excel Data Packs for all Analytical Modules in the Report
- 10% Free Content Customization
- Detailed Report Walkthrough Session with Research Team
- Free updated report if the report is 6-12 months old or older
TABLE OF CONTENTS
1. BACKGROUND
- 1.1. Context
- 1.2. Project Objectives
2. RESEARCH METHODOLOGY
3. MARKET DYNAMICS
4. ECONOMIC AND OTHER PROJECT SPECIFIC CONSIDERATIONS
5. EXECUTIVE SUMMARY
6. INTRODUCTION
- 6.1. Overview of Probiotics
- 6.2. Types of Probiotics
- 6.2.1. Foods and Beverages
- 6.2.2. Probiotic Dietary Supplements
- 6.2.3. Animal Feed
- 6.3. Applications of Probiotics
- 6.4. Recent Developments in the Probiotics Domain
- 6.5. Future Perspectives
7. MARKET IMPACT ANALYSIS
- 7.1. Market Drivers
- 7.2. Market Restraints
- 7.3. Market Opportunities
- 7.4. Market Challenges
8. GLOBAL PROBIOTICS MARKET
- 8.1. Key Assumptions and Methodology
- 8.2. Global Probiotics Market: Historical Trends (since 2019) and Forecasted Estimates (till 2035)
- 8.2.1. Scenario Analysis
- 8.2.1.1. Conservative Scenario
- 8.2.1.2. Optimistic Scenario
- 8.2.1. Scenario Analysis
- 8.3. Key Market Segmentations
- 8.4. Roots Analysis Perspective on Market Growth
9. PROBIOTICS MARKET, BY TYPE OF PROBIOTIC
- 9.1. Key Assumptions and Methodology
- 9.2. Probiotics Market: Distribution by Type of Probiotic
- 9.2.1. Probiotics Market for Foods and Beverages: Historical Trends (since 2019) and Forecasted Estimates (till 2035)
- 9.2.2. Probiotics Market for Probiotic Dietary Supplements: Historical Trends (since 2019) and Forecasted Estimates (till 2035)
- 9.2.3. Probiotics Market for Animal Feed: Historical Trends (since 2019) and Forecasted Estimates (till 2035)
- 9.2.4. Probiotics Market for Other Probiotics: Historical Trends (since 2019) and Forecasted Estimates (till 2035)
10. PROBIOTICS MARKET, BY TYPE OF FOOD AND BEVERAGE
- 10.1. Key Assumptions and Methodology
- 10.2. Probiotics Market: Distribution by Type of Food and Beverage
- 10.2.1. Probiotics Market for Fermented Foods: Historical Trends (since 2019) and Forecasted Estimates (till 2035)
- 10.2.2. Probiotics Market for Beverages: Historical Trends (since 2019) and Forecasted Estimates (till 2035)
- 10.2.3. Probiotics Market for Dry Foods: Historical Trends (since 2019) and Forecasted Estimates (till 2035)
- 10.2.4. Probiotics Market for Other Foods and Beverages: Historical Trends (since 2019) and Forecasted Estimates (till 2035)
- 10.3. Probiotics Market: Distribution by Type of Food and Beverage Product
- 10.3.1. Probiotics Market for Dairy Products: Historical Trends (since 2019) and Forecasted Estimates (till 2035)
- 10.3.2. Probiotics Market for Non-Dairy Products: Historical Trends (since 2019) and Forecasted Estimates (till 2035)
11. PROBIOTICS MARKET, BY TYPE OF PROBIOTIC DIETARY SUPPLEMENT
- 11.1. Key Assumptions and Methodology
- 11.2. Probiotics Market: Distribution by Type of Probiotic Dietary Supplement
- 11.2.1. Probiotics Market for Nutritional Supplements: Historical Trends (since 2019) and Forecasted Estimates (till 2035)
- 11.2.2. Probiotics Market for Specialty Supplements: Historical Trends (since 2019) and Forecasted Estimates (till 2035)
- 11.2.3. Probiotics Market for Infant Formula: Historical Trends (since 2019) and Forecasted Estimates (till 2035)
- 11.2.4. Probiotics Market for Other Probiotic Dietary Supplements: Historical Trends (since 2019) and Forecasted Estimates (till 2035)
12. PROBIOTICS MARKET, BY TYPE OF INGREDIENT
- 12.1. Key Assumptions and Methodology
- 12.2. Probiotics Market: Distribution by Type of Ingredient
- 12.2.1. Probiotics Market for Bacteria: Historical Trends (since 2019) and Forecasted Estimates (till 2035)
- 12.2.2. Probiotics Market for Yeast: Historical Trends (since 2019) and Forecasted Estimates (till 2035)
13. PROBIOTICS MARKET, BY END USER
- 13.1. Key Assumptions and Methodology
- 13.2. Probiotics Market: Distribution by End User
- 13.2.1. Probiotics Market for Humans: Historical Trends (since 2019) and Forecasted Estimates (till 2035)
- 13.2.2. Probiotics Market for Animals: Historical Trends (since 2019) and Forecasted Estimates (till 2035)
14. PROBIOTICS MARKET, BY TARGET HUMAN POPULATION
- 14.1. Key Assumptions and Methodology
- 14.2. Probiotics Market: Distribution by Target Human Population
- 14.2.1. Probiotics Market for Adults: Historical Trends (since 2019) and Forecasted Estimates (till 2035)
- 14.2.2. Probiotics Market for Children / Infants: Historical Trends (since 2019) and Forecasted Estimates (till 2035)
15. PROBIOTICS MARKET, BY DISTRIBUTION CHANNEL
- 15.1. Key Assumptions and Methodology
- 15.2. Probiotics Market: Distribution by Distribution Channel
- 15.2.1. Probiotics Market for Hypermarkets / Supermarkets: Historical Trends (since 2019) and Forecasted Estimates (till 2035)
- 15.2.2. Probiotics Market for Pharmacies / Drug Stores: Historical Trends (since 2019) and Forecasted Estimates (till 2035)
- 15.2.3. Probiotics Market for Specialty Stores: Historical Trends (since 2019) and Forecasted Estimates (till 2035)
- 15.2.4. Probiotics Market for Online Stores: Historical Trends (since 2019) and Forecasted Estimates (till 2035)
- 15.2.5. Probiotics Market for Other Distribution Channels: Historical Trends (since 2019) and Forecasted Estimates (till 2035)
16. PROBIOTICS MARKET, BY GEOGRAPHICAL REGIONS
- 16.1. Key Assumptions and Methodology
- 16.2. Probiotics Market: Distribution by Geographical Regions
- 16.2.1. Probiotics Market in North America: Historical Trends (since 2019) and Forecasted Estimates (till 2035)
- 16.2.1.1. Probiotics Market in the US: Historical Trends (since 2019) and Forecasted Estimates (till 2035)
- 16.2.1.2. Probiotics Market in Canada: Historical Trends (since 2019) and Forecasted Estimates (till 2035)
- 16.2.2. Probiotics Market in Europe: Historical Trends (since 2019) and Forecasted Estimates (till 2035)
- 16.2.2.1. Probiotics Market in Italy: Historical Trends (since 2019) and Forecasted Estimates (till 2035)
- 16.2.2.2. Probiotics Market in France: Historical Trends (since 2019) and Forecasted Estimates (till 2035)
- 16.2.2.3. Probiotics Market in Germany: Historical Trends (since 2019) and Forecasted Estimates (till 2035)
- 16.2.2.4. Probiotics Market in Spain: Historical Trends (since 2019) and Forecasted Estimates (till 2035)
- 16.2.2.5. Probiotics Market in the UK: Historical Trends (since 2019) and Forecasted Estimates (till 2035)
- 16.2.2.6. Probiotics Market in Rest of Europe: Historical Trends (since 2019) and Forecasted Estimates (till 2035)
- 16.2.3. Probiotics Market in Asia-Pacific: Historical Trends (since 2019) and Forecasted Estimates (till 2035)
- 16.2.3.1. Probiotics Market in China: Historical Trends (since 2019) and Forecasted Estimates (till 2035)
- 16.2.3.2. Probiotics Market in India: Historical Trends (since 2019) and Forecasted Estimates (till 2035)
- 16.2.3.3. Probiotics Market in South Korea: Historical Trends (since 2019) and Forecasted Estimates (till 2035)
- 16.2.3.4. Probiotics Market in Japan: Historical Trends (since 2019) and Forecasted Estimates (till 2035)
- 16.2.3.5. Probiotics Market in Rest of Asia-Pacific: Historical Trends (since 2019) and Forecasted Estimates (till 2035)
- 16.2.4. Probiotics Market in Middle East and North Africa: Historical Trends (since 2019) and Forecasted Estimates (till 2035)
- 16.2.4.1. Probiotics Market in UAE: Historical Trends (since 2019) and Forecasted Estimates (till 2035)
- 16.2.4.2. Probiotics Market in Israel: Historical Trends (since 2019) and Forecasted Estimates (till 2035)
- 16.2.4.3. Probiotics Market in Saudi Arabia: Historical Trends (since 2019) and Forecasted Estimates (till 2035)
- 16.2.5. Probiotics Market in Latin America: Historical Trends (since 2019) and Forecasted Estimates (till 2035)
- 16.2.5.1. Probiotics Market in Brazil: Historical Trends (since 2019) and Forecasted Estimates (till 2035)
- 16.2.5.2. Probiotics Market in Mexico: Historical Trends (since 2019) and Forecasted Estimates (till 2035)
- 16.2.5.3. Probiotics Market in Rest of Latin America: Historical Trends (since 2019) and Forecasted Estimates (till 2035)
- 16.2.1. Probiotics Market in North America: Historical Trends (since 2019) and Forecasted Estimates (till 2035)
- 16.3. Market Movement Analysis
- 16.4. Penetration-Growth (P-G) Matrix
17. PROBIOTICS MARKET, BY KEY PLAYERS
18. MARKET LANDSCAPE: PROBIOTIC PROVIDERS
- 18.1. Chapter Overview
- 18.2. Leading Probiotic Providers: Market Landscape
- 18.2.1. Analysis by Number of Probiotic Brands
- 18.2.2. Analysis by Type of Probiotic
- 18.2.2.1. Analysis by Type of Probiotic Dietary Supplement
- 18.2.2.2. Analysis by Type of Food and Beverage
- 18.2.3. Analysis by Type of Ingredient
- 18.2.3.1. Analysis by Type of Bacteria
- 18.2.3.2. Analysis by Type of Yeast
- 18.2.4. Analysis by End User
- 18.2.4.1. Analysis by Type of Target Human Population
- 18.3. Probiotic Providers: Developer Landscape
- 18.3.1. Analysis by Year of Establishment
- 18.3.2. Analysis by Company Size
- 18.3.3. Analysis by Location of Headquarters
19. COMPANY COMPETITIVENESS ANALYSIS: LEADING PROBIOTIC PROVIDERS
- 19.1. Methodology and Key Parameters
- 19.2. Leading Probiotics Providers: Company Competitiveness Analysis
- 19.3. Leading Probiotics Providers: Benchmarking Analysis
20. COMPANY PROFILES: LEADING PROBIOTIC PROVIDERS HEADQUARTERED IN NORTH AMERICA
- 20.1. Chapter Overview
- 20.2. Leading Probiotic Providers Headquartered in North America
- 20.2.1. ADM
- 20.2.1.1. Company Overview
- 20.2.1.2. Probiotics Portfolio
- 20.2.1.3. Financial Details
- 20.2.1.4. Recent Developments and Future Outlook
- 20.2.2. IFF
- 20.2.3. Lallemand
- 20.2.1. ADM
- 20.3. Other Leading Probiotic Providers Headquartered in North America
- 20.3.1. General Mills
- 20.3.2. I-Health
- 20.3.3. Lifeway Foods
21. LEADING PROBIOTIC PROVIDERS HEADQUARTERED IN EUROPE
- 21.1. Chapter Overview
- 21.2. Leading Probiotic Providers Headquartered in Europe
- 21.2.1. Danone
- 21.2.1.1. Company Overview
- 21.2.1.2. Probiotics Portfolio
- 21.2.1.3. Financial Details
- 21.2.1.4. Recent Developments and Future Outlook
- 21.2.2. Nestle
- 21.2.3. Probi
- 21.2.1. Danone
- 21.3. Other Leading Probiotic Providers Headquartered in Europe
- 21.3.1. AB-BIOTICS
- 21.3.2. Arla Foods
- 21.3.3. Biogaia
- 21.3.4. Kerry
- 21.3.5. Novonesis
- 21.3.6. Winclove Probiotics
22. LEADING PROBIOTIC PROVIDERS HEADQUARTERED IN ASIA-PACIFIC
- 22.1. Chapter Overview
- 22.2. Leading Probiotic Providers Headquartered in Asia-Pacific
- 22.2.1. Morinaga Milk
- 22.2.1.1. Company Overview
- 22.2.1.2. Probiotics Portfolio
- 22.2.1.3. Financial Details
- 22.2.1.4. Recent Developments and Future Outlook
- 22.2.2. Velbiom
- 22.2.3. Yakult
- 22.2.1. Morinaga Milk
- 22.3. Other Leading Probiotic Providers Headquartered in Asia-Pacific
- 22.3.1. Meiji
- 22.3.2. Mother Dairy
23. PATENT ANALYSIS
- 23.1. Scope and Methodology
- 23.2. Key Parameters
- 23.3. Probiotics: Patent Analysis
- 23.3.1. Analysis by Patent Publication Year
- 23.3.2. Analysis by Type of Patent and Patent Publication Year
- 23.3.3. Analysis by Geography
- 23.3.4. Analysis by CPC Symbols
- 23.3.5. Leading Industry Players: Analysis by Number of Patents
- 23.4. Patent Benchmarking Analysis
- 23.4.1. Analysis by Patent Characteristics
- 23.5. Patent Valuation Analysis
24. VALUE CHAIN ANALYSIS: PROBIOTICS MARKET
- 24.1. Overview of Probiotics Manufacturing Process and Stakeholders Involved
- 24.2. Schematic Representation of Probiotics from Formulation to Large Scale Production
25. STRATEGY FRAMEWORK ANALYSIS
- 25.1. Chapter Overview
- 25.2. Fundamental Strategies to Achieve a Sustainable Competitive Edge
- 25.2.1. Key Business-related Strategies
- 25.2.2. Key Operations-related Strategies
- 25.3. Concluding Remarks
26. PORTER'S FIVE FORCES ANALYSIS
- 26.1. Methodology and Assumptions
- 26.2. Key Parameters
- 26.2.1. Threat of New Entrants
- 26.2.2. Bargaining Power of Buyers
- 26.2.3. Bargaining Power of Suppliers
- 26.2.4. Threat of Substitute Products
- 26.2.5. Rivalry Among Existing Competitors
- 26.3. Porter's Five Force Analysis: Harvey Ball Analysis
- 26.4. Concluding Remarks
27. EXECUTIVE INSIGHTS
28. APPENDIX 1: TABULATED DATA
29. APPENDIX 2: LIST OF COMPANIES AND ORGANIZATIONS
List of Tables
- Table 18.1 Leading Probiotic Providers: Market Landscape
- Table 18.2 Probiotic Providers: Developer Landscape
- Table 20.1 ADM: Probiotics Portfolio
- Table 20.2 IFF: Probiotics Portfolio
- Table 20.3 Lallemand: Probiotics Portfolio
- Table 21.1 Danone: Probiotics Portfolio
- Table 21.2 Nestle: Probiotics Portfolio
- Table 21.3 Probi: Probiotics Portfolio
- Table 22.1 Morinaga Milk: Probiotics Portfolio
- Table 22.2 Velbiom: Probiotics Portfolio
- Table 22.3 Yakult Honsha: Probiotics Portfolio
- Table 28.1 Global Probiotics Market: Historical Trends (since 2019) and Forecasted Estimates (till 2035) (USD Billion)
- Table 28.2 Global Probiotics Market: Forecasted Estimates (till 2035): Conservative Scenario (USD Billion)
- Table 28.3 Global Probiotics Market: Forecasted Estimates (till 2035): Optimistic Scenario (USD Billion)
- Table 28.4 Probiotics Market: Distribution by Type of Probiotic
- Table 28.5 Probiotics Market for Foods and Beverages: Historical Trends (since 2019) and Forecasted Estimates (till 2035) (USD Billion)
- Table 28.6 Probiotics Market for Probiotic Dietary Supplements: Historical Trends (since 2019) and Forecasted Estimates (till 2035) (USD Billion)
- Table 28.7 Probiotics Market for Animal Feed: Historical Trends (since 2019) and Forecasted Estimates (till 2035)
- Table 28.8 Probiotics Market for Other Probiotics: Historical Trends (since 2019) and Forecasted Estimates (till 2035) (USD Billion)
- Table 28.9 Probiotics Market: Distribution by Type of Food and Beverage
- Table 28.10 Probiotics Market for Fermented Foods: Historical Trends (since 2019) and Forecasted Estimates (till 2035) (USD Billion)
- Table 28.11 Probiotics Market for Beverages: Historical Trends (since 2019) and Forecasted Estimates (till 2035) (USD Billion)
- Table 28.12 Probiotics Market for Dry Foods: Historical Trends (since 2019) and Forecasted Estimates (till 2035) (USD Billion)
- Table 28.13 Probiotics Market for Other Foods and Beverages: Historical Trends (since 2019) and Forecasted Estimates (till 2035) (USD Billion)
- Table 28.14 Probiotics Market: Distribution by Type of Food and Beverage Product
- Table 28.15 Probiotics Market for Dairy Products: Historical Trends (since 2019) and Forecasted Estimates (till 2035) (USD Billion)
- Table 28.16 Probiotics Market for Non-Dairy Products: Historical Trends (since 2019) and Forecasted Estimates (till 2035) (USD Billion)
- Table 28.17 Probiotics Market: Distribution by Type of Probiotic Dietary Supplement
- Table 28.18 Probiotics Market for Nutritional Supplements: Historical Trends (since 2019) and Forecasted Estimates (till 2035) (USD Billion)
- Table 28.19 Probiotics Market for Specialty Supplements: Historical Trends (since 2019) and Forecasted Estimates (till 2035) (USD Billion)
- Table 28.20 Probiotics Market for Infant Formula: Historical Trends (since 2019) and Forecasted Estimates (till 2035) (USD Billion)
- Table 28.21 Probiotics Market for Other Probiotic Dietary Supplements: Historical Trends (since 2019) and Forecasted Estimates (till 2035)
(USD Billion)
- Table 28.22 Probiotics Market: Distribution by Type of Ingredient
- Table 28.23 Probiotics Market for Bacteria: Historical Trends (since 2019) and Forecasted Estimates (till 2035) (USD Billion)
- Table 28.24 Probiotics Market for Yeast: Historical Trends (since 2019) and Forecasted Estimates (till 2035) (USD Billion)
- Table 28.25 Probiotics Market: Distribution by End User
- Table 28.26 Probiotics Market for Humans: Historical Trends (since 2019) and Forecasted Estimates (till 2035) (USD Billion)
- Table 28.27 Probiotics Market for Animals: Historical Trends (since 2019) and Forecasted Estimates (till 2035) (USD Billion)
- Table 28.28 Probiotics Market: Distribution by Target Human Population
- Table 28.29 Probiotics Market for Adults: Historical Trends (since 2019) and Forecasted Estimates (till 2035) (USD Billion)
- Table 28.30 Probiotics Market for Children / Infants: Historical Trends (since 2019) and Forecasted Estimates (till 2035) (USD Billion)
- Table 28.31 Probiotics Market: Distribution by Distribution Channel
- Table 28.32 Probiotics Market for Hypermarkets / Supermarkets: Historical Trends (since 2019) and Forecasted Estimates (till 2035)
(USD Billion)
- Table 28.33 Probiotics Market for Pharmacies / Drug Stores: Historical Trends (since 2019) and Forecasted Estimates (till 2035) (USD Billion)
- Table 28.34 Probiotics Market for Specialty Stores: Historical Trends (since 2019) and Forecasted Estimates (till 2035) (USD Billion)
- Table 28.35 Probiotics Market for Online Stores: Historical Trends (since 2019) and Forecasted Estimates (till 2035) (USD Billion)
- Table 28.36 Probiotics Market for Other Distribution Channels: Historical Trends (since 2019) and Forecasted Estimates (till 2035) (USD Billion)
- Table 28.37 Probiotics Market: Distribution by Geographical Regions
- Table 28.38 Probiotics Market in North America: Historical Trends (since 2019) and Forecasted Estimates (till 2035) (USD Billion)
- Table 28.39 Probiotics Market in the US: Historical Trends (since 2019) and Forecasted Estimates (till 2035) (USD Billion)
- Table 28.40 Probiotics Market in Canada: Historical Trends (since 2019) and Forecasted Estimates (till 2035) (USD Billion)
- Table 28.41 Probiotics Market in Europe: Historical Trends (since 2019) and Forecasted Estimates (till 2035) (USD Billion)
- Table 28.42 Probiotics Market in Italy: Historical Trends (since 2019) and Forecasted Estimates (till 2035) (USD Billion)
- Table 28.43 Probiotics Market in France: Historical Trends (since 2019) and Forecasted Estimates (till 2035) 2035 (USD Billion)
- Table 28.44 Probiotics Market in Germany: Historical Trends (since 2019) and Forecasted Estimates (till 2035) (USD Billion)
- Table 28.45 Probiotics Market in Spain: Historical Trends (since 2019) and Forecasted Estimates (till 2035) (USD Billion)
- Table 28.46 Probiotics Market in the UK: Historical Trends (since 2019) and Forecasted Estimates (till 2035) (USD Billion)
- Table 28.47 Probiotics Market in Rest of Europe: Historical Trends (since 2019) and Forecasted Estimates (till 2035) (USD Billion)
- Table 28.48 Probiotics Market in Asia-Pacific: Historical Trends (since 2019) and Forecasted Estimates (till 2035) (USD Billion)
- Table 28.49 Probiotics Market in China: Historical Trends (since 2019) and Forecasted Estimates (till 2035) (USD Billion)
- Table 28.50 Probiotics Market in India: Historical Trends (since 2019) and Forecasted Estimates (till 2035) (USD Billion)
- Table 28.51 Probiotics Market in South Korea: Historical Trends (since 2019) and Forecasted Estimates (till 2035 (USD Billion)
- Table 28.52 Probiotics Market in Japan: Historical Trends (since 2019) and Forecasted Estimates (till 2035) (USD Billion)
- Table 28.53 Probiotics Market in Rest of Asia-Pacific: Historical Trends (since 2019) and Forecasted Estimates (till 2035) (USD Billion)
- Table 28.54 Probiotics Market in Middle East and North Africa: Historical Trends (since 2019) and Forecasted Estimates (till 2035) (USD Billion)
- Table 28.55 Probiotics Market in UAE: Historical Trends (since 2019) and Forecasted Estimates (till 2035) (USD Billion)
- Table 28.56 Probiotics Market in Israel: Historical Trends (since 2019) and Forecasted Estimates (till 2035) (USD Billion)
- Table 28.57 Probiotics Market in Saudi Arabia: Historical Trends (since 2019) and Forecasted Estimates (till 2035) (USD Billion)
- Table 28.58 Probiotics Market in Latin America: Historical Trends (since 2019) and Forecasted Estimates (till 2035) (USD Billion)
- Table 28.59 Probiotics Market in Brazil: Historical Trends (since 2019) and Forecasted Estimates (till 2035) (USD Billion)
- Table 28.60 Probiotics Market in Mexico: Historical Trends (since 2019) and Forecasted Estimates (till 2035) (USD Billion)
- Table 28.61 Probiotics Market in Rest of Latin America: Historical Trends (since 2019) and Forecasted Estimates (till 2035) (USD Billion)
- Table 28.62 Leading Probiotics Providers: Distribution by Number of Probiotic Brands
- Table 28.63 Leading Probiotics Providers: Distribution by Type of Probiotic
- Table 28.64 Leading Probiotics Providers: Distribution by Type of Probiotic Dietary Supplement
- Table 28.65 Leading Probiotics Providers: Distribution by Type of Food and Beverage
- Table 28.66 Leading Probiotics Providers: Distribution by Type of Food and Beverage Product
- Table 28.67 Leading Probiotics Providers: Distribution by Type of Ingredient
- Table 28.68 Leading Probiotics Providers: Distribution by Type of Bacteria
- Table 28.69 Leading Probiotics Providers: Distribution by Type of Yeast
- Table 28.70 Leading Probiotics Providers: Distribution by End User
- Table 28.71 Leading Probiotics Providers: Distribution by Target Human Population
- Table 28.72 Probiotics Providers: Distribution by Year of Establishment
- Table 28.73 Probiotics Providers: Distribution by Company Size
- Table 28.74 Probiotics Providers: Distribution by Location of Headquarters
- Table 28.75 ADM: Financial Information (USD Billion)
- Table 28.76 IFF: Financial Information (USD Billion)
- Table 28.77 Lallemand: Financial Information (CHF Billion)
- Table 28.78 Danone: Financial Information (USD Million)
- Table 28.79 Nestle: Financial Information (CHF Billion)
- Table 28.80 Probi: Financial Information (USD Million)
- Table 28.81 Morinaga Milk: Financial Information (YEN Billion)
- Table 28.82 Yakult Yonsha: Financial Information (USD Million)
- Table 28.83 Patent Analysis: Distribution by Type of Patent
- Table 28.84 Patent Analysis: Cumulative Distribution by Patent Publication Year, since 2020
- Table 28.85 Patent Analysis: Distribution by Type of Patent and Patent Publication Year
- Table 28.86 Patent Analysis: Distribution by Geography
- Table 28.87 Leading Industry Players: Distribution by Nsumber of Patents
- Table 28.88 Patent Analysis: Distribution by Patent Age
List of Figures
- Figure 2.1 Research Methodology: Project Methodology
- Figure 2.2 Research Methodology: Forecast Methodology
- Figure 5.1 Executive Summary: Market Landscape
- Figure 5.2 Executive Summary: Patent Analysis
- Figure 5.3 Executive Summary: Market Forecast and Opportunity Analysis
- Figure 6.1 Types of Probiotics
- Figure 6.2 Applications of Probiotics
- Figure 7.1 Market Drivers
- Figure 7.2. Market Restraints
- Figure 7.3. Market Opportunities
- Figure 7.4. Market Challenges
- Figure 8.1 Global Probiotics Market: Historical Trends (since 2019) and Forecasted Estimates (till 2035) (USD Billion)
- Figure 8.2 Global Probiotics Market: Forecasted Estimates (till 2035): Conservative Scenario (USD Billion)
- Figure 8.3 Global Probiotics Market: Forecasted Estimates (till 2035): Optimistic Scenario (USD Billion)
- Figure 9.1 Probiotics Market: Distribution by Type of Probiotic
- Figure 9.2 Probiotics Market for Foods and Beverages: Historical Trends (since 2019) and Forecasted Estimates (till 2035) (USD Billion)
- Figure 9.3 Probiotics Market for Probiotic Dietary Supplements: Historical Trends (since 2019) and Forecasted Estimates (till 2035) (USD Billion)
- Figure 9.4 Probiotics Market for Animal Feed: Historical Trends (since 2019) and Forecasted Estimates (till 2035)
- Figure 9.5 Probiotics Market for Other Probiotics: Historical Trends (since 2019) and Forecasted Estimates (till 2035) (USD Billion)
- Figure 10.1 Probiotics Market: Distribution by Type of Food and Beverage
- Figure 10.2 Probiotics Market for Fermented Foods: Historical Trends (since 2019) and Forecasted Estimates (till 2035) (USD Billion)
- Figure 10.3 Probiotics Market for Beverages: Historical Trends (since 2019) and Forecasted Estimates (till 2035) (USD Billion)
- Figure 10.4 Probiotics Market for Dry Foods: Historical Trends (since 2019) and Forecasted Estimates (till 2035) (USD Billion)
- Figure 10.5 Probiotics Market for Other Foods and Beverages: Historical Trends (since 2019) and Forecasted Estimates (till 2035) (USD Billion)
- Figure 10.6 Probiotics Market: Distribution by Type of Food and Beverage Product
- Figure 10.7 Probiotics Market for Dairy Products: Historical Trends (since 2019) and Forecasted Estimates (till 2035) (USD Billion)
- Figure 10.8 Probiotics Market for Non-Dairy Products: Historical Trends (since 2019) and Forecasted Estimates (till 2035) (USD Billion)
- Figure 11.1 Probiotics Market: Distribution by Type of Probiotic Dietary Supplement
- Figure 11.2 Probiotics Market for Nutritional Supplements: Historical Trends (since 2019) and Forecasted Estimates (till 2035) (USD Billion)
- Figure 11.3 Probiotics Market for Specialty Supplements: Historical Trends (since 2019) and Forecasted Estimates (till 2035) (USD Billion)
- Figure 11.4 Probiotics Market for Infant Formula: Historical Trends (since 2019) and Forecasted Estimates (till 2035) (USD Billion)
- Figure 11.5 Probiotics Market for Other Probiotic Dietary Supplements: Historical Trends (since 2019) and Forecasted Estimates (till 2035)
(USD Billion)
- Figure 12.1 Probiotics Market: Distribution by Type of Ingredient
- Figure 12.2 Probiotics Market for Bacteria: Historical Trends (since 2019) and Forecasted Estimates (till 2035) (USD Billion)
- Figure 12.3 Probiotics Market for Yeast: Historical Trends (since 2019) and Forecasted Estimates (till 2035) (USD Billion)
- Figure 13.1 Probiotics Market: Distribution by End User
- Figure 13.2 Probiotics Market for Humans: Historical Trends (since 2019) and Forecasted Estimates (till 2035) (USD Billion)
- Figure 13.3 Probiotics Market for Animals: Historical Trends (since 2019) and Forecasted Estimates (till 2035) (USD Billion)
- Figure 14.1 Probiotics Market: Distribution by Target Human Population
- Figure 14.2 Probiotics Market for Adults: Historical Trends (since 2019) and Forecasted Estimates (till 2035) (USD Billion)
- Figure 14.3 Probiotics Market for Children / Infants: Historical Trends (since 2019) and Forecasted Estimates (till 2035) (USD Billion)
- Figure 15.1 Probiotics Market: Distribution by Distribution Channel
- Figure 15.2 Probiotics Market for Hypermarkets / Supermarkets: Historical Trends (since 2019) and Forecasted Estimates (till 2035) (USD Billion)
- Figure 15.3 Probiotics Market for Pharmacies / Drug Stores: Historical Trends (since 2019) and Forecasted Estimates (till 2035) (USD Billion)
- Figure 15.4 Probiotics Market for Specialty Stores: Historical Trends (since 2019) and Forecasted Estimates (till 2035) (USD Billion)
- Figure 15.5 Probiotics Market for Online Stores: Historical Trends (since 2019) and Forecasted Estimates (till 2035) (USD Billion)
- Figure 15.6 Probiotics Market for Other Distribution Channels: Historical Trends (since 2019) and Forecasted Estimates (till 2035) (USD Billion)
- Figure 16.1 Probiotics Market: Distribution by Geographical Regions
- Figure 16.2 Probiotics Market in North America: Historical Trends (since 2019) and Forecasted Estimates (till 2035) (USD Billion)
- Figure 16.3 Probiotics Market in the US: Historical Trends (since 2019) and Forecasted Estimates (till 2035) (USD Billion)
- Figure 16.4 Probiotics Market in Canada: Historical Trends (since 2019) and Forecasted Estimates (till 2035) (USD Billion)
- Figure 16.5 Probiotics Market in Europe: Historical Trends (since 2019) and Forecasted Estimates (till 2035) (USD Billion)
- Figure 16.6 Probiotics Market in Italy: Historical Trends (since 2019) and Forecasted Estimates (till 2035) (USD Billion)
- Figure 16.7 Probiotics Market in France: Historical Trends (since 2019) and Forecasted Estimates (till 2035) (USD Billion)
- Figure 16.8 Probiotics Market in Germany: Historical Trends (since 2019) and Forecasted Estimates (till 2035) (USD Billion)
- Figure 16.9 Probiotics Market in Spain: Historical Trends (since 2019) and Forecasted Estimates (till 2035) (USD Billion)
- Figure 16.10 Probiotics Market in the UK: Historical Trends (since 2019) and Forecasted Estimates (till 2035) (USD Billion)
- Figure 16.11 Probiotics Market in Rest of Europe: Historical Trends (since 2019) and Forecasted Estimates (till 2035) (USD Billion)
- Figure 16.12 Probiotics Market in Asia-Pacific: Historical Trends (since 2019) and Forecasted Estimates (till 2035) (USD Billion)
- Figure 16.13 Probiotics Market in China: Historical Trends (since 2019) and Forecasted Estimates (till 2035) (USD Billion)
- Figure 16.14 Probiotics Market in India: Historical Trends (since 2019) and Forecasted Estimates (till 2035) (USD Billion)
- Figure 16.15 Probiotics Market in South Korea: Historical Trends (since 2019) and Forecasted Estimates (till 2035) (USD Billion)
- Figure 16.16 Probiotics Market in Japan: Historical Trends (since 2019) and Forecasted Estimates (till 2035) (USD Billion)
- Figure 16.17 Probiotics Market in Rest of Asia-Pacific: Historical Trends (since 2019) and Forecasted Estimates (till 2035) (USD Billion)
- Figure 16.18 Probiotics Market in Middle East and North Africa: Historical Trends (since 2019) and Forecasted Estimates (till 2035) (USD Billion)
- Figure 16.19 Probiotics Market in UAE: Historical Trends (since 2019) and Forecasted Estimates (till 2035) (USD Billion)
- Figure 16.20 Probiotics Market in Israel: Historical Trends (since 2019) and Forecasted Estimates (till 2035) (USD Billion)
- Figure 16.21 Probiotics Market in Saudi Arabia: Historical Trends (since 2019) and Forecasted Estimates (till 2035) (USD Billion)
- Figure 16.22 Probiotics Market in Latin America: Historical Trends (since 2019) and Forecasted Estimates (till 2035) (USD Billion)
- Figure 16.23 Probiotics Market in Brazil: Historical Trends (since 2019) and Forecasted Estimates (till 2035) (USD Billion)
- Figure 16.24 Probiotics Market in Mexico: Historical Trends (since 2019) and Forecasted Estimates (till 2035) (USD Billion)
- Figure 16.25 Probiotics Market in Rest of Latin America: Historical Trends (since 2019) and Forecasted Estimates (till 2035) (USD Billion)
- Figure 16.26 Market Movement Analysis
- Figure 16.27 Penetration-Growth (P-G) Matrix
- Figure 18.1 Leading Probiotics Providers: Distribution by Number of Probiotic Brands
- Figure 18.2 Leading Probiotics Providers: Distribution by Type of Probiotic
- Figure 18.3 Leading Probiotics Providers: Distribution by Type of Probiotic Dietary Supplement
- Figure 18.4 Leading Probiotics Providers: Distribution by Type of Food and Beverage
- Figure 18.5 Leading Probiotics Providers: Distribution by Type of Food and Beverage Product
- Figure 18.6 Leading Probiotics Providers: Distribution by Type of Ingredient
- Figure 18.7 Leading Probiotics Providers: Distribution by Type of Bacteria
- Figure 18.8 Leading Probiotics Providers: Distribution by Type of Yeast
- Figure 18.9 Leading Probiotics Providers: Distribution by End User
- Figure 18.10 Leading Probiotics Providers: Distribution by Target Human Population
- Figure 18.11 Probiotics Providers: Distribution by Year of Establishment
- Figure 18.12 Probiotics Providers: Distribution by Company Size
- Figure 18.13 Probiotics Providers: Distribution by Location of Headquarters
- Figure 19.1 Leading Probiotics Providers: Company Competitiveness
- Figure 19.2 Nestle: Benchmarking Analysis
- Figure 19.3 Arla Foods: Benchmarking Analysis
- Figure 19.4 Morinaga Milk: Benchmarking Analysis
- Figure 19.5 ADM: Benchmarking Analysis
- Figure 19.6 Lallemand: Benchmarking Analysis
- Figure 19.7 Danone: Benchmarking Analysis
- Figure 19.8 General Mills: Benchmarking Analysis
- Figure 19.9 Meiji: Benchmarking Analysis
- Figure 19.10 IFF: Benchmarking Analysis
- Figure 19.11 Yakult Honsha: Benchmarking Analysis
- Figure 20.1 ADM: Financial Information (USD Billion)
- Figure 20.2 IFF: Financial Information (USD Billion)
- Figure 20.3 Lallemand: Financial Information (CHF Billion)
- Figure 21.1 Danone: Financial Information (USD Million)
- Figure 21.2 Nestle: Financial Information (CHF Billion)
- Figure 21.3 Probi: Financial Information (USD Million)
- Figure 22.1 Morinaga Milk: Financial Information (YEN Billion)
- Figure 22.2 Yakult Honsha: Financial Information (USD Million)
- Figure 23.1 Patent Analysis: Distribution by Type of Patent
- Figure 23.2 Patent Analysis: Cumulative Distribution by Patent Publication Year, since 2020
- Figure 23.3 Patent Analysis: Distribution by Type of Patent and Patent Publication Year
- Figure 23.4 Patent Analysis: Distribution by Geography
- Figure 23.5 Patent Analysis: Distribution by CPC Symbols
- Figure 23.6 Leading Industry Players: Distribution by Number of Patents
- Figure 23.7 Patent Benchmarking Analysis: Distribution of Patent Characteristics (CPC Codes) by Leading Industry Players
- Figure 23.8 Patent Analysis: Distribution by Patent Age
- Figure 23.9 Patent Analysis: Valuation Analysis
- Figure 24.1 Overview of Probiotics Manufacturing Process and Stakeholders Involved
- Figure 24.2 Schematic Representation of Probiotics from Formulation to Large Scale Production
- Figure 26.1 Threat of New Entrants
- Figure 26.2 Bargaining Power of Buyers
- Figure 26.3 Bargaining Power of Suppliers
- Figure 26.4 Threat of Substitute Products
- Figure 26.5 Rivalry Among Existing Competitors
- Figure 26.6 Porter's Five Forces: Harvey Ball Analysis
- Figure 26.7 Porter's Five Forces: Concluding Remark

