
PUBLISHER: Roots Analysis | PRODUCT CODE: 1920864

PUBLISHER: Roots Analysis | PRODUCT CODE: 1920864
Pharmaceutical Contract Manufacturing Market (5th Edition): Trends and Forecast Till 2035 - Distribution by Type of Product Manufactured, Type of API, API Potency, FDF, Dosage Form, Oral Solid, End User, Geographical Regions and Key Players
Pharmaceutical Contract Manufacturing Market: Overview
As per Roots Analysis, the pharmaceutical contract manufacturing market is estimated to grow from USD 100.3 billion in the current year to USD 155.4 billion by 2035, at a CAGR of 4.5% during the forecast period, till 2035.
Pharmaceutical Contract Manufacturing Market: Growth and Trends
Contract manufacturing involves outsourcing specific development and / or production tasks to an external service provider. This entails the development of products by one firm, using the label or brand of a different firm. The most frequently outsourced tasks by pharmaceutical companies encompass formulation design, dosage form development, clinical / commercial manufacturing, packaging, and logistics.
Interestingly, the contemporary pipeline of drug candidates is becoming increasingly intricate, necessitating specialized facilities, equipment, and operational knowledge. The number of individuals affected by chronic illnesses has also risen considerably, leading to a continuous need for innovative medications. To address this increasing demand, various smaller companies and some large pharmaceutical firms have started outsourcing their production activities to contract service providers. Technological developments and market need for innovative treatments have also persisted in their development.
Notably, CMOs are adapting to new trends by incorporating customized therapies, ongoing manufacturing methods, and techniques for digital health integration. Through adopting innovation, sustainability, and teamwork, pharmaceutical CMOs will greatly impact the healthcare field and witness notable growth in the coming years.
Growth Drivers: Strategic Enablers of Market Expansion
Increasing demand for biologics, monoclonal antibodies, and novel therapies such as ADCs and GLP-1 medications drive outsourcing to expert CMOs with enhanced capabilities. Further, expiring patents of major biologics and pricing challenges for innovator medications necessitates pharmaceutical firms to pursue cost-effective contract manufacturing strategies. In addition, rising rates of chronic illnesses and the demand for new medications boost dependence on CMOs for scalable manufacturing and quicker time-to-market.
Market Challenges: Critical Barriers Impeding Progress
The pharmaceutical contract manufacturing market faces significant hurdles that hinder its growth including stringent regulatory compliance from regulatory bodies like the FDA and EMA, coupled with rising costs of production technologies. These hurdles burden CMOs with high compliance expenses. Further, global trade instability disrupts supply chains for APIs and raw materials, while pricing pressures in the US and Europe intensify cost management issues.
Pharmaceutical Contract Manufacturing Market: Key Insights
The report delves into the current state of the pharmaceutical contract manufacturing market and identifies potential growth opportunities within industry. Some key findings from the report include:
- The current market landscape features the presence of close to 510 players that claim to offer contract manufacturing services for pharmaceuticals across the world; 50% of these are headquartered in Asia-Pacific.

- Majority (~90%) of the pharmaceutical contract manufacturers offer services for producing finished dose formulations; further, >75% players offer services for fill finish / packaging and labeling.
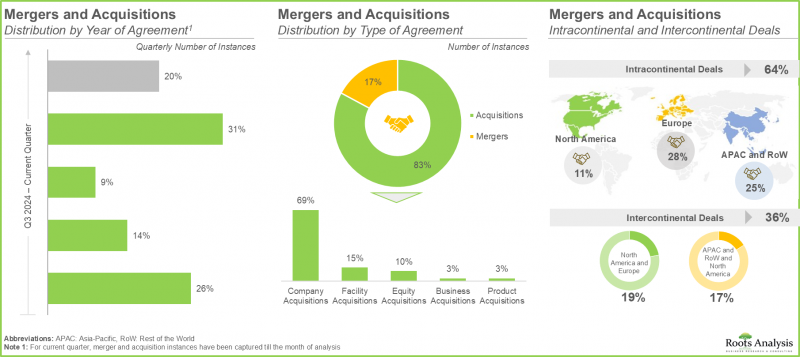
- M&As allow companies to establish themselves as one-stop shops and build a competitive edge in the steadily evolving market landscape.
- In order to meet the rising demand for small molecules, CMOs have made significant investments in expanding their existing capacities and capabilities; in the recent past, this trend was most pronounced in Europe.
- The global pharmaceutical contract manufacturing capacity is well distributed across different facilities worldwide; notably, large and very large players account for more than 85% of the total capacity.
- In order to reduce high capital investments and operational costs associated with setting up and maintaining an in-house production facility, the demand for pharmaceutical contract manufacturing is anticipated to rise significantly.
- Currently, majority of the pharmaceutical contract manufacturing market share is captured by North America; this can be attributed to the advanced healthcare infrastructure, enabling players to conduct extensive research.
- The oral solids sub-segment is estimated to capture majority of the overall market share in the current year, owing to their cost-efficiency, ease of administration and high patient compliance.
- North America is expected to capture a significant market share of the overall pharmaceutical contract manufacturing market; this trend is unlikely to change in the future.
- Pharmaceutical contract manufacturing market in the US is expected to grow at CAGR of 4.3%; this is due to the increasing demand for small molecules, consequently fueling the need for advanced manufacturing capabilities.
- Given the rising demand for small molecules, along with the rise in mergers and acquisitions, and expansion activity, the pharmaceutical CMO market is likely to experience substantial growth in the coming years.
Pharmaceutical Contract Manufacturing Market
The market sizing and opportunity analysis has been segmented across the following parameters:
By Type of Product Manufactured
- API & Intermediates
- FDF
By Type of API
- Originator API
- Generic API
By API Potency
- Low Potent API
- High Potent API
By Type of FDF
- Originator FDF
- Generic FDF
By Dosage Form
- Oral Solids
- Liquids
- Emulsions
- Other Dosage Forms
By Type of Oral Solid
- Tablets
- Capsules
- Others
By Type of Packaging Offered
- Bottles
- Blister Packs
- Vials
- Prefilled Syringes
- Cartridges
- Ampoules
- Oral Liquid Bottles
- Others
By Scale of Operation
- Clinical
- Commercial
By End User
- Small
- Mid-sized
- Large and Very Large
By Geographical Regions
- North America
- US
- Canada
- Europe
- Belgium
- Switzerland
- UK
- Germany
- Ireland
- Netherlands
- Italy
- France
- Sweden
- Rest of Europe
Asia-Pacific and Rest of the World
- China
- India
- Japan
- Korea
- Rest of Asia-Pacific and Other Countries
Pharmaceutical Contract Manufacturing Market: Key Segments
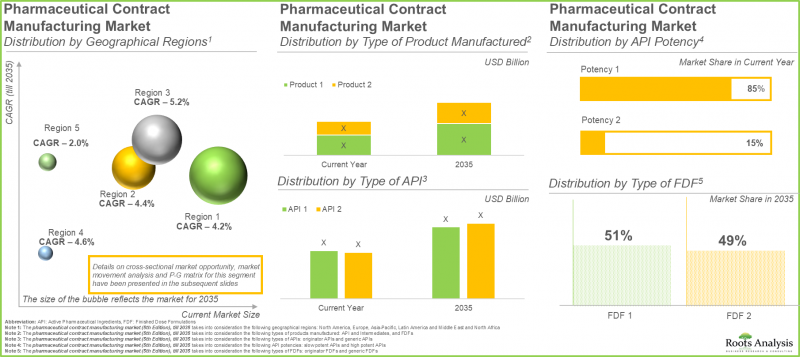
The Manufacturing of Low Potent APIs Predominates the Pharmaceutical Contract Manufacturing Market
At present, low potent APIs account for 85% of the total market share. This is mainly due to their large-scale manufacturing and scalable methods. In addition, these APIs are utilized by pharmaceutical companies for treating different illnesses, including diabetes and infectious diseases. This extensive usage results in persistently elevated demand worldwide. Notably, the segment of highly potent APIs is expected to expand at a quicker rate. The increasing need for targeted treatments and precision medications fuels this expansion, as these therapies prove to be very effective even at minimal doses because of their strong therapeutic benefits.
Oral Solid Dosage Forms Dominate in the Pharmaceutical Contract Manufacturing Sector with Unmatched Demand
The oral solid dosage manufacturing sector represents approximately 55% of the total revenue in the pharma contract manufacturing market. This results from their low cost, convenience for patients, and effectiveness in mass production. In the future, the liquids category is expected to demonstrate greater growth in the pharmaceutical contract manufacturing market throughout the forecast .
North America Dominates the Pharmaceutical Contract Manufacturing Domain
North America leads the pharmaceutical contract manufacturing market, capturing approximately 45% of total revenue. The presence of a highly developed pharmaceutical sector, robust regulatory systems, and established leading global drug firms is driving the demand for pharmaceutical contract manufacturers in this region.
Primary Research Overview
The opinions and insights presented in the market report were also influenced by discussions held with senior stakeholders in the industry. The market report includes detailed transcripts of interviews conducted with the following individuals:
- President and Chief Executive Officer, Corporate Strategy and Business Development, Mid-sized Company, US
- Former Chief Executive Officer, Large Company, Switzerland
- Former Vice President Business Development, Marketing, and IP, Mid-sized Company, Israel
- Director, Operations, Mid-sized Company, India
- Former Director of Business Development, Large Company, US
- Former Director, Commercial Development, Cell Therapy, Mid-sized Company, Switzerland
- Former Director, Pharmaceuticals Marketing, Large Company, France
- Digitalization and Artificial Intelligence Manager, Large Company, Switzerland
Example Players in Pharmaceutical Contract Manufacturing Market
- Albemarle
- Aspen Pharmacare
- Bausch Health Sciences
- Catalent
- Delpharm
- Eurofins Scientific
- Evonik Industries
- Fareva
- Fresenius Kabi
- Intas Pharmaceuticals
- Lonza
- Micro Labs
- Nipro Patch
- Patheon
- PiSA Farmaceutica
- Recipharm
- Sandoz
- West Pharmaceutical Services
- Wockhardt
- WuXi AppTec
Pharmaceutical Contract Manufacturing Market: Research Coverage
- Market Sizing and Opportunity Analysis: The report features an in-depth analysis of the pharmaceutical contract manufacturing market, focusing on key market segments, including [A] type of product manufactured, [B] type of API, [C] API potency, [D] type of FDF, [E] dosage form, [F] type of oral solid [G] type of packaging offered [H] scale of operation, [I] end user and [J] geographical regions.
- Market Landscape: A detailed overview of the current market landscape of companies engaged in offering contract manufacturing services for small molecules, along with information on several relevant parameters, such as [A] year of establishment, [B] location of manufacturing facility, [C] type of offering, [D] type of pharmaceutical product manufactured, [E] scale of operation, [F] type of service offered, [G] type of finished dosage form manufactured, [H] type of packaging offered.
- Company Profiles: In-depth profiles of prominent players North America, Europe and Asia-Pacific that are engaged in the peptide therapeutics manufacturing market based on [A] year of establishment, [B] location of headquarters, [C] product portfolio, [D] recent developments and [E] an informed future outlook.
- Make versus Buy Framework: A qualitative analysis highlighting various factors that need to be taken into consideration by pharmaceutical drug developers, while deciding whether to manufacture their respective products in-house or engage the services of a CMO.
- Mergers and Acquisitions: A detailed analysis of the various mergers and acquisitions in this domain, based on several relevant parameters, such as [A] year of agreement, [B] type of agreement, [C] geography, [D] most active players (in terms of number of agreements), ownership change matrix and key value drivers of the acquisition agreement.
- Recent Expansions: A detailed analysis of expansions that have taken place in the pharmaceutical contract manufacturing domain, along with analysis on several relevant parameters, such as [A] year of expansion, [B] status of expansion, [C] type of expansion, [D] location of facility, [E] amount invested, [F] type of pharmaceutical product manufactured, [G] type of service offered and [H] most active players.
- Regional Capability Analysis: A detailed regional capability of pharmaceutical contract manufacturing facilities in different regions (North America, Europe, Asia-Pacific and Rest of the World) across the globe.
- Capacity Analysis: An estimate an estimate of the overall installed capacity for the manufacturing of pharmaceuticals, based on information reported by various industry stakeholders in the public domain, highlighting the distribution of the available capacity, based on [A] size of manufacturer (small, mid-sized, and large and very large) and [B] geography (North America, Europe, Asia-Pacific and Rest of the World).
- Demand Analysis: An informed estimate of the annual demand for small molecule drugs, across several relevant parameters, such as [A] scale of operation, [B] type of API, [C] potency of API and [D] geographical regions.
- Market Impact Analysis: An in-depth analysis of the factors that can impact the growth of the global pharmaceutical contract manufacturing market. It also features identification and analysis of [A] key drivers, [B] potential restraints, [C] emerging opportunities, and [D] existing challenges.
Key Questions Answered in this Report
- Which are the leading companies in pharmaceutical contract manufacturing market?
- Which region dominates the pharmaceutical contract manufacturing market?
- What are the key trends observed in the pharmaceutical contract manufacturing market?
- What factors are likely to influence the evolution of this market?
- What are the primary challenges faced by pharmaceutical contract manufacturers?
- What is the current and future market size?
- What is the CAGR of this market?
- How is the current and future market opportunity likely to be distributed across key market segments?
Reasons to Buy this Report
- The report provides a comprehensive market analysis, offering detailed revenue projections of the overall market and its specific sub-segments. This information is valuable to both established market leaders and emerging entrants.
- The report offers stakeholders a comprehensive overview of the market, including key drivers, barriers, opportunities, and challenges. This information empowers stakeholders to stay abreast of market trends and make data-driven decisions to capitalize on growth prospects.
- The report can aid businesses in identifying future opportunities in any sector. It also helps in understanding if those opportunities are worth pursuing.
- The report helps in identifying customer demand by understanding the needs, preferences, and behavior of the target audience in order to tailor products or services effectively.
- The report equips new entrants with requisite information regarding a particular market to help them build successful business strategies.
- The report allows for more effective communication with the audience and in building strong business relations.
Additional Benefits
- Complementary PPT Insights Pack
- Complimentary Excel Data Packs for all Analytical Modules in the Report
- 15% Free Content Customization
- Detailed Report Walkthrough Session with Research Team
- Free Updated report if the report is 6-12 months old or older
TABLE OF CONTENTS
1. PREFACE
- 1.1. Introduction
- 1.2. Report Coverage
- 1.3. Market Segmentation
- 1.4. Key Market Insights
- 1.5. Market Share Insights
- 1.6. Key Questions Asked
2. RESEARCH METHODOLOGY
- 2.1. Chapter Overview
- 2.2. Research Assumptions
- 2.2.1. Market Landscape and Market Trends
- 2.2.2. Market Forecast and Opportunity Analysis
- 2.2.3. Comparative Analysis
- 2.3. Database Building
- 2.3.1. Data Collection
- 2.3.2. Data Validation
- 2.3.3. Data Analysis
- 2.4. Project Methodology
- 2.4.1. Secondary Research
- 2.4.1.1. Annual Reports
- 2.4.1.2. Academic Research Papers
- 2.4.1.3. Company Websites
- 2.4.1.4. Investor Presentations
- 2.4.1.5. Regulatory Filings
- 2.4.1.6. White Papers
- 2.4.1.7. Industry Publications
- 2.4.1.8. Conferences and Seminars
- 2.4.1.9. Government Portals
- 2.4.1.10. Media and Press Releases
- 2.4.1.11. Newsletters
- 2.4.1.12. Industry Databases
- 2.4.1.13. Roots Proprietary Databases
- 2.4.1.14. Paid Databases and Sources
- 2.4.1.15. Social Media Portals
- 2.4.1.16. Other Secondary Sources
- 2.4.2. Primary Research
- 2.4.2.1. Types of Primary Research
- 2.4.2.1.1. Qualitative Research
- 2.4.2.1.2. Quantitative Research
- 2.4.2.1.3. Hybrid Approach
- 2.4.2.2. Advantages of Primary Research
- 2.4.2.3. Techniques for Primary Research
- 2.4.2.3.1. Interviews
- 2.4.2.3.2. Surveys
- 2.4.2.3.3. Focus Groups
- 2.4.2.3.4. Observational Research
- 2.4.2.3.5. Social Media Interactions
- 2.4.2.4. Key Opinion Leaders Considered in Primary Research
- 2.4.2.4.1. Company Executives (CXOs)
- 2.4.2.4.2. Board of Directors
- 2.4.2.4.3. Company Presidents and Vice Presidents
- 2.4.2.4.4. Research and Development Heads
- 2.4.2.4.5. Technical Experts
- 2.4.2.4.6. Subject Matter Experts
- 2.4.2.4.7. Scientists
- 2.4.2.4.8. Doctors and Other Healthcare Providers
- 2.4.2.5. Ethics and Integrity
- 2.4.2.5.1. Research Ethics
- 2.4.2.5.2. Data Integrity
- 2.4.2.1. Types of Primary Research
- 2.4.3. Analytical Tools and Databases
- 2.4.1. Secondary Research
- 2.5. Robust Quality Control
3. MARKET DYNAMICS
- 3.1. Chapter Overview
- 3.2. Forecast Methodology
- 3.2.1. Top-down Approach
- 3.2.2. Bottom-up Approach
- 3.2.3. Hybrid Approach
- 3.3. Market Assessment Framework
- 3.3.1. Total Addressable Market (TAM)
- 3.3.2. Serviceable Addressable Market (SAM)
- 3.3.3. Serviceable Obtainable Market (SOM)
- 3.3.4. Currently Acquired Market (CAM)
- 3.4. Forecasting Tools and Techniques
- 3.4.1. Qualitative Forecasting
- 3.4.2. Correlation
- 3.4.3. Regression
- 3.4.4. Extrapolation
- 3.4.5. Convergence
- 3.4.6. Sensitivity Analysis
- 3.4.7. Scenario Planning
- 3.4.8. Data Visualization
- 3.4.9. Time Series Analysis
- 3.4.10. Forecast Error Analysis
- 3.5. Key Considerations
- 3.5.1. Demographics
- 3.5.2. Government Regulations
- 3.5.3. Reimbursement Scenarios
- 3.5.4. Market Access
- 3.5.5. Supply Chain
- 3.5.6. Industry Consolidation
- 3.5.7. Pandemic / Unforeseen Disruptions Impact
- 3.6. Limitations
4. MACRO-ECONOMIC INDICATORS
- 4.1. Chapter Overview
- 4.2. Market Dynamics
- 4.2.1. Time Period
- 4.2.1.1. Historical Trends
- 4.2.1.2. Current and Forecasted Estimates
- 4.2.2. Currency Coverage
- 4.2.2.1. Major Currencies Affecting the Market
- 4.2.2.2. Factors Affecting Currency Fluctuations on the Industry
- 4.2.2.3. Impact of Currency Fluctuations on the Industry
- 4.2.3. Foreign Currency Exchange Rate
- 4.2.3.1. Impact of Foreign Exchange Rate Volatility on the Market
- 4.2.3.2. Strategies for Mitigating Foreign Exchange Risk
- 4.2.4. Recession
- 4.2.4.1. Assessment of Current Economic Conditions and Potential Impact on the Market
- 4.2.4.2. Historical Analysis of Past Recessions and Lessons Learnt
- 4.2.5. Inflation
- 4.2.5.1. Measurement and Analysis of Inflationary Pressures in the Economy
- 4.2.5.2. Potential Impact of Inflation on the Market Evolution
- 4.2.6. Interest Rates
- 4.2.6.1. Interest Rates and Their Impact on the Market
- 4.2.6.2. Strategies for Managing Interest Rate Risk
- 4.2.7. Commodity Flow Analysis
- 4.2.7.1. Type of Commodity
- 4.2.7.2. Origins and Destinations
- 4.2.7.3. Values and Weights
- 4.2.7.4. Modes of Transportation
- 4.2.8. Global Trade Dynamics
- 4.2.8.1. Import Scenario
- 4.2.8.2. Export Scenario
- 4.2.8.3. Trade Policies
- 4.2.8.4. Strategies for Mitigating the Risks Associated with Trade Barriers
- 4.2.8.5. Impact of Trade Barriers on the Market
- 4.2.9. War Impact Analysis
- 4.2.9.1. Russian-Ukraine War
- 4.2.9.2. Israel-Hamas War
- 4.2.10. COVID Impact / Related Factors
- 4.2.10.1. Global Economic Impact
- 4.2.10.2. Industry-specific Impact
- 4.2.10.3. Government Response and Stimulus Measures
- 4.2.10.4. Future Outlook and Adaptation Strategies
- 4.2.11. Other Indicators
- 4.2.11.1. Fiscal Policy
- 4.2.11.2. Consumer Spending
- 4.2.11.3. Gross Domestic Product
- 4.2.11.4. Employment
- 4.2.11.5. Taxes
- 4.2.11.6. Stock Market Performance
- 4.2.11.7. Cross Border Dynamics
- 4.2.1. Time Period
- 4.3. Conclusion
5. EXECUTIVE SUMMARY
- 5.1. Executive Summary: Market Landscape
- 5.2. Executive Summary: Market Trends
- 5.3. Executive Summary: Market Forecast and Opportunity Analysis
6. INTRODUCTION
- 6.1. Chapter Overview
- 6.2. Type of Third-party Manufacturers
- 6.3. Overview of Pharmaceutical Contract Manufacturing
- 6.4. Evolution of Pharmaceutical Contract Manufacturing
- 6.4.1. Traditional Pharmaceutical Contract Manufacturing Organizations
- 6.4.2. Modern Pharmaceutical Contract Manufacturing Organizations
- 6.5. Need for Outsourcing in the Pharmaceutical Industry
- 6.6. Recent Developments in the Pharmaceutical Contract Manufacturing Industry
- 6.6.1. Integration of Artificial Intelligence
- 6.6.2. Strategic Partnerships and Collaborations
- 6.6.2.1. Strategic Long-Term Alliance
- 6.6.2.2. Flexible Short-Term Partnership Agreements
- 6.6.3. Integrated End-to-End Business Model
- 6.6.4. Dependence on Software Service Providers
- 6.7. Services Offered by Contract Manufacturing Organizations
- 6.8. Key Considerations while Selecting a Contract Manufacturing Organization
- 6.9. Risks and Challenges Associated with Outsourcing Pharmaceutical Manufacturing Operations
- 6.10. Future Perspectives
7. PHARMACEUTICAL CONTRACT MANUFACTURING ORGANIZATIONS: REGULATORY LANDSCAPE
- 7.1. Chapter Overview
- 7.2. Regulatory Landscape in North America
- 7.2.1. Landscape in the US
- 7.2.2. Landscape in Canada
- 7.3. Regulatory Landscape in Europe
- 7.4. Regulatory Landscape in Asia-Pacific and Rest of the World
- 7.4.1. Landscape in China
- 7.4.2. Landscape in India
- 7.4.3. Landscape in Japan
- 7.4.4. Landscape in South Korea
- 7.4.5. Landscape in Australia
- 7.4.6. Landscape in Brazil
- 7.5. Analysis of Pharmaceutical Contract Manufacturing Organizations by Approval Received from Regulatory Authorities
- 7.6. Regulatory Landscape: Regional Benchmarking Analysis
8. PHARMACEUTICAL CONTRACT MANUFACTURING ORGANIZATIONS: MARKET LANDSCAPE
- 8.1. Chapter Overview
- 8.2. Pharmaceutical Contract Manufacturing Organizations: Overall Market Landscape
- 8.2.1. Analysis by Year of Establishment
- 8.2.2. Analysis by Company Size
- 8.2.3. Analysis by Location of Headquarters (Region)
- 8.2.4. Analysis by Location of Headquarters (Country)
- 8.2.5. Analysis by Location of Manufacturing Facility (Region)
- 8.2.6. Analysis by Type of Offering
- 8.2.7. Analysis by Type of Pharmaceutical Product Manufactured
- 8.2.8. Analysis by Scale of Operation
- 8.2.9. Analysis by Type of Service Offered
- 8.2.10. Analysis by Finished Dosage Form Manufactured
- 8.2.11. Analysis by Type of Packaging Offered
9. COMPANY PROFILES: LEADING PLAYERS
- 9.1. Chapter Overview
- 9.2. Pharmaceutical Contract Manufacturing Organizations based in North America
- 9.2.1. Albemarle
- 9.2.1.1. Company Overview
- 9.2.1.2. Financial Information
- 9.2.1.3. Service Portfolio
- 9.2.1.4. Recent Developments and Future Outlook
- 9.2.1. Albemarle
- similar details are presented for other below mentioned players based on information in the public domain
- 9.2.2. Bausch Health Services
- 9.2.3. Catalent
- 9.2.4. Patheon
- 9.2.5. PiSA Farmaceutica
- 9.2.6. West Pharmaceutical Services
- 9.3. Pharmaceutical Contract Manufacturing Organizations based in Europe
- 9.3.1. Delpharm
- 9.3.2. Eurofins Scientific
- 9.3.3. Evonik Industries
- 9.3.4. Fareva
- 9.3.5. Fresenius Kabi
- 9.3.6. Lonza
- 9.3.7. Recipharm
- 9.3.8. Sandoz
- 9.4. Pharmaceutical Contract Manufacturing Organizations based in Asia-Pacific and Rest of the World
- 9.4.1. Aspen Pharmacare
- 9.4.2. Intas Pharmaceuticals
- 9.4.3. Micro Labs
- 9.4.4. Nipro Patch
- 9.4.5. WuXi AppTec
- 9.4.6. Wockhardt
10. MAKE VERSUS BUY DECISION FRAMEWORK
- 10.1. Chapter Overview
- 10.2. Assumptions and Key Parameters
- 10.3. Pharmaceutical Contract Manufacturers: Make versus Buy Decision Making
- 10.3.1. Scenario 1
- 10.3.2. Scenario 2
- 10.3.3. Scenario 3
- 10.3.4. Scenario 4
- 10.4. Concluding Remarks
11. MERGERS AND ACQUISITIONS
- 11.1. Chapter Overview
- 11.2. Types of Mergers and Acquisitions
- 11.3. Pharmaceutical Contract Manufacturing Organizations: Mergers and Acquisitions
- 11.3.1. Analysis by Year of Agreement
- 11.3.2. Analysis by Type of Agreement
- 11.3.3. Analysis by Geography
- 11.3.3.1. Local and International Agreements
- 11.3.3.2. Intracontinental and Intercontinental Agreements
- 11.3.4. Most Active Players: Analysis by Number of Agreements
- 11.3.5. Ownership Change Matrix
- 11.3.6. Analysis by Key Value Drivers
12. RECENT EXPANSIONS
- 12.1. Chapter Overview
- 12.2. Type of Expansions
- 12.3. Pharmaceutical Contract Manufacturing Organizations: Recent Expansions
- 12.3.1. Analysis by Year of Expansion
- 12.3.2. Analysis by Status of Expansion
- 12.3.3. Analysis by Type of Expansion
- 12.3.4. Analysis by Year and Type of Expansion
- 12.3.5. Analysis by Location of Facility (Region)
- 12.3.6. Analysis by Location of Facility (Country)
- 12.3.7. Analysis by Type of Expansion and Location of Facility (Region)
- 12.3.8. Analysis of Amount Invested by Year of Expansion
- 12.3.9. Analysis of Amount Invested by Type of Expansion
- 12.3.10. Analysis by Type of Pharmaceutical Product Manufactured
- 12.3.11. Analysis by Type of Service Offered
- 12.3.12. Most Active Players: Analysis by Number of Expansions
- 12.3.13. Most Active Players: Analysis by Amount Invested
13. REGIONAL CAPABILITY ANALYSIS
- 13.1. Chapter Overview
- 13.2. Assumptions and Key Parameters
- 13.3. Overall Landscape of Pharmaceutical Contract Manufacturing Facilities
- 13.3.1. Pharmaceutical Contract Manufacturing Facilities in North America
- 13.3.2. Pharmaceutical Contract Manufacturing Facilities in Europe
- 13.3.3. Pharmaceutical Contract Manufacturing Facilities in Asia-Pacific
- 13.3.4. Pharmaceutical Contract Manufacturing Facilities in Rest of the World
14. CAPACITY ANALYSIS
- 14.1. Chapter Overview
- 14.2. Key Assumptions and Methodology
- 14.3. Pharmaceutical Contract Manufacturing: Global Production Capacity
- 14.3.1. Analysis by Company Size
- 14.3.2. Analysis by Scale of Operation
- 14.3.3. Analysis by Location of Manufacturing Facility
- 14.3.3.1. Pharmaceutical Contract Manufacturing Capacity in North America
- 14.3.3.2. Pharmaceutical Contract Manufacturing Capacity in Europe
- 14.3.3.3. Pharmaceutical Contract Manufacturing Capacity in Asia-Pacific
- 14.4. Concluding Remarks
15. DEMAND ANALYSIS
- 15.1. Chapter Overview
- 15.2. Key Assumptions and Methodology
- 15.3. Global Demand for Pharmaceutical Contract Manufacturing
- 15.3.1. Demand for Pharmaceutical Contract Manufacturing: Analysis by Scale of Operation
- 15.3.2. Demand for Pharmaceutical Contract Manufacturing: Analysis by Type of API
- 15.3.3. Demand for Pharmaceutical Contract Manufacturing: Analysis by Potency of API
- 15.3.4. Demand for Pharmaceutical Contract Manufacturing: Analysis by Geographical Regions
16. MARKET IMPACT ANALYSIS: DRIVERS, RESTRAINTS, OPPORTUNITIES AND CHALLENGES
- 16.1. Chapter Overview
- 16.2. Market Drivers
- 16.3. Market Restraints
- 16.4. Market Opportunities
- 16.5. Market Challenges
- 16.6. Conclusion
17. GLOBAL PHARMACEUTICAL CONTRACT MANUFACTURING MARKET
- 17.1. Chapter Overview
- 17.2. Assumptions and Methodology
- 17.3. Global Pharmaceutical Contract Manufacturing Market: Historical Trends (Since 2023) and Forecasted Estimates (Till 2035)
- 17.3.1. Roots Analysis Perspective on Market Growth
- 17.3.2. Scenario Analysis
- 17.3.2.1. Conservative Scenario
- 17.3.2.2. Optimistic Scenario
- 17.4. Key Market Segments
18. PHARMACEUTICAL CONTRACT MANUFACTURING MARKET, BY TYPE OF PRODUCT MANUFACTURED
- 18.1. Chapter Overview
- 18.2. Key Assumptions and Methodology
- 18.3. Pharmaceutical Contract Manufacturing Market: Distribution by Type of Product Manufactured
- 18.3.1. Pharmaceutical Contract Manufacturing Market for API and Intermediates: Historical Trends (Since 2023) and Forecasted Estimates (Till 2035)
- 18.3.2. Pharmaceutical Contract Manufacturing Market for FDFs: Historical Trends (Since 2023) and Forecasted Estimates (Till 2035)
- 18.4. Data Triangulation and Validation
19. PHARMACEUTICAL CONTRACT MANUFACTURING MARKET, BY TYPE OF API
- 19.1. Chapter Overview
- 19.2. Key Assumptions and Methodology
- 19.3. Pharmaceutical Contract Manufacturing Market: Distribution by Type of API
- 19.3.1. Pharmaceutical Contract Manufacturing Market for Originator APIs: Historical Trends (Since 2023) and Forecasted Estimates (Till 2035)
- 19.3.2. Pharmaceutical Contract Manufacturing Market for Generic APIs: Historical Trends (Since 2023) and Forecasted Estimates (Till 2035)
- 19.4. Data Triangulation and Validation
20. PHARMACEUTICAL CONTRACT MANUFACTURING MARKET, BY API POTENCY
- 20.1. Chapter Overview
- 20.2. Key Assumptions and Methodology
- 20.3. Pharmaceutical Contract Manufacturing Market: Distribution by API Potency
- 20.3.1. Pharmaceutical Contract Manufacturing Market for Low Potent APIs: Historical Trends (Since 2023) and Forecasted Estimates (Till 2035)
- 20.3.2. Pharmaceutical Contract Manufacturing Market for High Potent APIs: Historical Trends (Since 2023) and Forecasted Estimates (Till 2035)
- 20.4. Data Triangulation and Validation
21. PHARMACEUTICAL CONTRACT MANUFACTURING MARKET, BY TYPE OF FDF
- 21.1. Chapter Overview
- 21.2. Key Assumptions and Methodology
- 21.3. Pharmaceutical Contract Manufacturing Market: Distribution by Type of FDF
- 21.3.1. Pharmaceutical Contract Manufacturing Market for Originator FDFs: Historical Trends (Since 2023) and Forecasted Estimates (Till 2035)
- 21.3.2. Pharmaceutical Contract Manufacturing Market for Generic FDFs: Historical Trends (Since 2023) and Forecasted Estimates (Till 2035)
- 21.4. Data Triangulation and Validation
22. PHARMACEUTICAL CONTRACT MANUFACTURING MARKET, BY DOSAGE FORM
- 22.1. Chapter Overview
- 22.2. Key Assumptions and Methodology
- 22.3. Pharmaceutical Contract Manufacturing Market: Distribution by Dosage Form
- 22.3.1. Pharmaceutical Contract Manufacturing Market for Oral Solids: Historical Trends (Since 2023) and Forecasted Estimates (Till 2035)
- 22.3.2. Pharmaceutical Contract Manufacturing Market for Liquids: Historical Trends (Since 2023) and Forecasted Estimates (Till 2035)
- 22.3.3. Pharmaceutical Contract Manufacturing Market for Emulsions: Historical Trends (Since 2023) and Forecasted Estimates (Till 2035)
- 22.3.4. Pharmaceutical Contract Manufacturing Market for Other Dosage Forms: Historical Trends (Since 2023) and Forecasted Estimates (Till 2035)
- 22.4. Data Triangulation and Validation
23. PHARMACEUTICAL CONTRACT MANUFACTURING MARKET, BY ORAL SOLIDS
- 23.1. Chapter Overview
- 23.2. Key Assumptions and Methodology
- 23.3. Pharmaceutical Contract Manufacturing Market: Distribution by Oral Solids
- 23.3.1. Pharmaceutical Contract Manufacturing Market for Tablets: Historical Trends (Since 2023) and Forecasted Estimates (Till 2035)
- 23.3.2. Pharmaceutical Contract Manufacturing Market for Capsules: Historical Trends (Since 2023) and Forecasted Estimates (Till 2035)
- 23.3.3. Pharmaceutical Contract Manufacturing Market for Other Solid Doses: Historical Trends (Since 2023) and Forecasted Estimates (Till 2035)
- 23.4. Data Triangulation and Validation
24. PHARMACEUTICAL CONTRACT MANUFACTURING MARKET, BY TYPE OF PACKAGING OFFERED
- 24.1. Chapter Overview
- 24.2. Key Assumptions and Methodology
- 24.3. Pharmaceutical Contract Manufacturing Market: Distribution by Type of Packaging Offered
- 24.3.1. Pharmaceutical Contract Manufacturing Market for Bottles: Historical Trends (Since 2023) and Forecasted Estimates (Till 2035)
- 24.3.2. Pharmaceutical Contract Manufacturing Market for Blister Packs: Historical Trends (Since 2023) and Forecasted Estimates (Till 2035)
- 24.3.3. Pharmaceutical Contract Manufacturing Market for Oral Liquid Bottles: Historical Trends (Since 2023) and Forecasted Estimates (Till 2035)
- 24.3.4. Pharmaceutical Contract Manufacturing Market for Vials: Historical Trends (Since 2023) and Forecasted Estimates (Till 2035)
- 24.3.5. Pharmaceutical Contract Manufacturing Market for Prefilled Syringe: Historical Trends (Since 2023) and Forecasted Estimates (Till 2035)
- 24.3.6. Pharmaceutical Contract Manufacturing Market for Cartridges: Historical Trends (Since 2023) and Forecasted Estimates (Till 2035)
- 24.3.7. Pharmaceutical Contract Manufacturing Market for Ampoules: Historical Trends (Since 2023) and Forecasted Estimates (Till 2035)
- 24.3.8. Pharmaceutical Contract Manufacturing Market for Other Types of Packaging: Historical Trends (Since 2023) and Forecasted Estimates (Till 2035)
- 24.4. Data Triangulation and Validation
25. PHARMACEUTICAL CONTRACT MANUFACTURING MARKET, BY SCALE OF OPERATION
- 25.1. Chapter Overview
- 25.2. Key Assumptions and Methodology
- 25.3. Pharmaceutical Contract Manufacturing Market: Distribution by Scale of Operation
- 25.3.1. Pharmaceutical Contract Manufacturing Market for Clinical Scale: Historical Trends (Since 2023) and Forecasted Estimates (Till 2035)
- 25.3.2. Pharmaceutical Contract Manufacturing Market for Commercial Scale: Historical Trends (Since 2023) and Forecasted Estimates (Till 2035)
- 25.4. Data Triangulation and Validation
26. PHARMACEUTICAL CONTRACT MANUFACTURING MARKET, BY END-USER
- 26.1. Chapter Overview
- 26.2. Key Assumptions and Methodology
- 26.3. Pharmaceutical Contract Manufacturing Market: Distribution by End-user
- 26.3.1. Pharmaceutical Contract Manufacturing Market for Small Companies: Historical Trends (Since 2023) and Forecasted Estimates (Till 2035)
- 26.3.2. Pharmaceutical Contract Manufacturing Market for Mid-sized Companies: Historical Trends (Since 2023) and Forecasted Estimates (Till 2035)
- 26.3.3. Pharmaceutical Contract Manufacturing Market for Large and Very Large Companies: Historical Trends (Since 2023) and Forecasted Estimates (Till 2035)
- 26.4. Data Triangulation and Validation
27. PHARMACEUTICAL CONTRACT MANUFACTURING MARKET, BY GEOGRAPHICAL REGIONS
- 27.1. Chapter Overview
- 27.2. Key Assumptions and Methodology
- 27.3. Pharmaceutical Contract Manufacturing Market: Distribution by Geographical Regions
- 27.3.1. Pharmaceutical Contract Manufacturing Market in North America: Historical Trends (Since 2023) and Forecasted Estimates (Till 2035)
- 27.3.1.1. Pharmaceutical Contract Manufacturing Market in the US: Historical Trends (Since 2023) and Forecasted Estimates (Till 2035)
- 27.3.1.2. Pharmaceutical Contract Manufacturing Market in Canada: Historical Trends (Since 2023) and Forecasted Estimates (Till 2035)
- 27.3.2. Pharmaceutical Contract Manufacturing Market in Europe: Historical Trends (Since 2023) and Forecasted Estimates (Till 2035)
- 27.3.2.1. Pharmaceutical Contract Manufacturing Market in Germany: Historical Trends (Since 2023) and Forecasted Estimates (Till 2035)
- 27.3.2.2. Pharmaceutical Contract Manufacturing Market in France: Historical Trends (Since 2023) and Forecasted Estimates (Till 2035)
- 27.3.2.3. Pharmaceutical Contract Manufacturing Market in the UK: Historical Trends (Since 2023) and Forecasted Estimates (Till 2035)
- 27.3.2.4. Pharmaceutical Contract Manufacturing Market in Italy: Historical Trends (Since 2023) and Forecasted Estimates (Till 2035)
- 27.3.2.5. Pharmaceutical Contract Manufacturing Market in Spain: Historical Trends (Since 2023) and Forecasted Estimates (Till 2035)
- 27.3.2.6. Pharmaceutical Contract Manufacturing Market in rest of the Europe: Historical Trends (Since 2023) and Forecasted Estimates (Till 2035)
- 27.3.3. Pharmaceutical Contract Manufacturing Market in Asia-Pacific: Historical Trends (Since 2023) and Forecasted Estimates (Till 2035)
- 27.3.3.1. Pharmaceutical Contract Manufacturing Market in China: Historical Trends (Since 2023) and Forecasted Estimates (Till 2035)
- 27.3.3.2. Pharmaceutical Contract Manufacturing Market in Japan: Historical Trends (Since 2023) and Forecasted Estimates (Till 2035)
- 27.3.3.3. Pharmaceutical Contract Manufacturing Market in India: Historical Trends (Since 2023) and Forecasted Estimates (Till 2035)
- 27.3.3.4. Pharmaceutical Contract Manufacturing Market in South Korea: Historical Trends (Since 2023) and Forecasted Estimates (Till 2035)
- 27.3.3.5. Pharmaceutical Contract Manufacturing Market in Australia: Historical Trends (Since 2023) and Forecasted Estimates (Till 2035)
- 27.3.3.6. Pharmaceutical Contract Manufacturing Market in rest of the Asia-Pacific: Historical Trends (Since 2023) and Forecasted Estimates (Till 2035)
- 27.3.4. Pharmaceutical Contract Manufacturing Market in Latin America
- 27.3.4.1. Pharmaceutical Contract Manufacturing Market in Brazil: Historical Trends (Since 2023) and Forecasted Estimates (Till 2035)
- 27.3.4.2. Pharmaceutical Contract Manufacturing Market in Argentina: Historical Trends (Since 2023) and Forecasted Estimates (Till 2035)
- 27.3.4.3. Pharmaceutical Contract Manufacturing Market in rest of the Latin America: Historical Trends (Since 2023) and Forecasted Estimates (Till 2035)
- 27.3.5. Pharmaceutical Contract Manufacturing Market in Middle East and North Africa
- 27.3.5.1. Pharmaceutical Contract Manufacturing Market in Saudi Arabia: Historical Trends (Since 2023) and Forecasted Estimates (Till 2035)
- 27.3.5.2. Pharmaceutical Contract Manufacturing Market in Egypt: Historical Trends (Since 2023) and Forecasted Estimates (Till 2035)
- 27.3.5.3. Pharmaceutical Contract Manufacturing Market in rest of the Middle East and North Africa: Historical Trends (Since 2023) and Forecasted Estimates (Till 2035)
- 27.3.1. Pharmaceutical Contract Manufacturing Market in North America: Historical Trends (Since 2023) and Forecasted Estimates (Till 2035)
- 27.4. Market Dynamics Assessment
- 27.4.1. Market Movement Analysis
- 27.4.2. Penetration Growth (P-G) Matrix
- 27.5. Data Triangulation and Validation
28. PHARMACEUTICAL CONTRACT MANUFACTURING MARKET: NORTH AMERICA
- 28.1. Pharmaceutical Contract Manufacturing Market in North America: Distribution by Type of Product Manufactured
- 28.1.1. Pharmaceutical Contract Manufacturing Market in North America for API and Intermediates: Historical Trends (Since 2023) and Forecasted Estimates (Till 2035)
- 28.1.2. Pharmaceutical Contract Manufacturing Market in North America for FDFs: Historical Trends (Since 2023) and Forecasted Estimates (Till 2035)
- 28.2. Pharmaceutical Contract Manufacturing Market in North America: Distribution by Type of API
- 28.2.1. Pharmaceutical Contract Manufacturing Market in North America for Generic APIs: Historical Trends (Since 2023) and Forecasted Estimates (Till 2035)
- 28.2.2. Pharmaceutical Contract Manufacturing Market in North America for Innovator APIs: Historical Trends (Since 2023) and Forecasted Estimates (Till 2035)
- 28.3. Pharmaceutical Contract Manufacturing Market in North America: Distribution by Potency of API
- 28.3.1. Pharmaceutical Contract Manufacturing Market in North America for Low Potent APIs: Historical Trends (Since 2023) and Forecasted Estimates (Till 2035)
- 28.3.2. Pharmaceutical Contract Manufacturing Market in North America for High Potent APIs: Historical Trends (Since 2023) and Forecasted Estimates (Till 2035)
- 28.4. Pharmaceutical Contract Manufacturing Market in North America: Distribution by Type of FDF
- 28.4.1. Pharmaceutical Contract Manufacturing Market in North America for Generic FDFs: Historical Trends (Since 2023) and Forecasted Estimates (Till 2035)
- 28.4.2. Pharmaceutical Contract Manufacturing Market in North America for Innovator FDFs: Historical Trends (Since 2023) and Forecasted Estimates (Till 2035)
- 28.5. Pharmaceutical Contract Manufacturing Market in North America: Distribution by Dosage Form
- 28.5.1. Pharmaceutical Contract Manufacturing Market in North America for Oral Solids: Historical Trends (Since 2023) and Forecasted Estimates (Till 2035)
- 28.5.2. Pharmaceutical Contract Manufacturing Market in North America for Liquids: Historical Trends (Since 2023) and Forecasted Estimates (Till 2035)
- 28.5.3. Pharmaceutical Contract Manufacturing Market in North America for Emulsions: Historical Trends (Since 2023) and Forecasted Estimates (Till 2035)
- 28.5.4. Pharmaceutical Contract Manufacturing Market in North America for Other Dosage Forms: Historical Trends (Since 2023) and Forecasted Estimates (Till 2035)
- 28.6. Pharmaceutical Contract Manufacturing Market in North America: Distribution by Oral Solids
- 28.6.1. Pharmaceutical Contract Manufacturing Market in North America for Tablets: Historical Trends (Since 2023) and Forecasted Estimates (Till 2035)
- 28.6.2. Pharmaceutical Contract Manufacturing Market in North America for Capsules: Historical Trends (Since 2023) and Forecasted Estimates (Till 2035)
- 28.6.3. Pharmaceutical Contract Manufacturing Market in North America for Emulsions: Historical Trends (Since 2023) and Forecasted Estimates (Till 2035)
- 28.7. Pharmaceutical Contract Manufacturing Market in North America: Distribution by Type of Packaging Offered
- 28.7.1. Pharmaceutical Contract Manufacturing Market in North America for Bottles: Historical Trends (Since 2023) and Forecasted Estimates (Till 2035)
- 28.7.2. Pharmaceutical Contract Manufacturing Market in North America for Blisters: Historical Trends (Since 2023) and Forecasted Estimates (Till 2035)
- 28.7.3. Pharmaceutical Contract Manufacturing Market in North America for Parenterals: Historical Trends (Since 2023) and Forecasted Estimates (Till 2035)
- 28.7.4. Pharmaceutical Contract Manufacturing Market in North America for Oral Liquid Bottles: Historical Trends (Since 2023) and Forecasted Estimates (Till 2035)
- 28.7.5. Pharmaceutical Contract Manufacturing Market in North America for Others: Historical Trends (Since 2023) and Forecasted Estimates (Till 2035)
- 28.8. Pharmaceutical Contract Manufacturing Market in North America: Distribution by End-user
- 28.8.1. Pharmaceutical Contract Manufacturing Market in North America for Small Companies: Historical Trends (Since 2023) and Forecasted Estimates (Till 2035)
- 28.8.2. Pharmaceutical Contract Manufacturing Market in North America for Mid-sized Companies: Historical Trends (Since 2023) and Forecasted Estimates (Till 2035)
- 28.8.3. Pharmaceutical Contract Manufacturing Market in North America for Large and Very Large Companies: Historical Trends (Since 2023) and Forecasted Estimates (Till 2035)
- 28.9. Pharmaceutical Contract Manufacturing Market in North America: Distribution by Scale of Operation
- 28.9.1. Pharmaceutical Contract Manufacturing Market in North America for Clinical Scale: Historical Trends (Since 2023) and Forecasted Estimates (Till 2035)
- 28.9.2. Pharmaceutical Contract Manufacturing Market in North America for Commercial Scale: Historical Trends (Since 2023) and Forecasted Estimates (Till 2035)
29. PHARMACEUTICAL CONTRACT MANUFACTURING MARKET: EUROPE
- 29.1. Pharmaceutical Contract Manufacturing Market in Europe: Distribution by Type of Product Manufactured
- 29.1.1. Pharmaceutical Contract Manufacturing Market in Europe for API and Intermediates: Historical Trends (Since 2023) and Forecasted Estimates (Till 2035)
- 29.1.2. Pharmaceutical Contract Manufacturing Market in Europe for FDFs: Historical Trends (Since 2023) and Forecasted Estimates (Till 2035)
- 29.2. Pharmaceutical Contract Manufacturing Market in Europe: Distribution by Type of API
- 29.2.1. Pharmaceutical Contract Manufacturing Market in Europe for Generic APIs: Historical Trends (Since 2023) and Forecasted Estimates (Till 2035)
- 29.2.2. Pharmaceutical Contract Manufacturing Market in Europe for Innovator APIs: Historical Trends (Since 2023) and Forecasted Estimates (Till 2035)
- 29.3. Pharmaceutical Contract Manufacturing Market in Europe: Distribution by Potency of API
- 29.3.1. Pharmaceutical Contract Manufacturing Market in Europe for Low Potent APIs: Historical Trends (Since 2023) and Forecasted Estimates (Till 2035)
- 29.3.2. Pharmaceutical Contract Manufacturing Market in Europe for High Potent APIs: Historical Trends (Since 2023) and Forecasted Estimates (Till 2035)
- 29.4. Pharmaceutical Contract Manufacturing Market in Europe: Distribution by Type of FDF
- 29.4.1. Pharmaceutical Contract Manufacturing Market in Europe for Generic FDFs: Historical Trends (Since 2023) and Forecasted Estimates (Till 2035)
- 29.4.2. Pharmaceutical Contract Manufacturing Market in Europe for Innovator FDFs: Historical Trends (Since 2023) and Forecasted Estimates (Till 2035)
- 29.5. Pharmaceutical Contract Manufacturing Market in Europe: Distribution by Dosage Form
- 29.5.1. Pharmaceutical Contract Manufacturing Market in Europe for Oral Solids: Historical Trends (Since 2023) and Forecasted Estimates (Till 2035)
- 29.5.2. Pharmaceutical Contract Manufacturing Market in Europe for Liquids: Historical Trends (Since 2023) and Forecasted Estimates (Till 2035)
- 29.5.3. Pharmaceutical Contract Manufacturing Market in Europe for Emulsions: Historical Trends (Since 2023) and Forecasted Estimates (Till 2035)
- 29.5.4. Pharmaceutical Contract Manufacturing Market in Europe for Other Dosage Forms: Historical Trends (Since 2023) and Forecasted Estimates (Till 2035)
- 29.6. Pharmaceutical Contract Manufacturing Market in Europe: Distribution by Oral Solids
- 29.6.1. Pharmaceutical Contract Manufacturing Market in Europe for Tablets: Historical Trends (Since 2023) and Forecasted Estimates (Till 2035)
- 29.6.2. Pharmaceutical Contract Manufacturing Market in Europe for Capsules: Historical Trends (Since 2023) and Forecasted Estimates (Till 2035)
- 29.6.3. Pharmaceutical Contract Manufacturing Market in Europe for Emulsions: Historical Trends (Since 2023) and Forecasted Estimates (Till 2035)
- 29.7. Pharmaceutical Contract Manufacturing Market in Europe: Distribution by Type of Packaging Offered
- 29.7.1. Pharmaceutical Contract Manufacturing Market in Europe for Bottles: Historical Trends (Since 2023) and Forecasted Estimates (Till 2035)
- 29.7.2. Pharmaceutical Contract Manufacturing Market in Europe for Blisters: Historical Trends (Since 2023) and Forecasted Estimates (Till 2035)
- 29.7.3. Pharmaceutical Contract Manufacturing Market in Europe for Parenterals: Historical Trends (Since 2023) and Forecasted Estimates (Till 2035)
- 29.7.4. Pharmaceutical Contract Manufacturing Market in Europe for Oral Liquid Bottles: Historical Trends (Since 2023) and Forecasted Estimates (Till 2035)
- 29.7.5. Pharmaceutical Contract Manufacturing Market in Europe for Others: Historical Trends (Since 2023) and Forecasted Estimates (Till 2035)
- 29.8. Pharmaceutical Contract Manufacturing Market in Europe: Distribution by End-user
- 29.8.1. Pharmaceutical Contract Manufacturing Market in Europe for Small Companies: Historical Trends (Since 2023) and Forecasted Estimates (Till 2035)
- 29.8.2. Pharmaceutical Contract Manufacturing Market in Europe for Mid-sized Companies: Historical Trends (Since 2023) and Forecasted Estimates (Till 2035)
- 29.8.3. Pharmaceutical Contract Manufacturing Market in Europe for Large and Very Large Companies: Historical Trends (Since 2023) and Forecasted Estimates (Till 2035)
- 29.9. Pharmaceutical Contract Manufacturing Market in Europe: Distribution by Scale of Operation
- 29.9.1. Pharmaceutical Contract Manufacturing Market in Europe for Clinical Scale: Historical Trends (Since 2023) and Forecasted Estimates (Till 2035)
- 29.9.2. Pharmaceutical Contract Manufacturing Market in Europe for Commercial Scale: Historical Trends (Since 2023) and Forecasted Estimates (Till 2035)
30. PHARMACEUTICAL CONTRACT MANUFACTURING MARKET: ASIA-PACIIFC
- 30.1. Pharmaceutical Contract Manufacturing Market in Asia-Pacific: Distribution by Type of Product Manufactured
- 30.1.1. Pharmaceutical Contract Manufacturing Market in Asia-Pacific for API and Intermediates: Historical Trends (Since 2023) and Forecasted Estimates (Till 2035)
- 30.1.2. Pharmaceutical Contract Manufacturing Market in Asia-Pacific for FDFs: Historical Trends (Since 2023) and Forecasted Estimates (Till 2035)
- 30.2. Pharmaceutical Contract Manufacturing Market in Asia-Pacific: Distribution by Type of API
- 30.2.1. Pharmaceutical Contract Manufacturing Market in Asia-Pacific for Generic APIs: Historical Trends (Since 2023) and Forecasted Estimates (Till 2035)
- 30.2.2. Pharmaceutical Contract Manufacturing Market in Asia-Pacific for Innovator APIs: Historical Trends (Since 2023) and Forecasted Estimates (Till 2035)
- 30.3. Pharmaceutical Contract Manufacturing Market in Asia-Pacific: Distribution by Potency of API
- 30.3.1. Pharmaceutical Contract Manufacturing Market in Asia-Pacific for Low Potent APIs: Historical Trends (Since 2023) and Forecasted Estimates (Till 2035)
- 30.3.2. Pharmaceutical Contract Manufacturing Market in Asia-Pacific for High Potent APIs: Historical Trends (Since 2023) and Forecasted Estimates (Till 2035)
- 30.4. Pharmaceutical Contract Manufacturing Market in Asia-Pacific: Distribution by Type of FDF
- 30.4.1. Pharmaceutical Contract Manufacturing Market in Asia-Pacific for Generic FDFs: Historical Trends (Since 2023) and Forecasted Estimates (Till 2035)
- 30.4.2. Pharmaceutical Contract Manufacturing Market in Asia-Pacific for Innovator FDFs: Historical Trends (Since 2023) and Forecasted Estimates (Till 2035)
- 30.5. Pharmaceutical Contract Manufacturing Market in Asia-Pacific: Distribution by Dosage Form
- 30.5.1. Pharmaceutical Contract Manufacturing Market in Asia-Pacific for Oral Solids: Historical Trends (Since 2023) and Forecasted Estimates (Till 2035)
- 30.5.2. Pharmaceutical Contract Manufacturing Market in Asia-Pacific for Liquids: Historical Trends (Since 2023) and Forecasted Estimates (Till 2035)
- 30.5.3. Pharmaceutical Contract Manufacturing Market in Asia-Pacific for Emulsions: Historical Trends (Since 2023) and Forecasted Estimates (Till 2035)
- 30.5.4. Pharmaceutical Contract Manufacturing Market in Asia-Pacific for Other Dosage Forms: Historical Trends (Since 2023) and Forecasted Estimates (Till 2035)
- 30.6. Pharmaceutical Contract Manufacturing Market in Asia-Pacific: Distribution by Oral Solids
- 30.6.1. Pharmaceutical Contract Manufacturing Market in Asia-Pacific for Tablets: Historical Trends (Since 2023) and Forecasted Estimates (Till 2035)
- 30.6.2. Pharmaceutical Contract Manufacturing Market in Asia-Pacific for Capsules: Historical Trends (Since 2023) and Forecasted Estimates (Till 2035)
- 30.6.3. Pharmaceutical Contract Manufacturing Market in Asia-Pacific for Emulsions: Historical Trends (Since 2023) and Forecasted Estimates (Till 2035)
- 30.7. Pharmaceutical Contract Manufacturing Market in Asia-Pacific: Distribution by Type of Packaging Offered
- 30.7.1. Pharmaceutical Contract Manufacturing Market in Asia-Pacific for Bottles: Historical Trends (Since 2023) and Forecasted Estimates (Till 2035)
- 30.7.2. Pharmaceutical Contract Manufacturing Market in Asia-Pacific for Blisters: Historical Trends (Since 2023) and Forecasted Estimates (Till 2035)
- 30.7.3. Pharmaceutical Contract Manufacturing Market in Asia-Pacific for Parenterals: Historical Trends (Since 2023) and Forecasted Estimates (Till 2035)
- 30.7.4. Pharmaceutical Contract Manufacturing Market in Asia-Pacific for Oral Liquid Bottles: Historical Trends (Since 2023) and Forecasted Estimates (Till 2035)
- 30.7.5. Pharmaceutical Contract Manufacturing Market in Asia-Pacific for Others: Historical Trends (Since 2023) and Forecasted Estimates (Till 2035)
- 30.8. Pharmaceutical Contract Manufacturing Market in Asia-Pacific: Distribution by End-user
- 30.8.1. Pharmaceutical Contract Manufacturing Market in Asia-Pacific for Small Companies: Historical Trends (Since 2023) and Forecasted Estimates (Till 2035)
- 30.8.2. Pharmaceutical Contract Manufacturing Market in Asia-Pacific for Mid-sized Companies: Historical Trends (Since 2023) and Forecasted Estimates (Till 2035)
- 30.8.3. Pharmaceutical Contract Manufacturing Market in Asia-Pacific for Large and Very Large Companies: Historical Trends (Since 2023) and Forecasted Estimates (Till 2035)
- 30.9. Pharmaceutical Contract Manufacturing Market in Asia-Pacific: Distribution by Scale of Operation
- 30.9.1. Pharmaceutical Contract Manufacturing Market in Asia-Pacific for Clinical Scale: Historical Trends (Since 2023) and Forecasted Estimates (Till 2035)
- 30.9.2. Pharmaceutical Contract Manufacturing Market in Asia-Pacific for Commercial Scale: Historical Trends (Since 2023) and Forecasted Estimates (Till 2035)
31. PHARMACEUTICAL CONTRACT MANUFACTURING MARKET: REST OF THE WORLD
- 31.1. Pharmaceutical Contract Manufacturing Market in Rest of the World: Distribution by Type of Product Manufactured
- 31.1.1. Pharmaceutical Contract Manufacturing Market in Rest of the World for API and Intermediates: Historical Trends (Since 2023) and Forecasted Estimates (Till 2035)
- 31.1.2. Pharmaceutical Contract Manufacturing Market in Rest of the World for FDFs: Historical Trends (Since 2023) and Forecasted Estimates (Till 2035)
- 31.2. Pharmaceutical Contract Manufacturing Market in Rest of the World: Distribution by Type of API
- 31.2.1. Pharmaceutical Contract Manufacturing Market in Rest of the World for Generic APIs: Historical Trends (Since 2023) and Forecasted Estimates (Till 2035)
- 31.2.2. Pharmaceutical Contract Manufacturing Market in Rest of the World for Innovator APIs: Historical Trends (Since 2023) and Forecasted Estimates (Till 2035)
- 31.3. Pharmaceutical Contract Manufacturing Market in Rest of the World: Distribution by Potency of API
- 31.3.1. Pharmaceutical Contract Manufacturing Market in Rest of the World for Low Potent APIs: Historical Trends (Since 2023) and Forecasted Estimates (Till 2035)
- 31.3.2. Pharmaceutical Contract Manufacturing Market in Rest of the World for High Potent APIs: Historical Trends (Since 2023) and Forecasted Estimates (Till 2035)
- 31.4. Pharmaceutical Contract Manufacturing Market in Rest of the World: Distribution by Type of FDF
- 31.4.1. Pharmaceutical Contract Manufacturing Market in Rest of the World for Generic FDFs: Historical Trends (Since 2023) and Forecasted Estimates (Till 2035)
- 31.4.2. Pharmaceutical Contract Manufacturing Market in Rest of the World for Innovator FDFs: Historical Trends (Since 2023) and Forecasted Estimates (Till 2035)
- 31.5. Pharmaceutical Contract Manufacturing Market in Rest of the World: Distribution by Dosage Form
- 31.5.1. Pharmaceutical Contract Manufacturing Market in Rest of the World for Oral Solids: Historical Trends (Since 2023) and Forecasted Estimates (Till 2035)
- 31.5.2. Pharmaceutical Contract Manufacturing Market in Rest of the World for Liquids: Historical Trends (Since 2023) and Forecasted Estimates (Till 2035)
- 31.5.3. Pharmaceutical Contract Manufacturing Market in Rest of the World for Emulsions: Historical Trends (Since 2023) and Forecasted Estimates (Till 2035)
- 31.5.4. Pharmaceutical Contract Manufacturing Market in Rest of the World for Other Dosage Forms: Historical Trends (Since 2023) and Forecasted Estimates (Till 2035)
- 31.6. Pharmaceutical Contract Manufacturing Market in Rest of the World: Distribution by Oral Solids
- 31.6.1. Pharmaceutical Contract Manufacturing Market in Rest of the World for Tablets: Historical Trends (Since 2023) and Forecasted Estimates (Till 2035)
- 31.6.2. Pharmaceutical Contract Manufacturing Market in Rest of the World for Capsules: Historical Trends (Since 2023) and Forecasted Estimates (Till 2035)
- 31.6.3. Pharmaceutical Contract Manufacturing Market in Rest of the World for Emulsions: Historical Trends (Since 2023) and Forecasted Estimates (Till 2035)
- 31.7. Pharmaceutical Contract Manufacturing Market in Rest of the World: Distribution by Type of Packaging Offered
- 31.7.1. Pharmaceutical Contract Manufacturing Market in Rest of the World for Bottles: Historical Trends (Since 2023) and Forecasted Estimates (Till 2035)
- 31.7.2. Pharmaceutical Contract Manufacturing Market in Rest of the World for Blisters: Historical Trends (Since 2023) and Forecasted Estimates (Till 2035)
- 31.7.3. Pharmaceutical Contract Manufacturing Market in Rest of the World for Parenterals: Historical Trends (Since 2023) and Forecasted Estimates (Till 2035)
- 31.7.4. Pharmaceutical Contract Manufacturing Market in Rest of the World for Oral Liquid Bottles: Historical Trends (Since 2023) and Forecasted Estimates (Till 2035)
- 31.7.5. Pharmaceutical Contract Manufacturing Market in Rest of the World for Others: Historical Trends (Since 2023) and Forecasted Estimates (Till 2035)
- 31.8. Pharmaceutical Contract Manufacturing Market in Rest of the World: Distribution by End-user
- 31.8.1. Pharmaceutical Contract Manufacturing Market in Rest of the World for Small Companies: Historical Trends (Since 2023) and Forecasted Estimates (Till 2035)
- 31.8.2. Pharmaceutical Contract Manufacturing Market in Rest of the World for Mid-sized Companies: Historical Trends (Since 2023) and Forecasted Estimates (Till 2035)
- 31.8.3. Pharmaceutical Contract Manufacturing Market in Rest of the World for Large and Very Large Companies: Historical Trends (Since 2023) and Forecasted Estimates (Till 2035)
- 31.9. Pharmaceutical Contract Manufacturing Market in Rest of the World: Distribution by Scale of Operation
- 31.9.1. Pharmaceutical Contract Manufacturing Market in Rest of the World for Clinical Scale: Historical Trends (Since 2023) and Forecasted Estimates (Till 2035)
- 31.9.2. Pharmaceutical Contract Manufacturing Market in Rest of the World for Commercial Scale: Historical Trends (Since 2023) and Forecasted Estimates (Till 2035)
- *Detailed information on Chapters 28-31 is available in the Excel Data Packs shared along with the report**
32. PHARMACEUTICAL CONTRACT MANUFACTURING MARKET, BY LEADING PLAYERS
- 32.1. Chapter Overview
- 32.2. Key Assumptions and Methodology
- 32.3. Pharmaceutical Contract Manufacturing Market by Leading Players
- 32.4. Data Triangulation and Validation
33. CASE STUDY: COMPARISON OF SMALL AND LARGE MOLECULES DRUGS / THERAPIES
- 33.1. Chapter Overview
- 33.2. Overview of Small Molecule and Large Molecule Drugs / Therapies
- 33.2.1. Comparison of General Characteristics
- 33.2.2. Comparison of Key Specifications
- 33.2.3. Comparison of Manufacturing Processes
- 33.2.4. Comparison of Key Manufacturing-related Challenges
34. CONCLUDING INSIGHTS
35. EXECUTIVE INSIGHTS
36. APPENDIX I: TABULATED DATA
37. APPENDIX II: LIST OF COMPANIES AND ORGANIZATIONS
List of Tables
- Table 7.1 FDA Quality Agreement versus EMA cGMP Regulations: A Comparative Analysis
- Table 7.2 Pharmaceutical CMOs: Information on Approval from Various Regulatory Authorities
- Table 7.3 Key Regulatory Authorities: Comparison of NDA Approval Characteristics
- Table 8.1 List of Pharmaceutical Contract Manufacturing Organizations: Information on Year of Establishment, Company Size, Location of Headquarters
- Table 8.2 Pharmaceutical Contract Manufacturing Organizations: Information on Type of Offering, Type of Pharmaceutical Product Manufactured and Scale of Operation
- Table 8.3 Pharmaceutical Contract Manufacturing Organizations: Information on Type of Service Offered
- Table 8.4 Pharmaceutical Contract Manufacturing Organizations: Information on Type of Finished Dosage Form Manufactured
- Table 8.5 Pharmaceutical Contract Manufacturing Organizations: Information on Type of Packaging Offered
- Table 9.1 Pharmaceutical Contract Manufacturing: List of Companies Profiled
- Table 9.2 Albemarle: Company Overview
- Table 9.3 Albemarle: Service Portfolio
- Table 9.4 Bausch Health Sciences: Company Overview
- Table 9.5 Bausch Health Sciences: Service Portfolio
- Table 9.6 Bausch Health Sciences: Recent Developments and Future Outlook
- Table 9.7 Catalent: Company Overview
- Table 9.8 Catalent: Service Portfolio
- Table 9.9 Catalent: Recent Developments and Future Outlook
- Table 9.10 Patheon: Company Overview
- Table 9.11 Patheon: Service Portfolio
- Table 9.12 Thermo Fischer Scientific (Parent Company of Patheon): Recent Developments and Future Outlook
- Table 9.13 PiSA Farmaceutica: Company Overview
- Table 9.14 PiSA Farmaceutica: Service Portfolio
- Table 9.15 West Pharmaceutical Services: Company Overview
- Table 9.16 West Pharmaceutical Services: Service Portfolio
- Table 9.17 West Pharmaceutical Services: Recent Developments and Future Outlook
- Table 9.18 Delpharm: Company Overview
- Table 9.19 Delpharm: Service Portfolio
- Table 9.20 Eurofins Scientific: Company Overview
- Table 9.21 Eurofins Scientific: Service Portfolio
- Table 9.22 Eurofins Scientific: Recent Developments and Future Outlook
- Table 9.23 Evonik Industries: Company Overview
- Table 9.24 Evonik Industries: Service Portfolio
- Table 9.25 Evonik Industries: Recent Developments and Future Outlook
- Table 9.26 Fareva: Company Overview
- Table 9.27 Fareva: Service Portfolio
- Table 9.28 Fareva: Recent Developments and Future Outlook
- Table 9.29 Fresenius Kabi: Company Overview
- Table 9.30 Fresenius Kabi: Service Portfolio
- Table 9.31 Fresenius Kabi: Recent Developments and Future Outlook
- Table 9.32 Lonza: Company Overview
- Table 9.33 Lonza: Service Portfolio
- Table 9.34 Lonza: Recent Developments and Future Outlook
- Table 9.35 Recipharm: Company Overview
- Table 9.36 Recipharm: Service Portfolio
- Table 9.37 Recipharm: Recent Developments and Future Outlook
- Table 9.38 Sandoz: Company Overview
- Table 9.39 Sandoz: Service Portfolio
- Table 9.40 Sandoz: Recent Developments and Future Outlook
- Table 9.41 Aspen Pharmacare: Company Overview
- Table 9.42 Aspen Pharmacare: Service Portfolio
- Table 9.43 Intas Pharmaceuticals: Company Overview
- Table 9.44 Intas Pharmaceuticals: Service Portfolio
- Table 9.45 Micro Labs: Company Overview
- Table 9.46 Micro Labs: Service Portfolio
- Table 9.47 Nipro Patch: Company Overview
- Table 9.48 Nipro Patch: Service Portfolio
- Table 9.49 WuXi AppTec: Company Overview
- Table 9.50 WuXi AppTec: Service Portfolio
- Table 9.51 WuXi AppTec: Recent Developments and Future Outlook
- Table 9.52 Wockhardt: Company Overview
- Table 9.53 Wockhardt: Service Portfolio
- Table 11.1 Pharmaceutical Contract Manufacturing Organizations: List of Mergers and Acquisitions, Since Q3 2024
- Table 11.2 Mergers and Acquisitions: Information on Key Value Drivers
- Table 12.1 Pharmaceutical Contract Manufacturing: List of Expansions, Since Q3 2024
- Table 12.2 Pharmaceutical Contract Manufacturing Organizations: Type of Pharmaceutical Product Manufactured and Type of Service Offered
- Table 13.1 Pharmaceutical Contract Manufacturing Organizations: Information on Manufacturing Facilities in North America
- Table 13.2 Pharmaceutical Contract Manufacturing Organizations: Information on Manufacturing Facilities in Europe
- Table 13.3 Pharmaceutical Contract Manufacturing Organizations: Information on Manufacturing Facilities in Asia-Pacific
- Table 13.4 Pharmaceutical Contract Manufacturing Organizations: Information on Manufacturing Facilities in Rest of the World
- Table 14.1 Pharmaceutical Contract Manufacturers: Information on Production Capacity (Sample Dataset)
- Table 14.2 Pharmaceutical Contract Manufacturing: Average Production Capacity Based on Company Size (Sample Dataset)
- Table 14.3 Global Pharmaceutical Contract Manufacturing Capacity: Distribution by Company Size (in million units)
- Table 28.1 List of Leading Pharmaceutical Contract Manufacturing Companies
- Table 29.1 Small Molecules and Large Molecules: Strengths and Weaknesses
- Table 29.2 Small Molecules and Large Molecules: Comparison of Key Characteristics
- Table 29.3 Small Molecules and Large Molecules: Comparison of Development Characteristics
- Table 31.1 Ajinomoto Althea: Key Highlights
- Table 31.2 Bachem: Key Highlights
- Table 31.3 CiVentiChem: Key Highlights
- Table 31.4 CordenPharma: Key Highlights
- Table 31.5 Helsinn: Key Highlights
- Table 31.6 Novasep: Key Highlights
- Table 31.7 Sovereign Pharma: Key Highlights
- Table 31.8 Wavelength Pharmaceuticals: Key Highlights
- Table 36.1 Pharmaceutical Contract Manufacturing Organizations: Distribution by Year of Establishment
- Table 36.2 Pharmaceutical Contract Manufacturing Organizations: Distribution by Company Size
- Table 36.3 Pharmaceutical Contract Manufacturing Organizations: Distribution by Location of Headquarters (Region)
- Table 36.4 Pharmaceutical Contract Manufacturing Organizations: Distribution by Location of Headquarters (Country)
- Table 36.5 Pharmaceutical Contract Manufacturing Organizations: Distribution by Location of Manufacturing Facility (Region)
- Table 36.6 Pharmaceutical Contract Manufacturing Organizations: Distribution by Type of Offering
- Table 36.7 Pharmaceutical Contract Manufacturing Organizations: Distribution by Type of Pharmaceutical Product Manufactured
- Table 36.8 Pharmaceutical Contract Manufacturing Organizations: Distribution by Scale of Operation
- Table 36.9 Pharmaceutical Contract Manufacturing Organizations: Distribution by Type of Service Offered
- Table 36.10 Pharmaceutical Contract Manufacturing Organizations: Distribution by Type of Finished Dosage Form Manufactured
- Table 36.11 Pharmaceutical Contract Manufacturing Organizations: Distribution by Type of Packaging Offered
- Table 36.12 Albemarle: Business Segment-wise Financial Details (USD Billion), Since FY 2022
- Table 36.13 Thermo Fischer Scientific (Parent Company of Patheon): Consolidated Financial Details (USD Billion), Since FY 2022
- Table 36.14 West Pharmaceutical Services: Business Segment-wise Financial Details (USD Billion), Since FY 2022
- Table 36.15 Eurofins Scientific: Consolidated Financial Details (EUR Billion), Since FY 2022
- Table 36.16 Evonik Industries: Consolidated Financial Details (EUR Billion), Since FY 2022
- Table 36.17 Fresenius Kabi: Consolidated Financial Details (EUR Billion), Since FY 2022
- Table 36.18 Lonza: Business Segment-wise Financial Details (CHF Billion), Since FY 2022
- Table 36.19 Aspen Pharmacare: Consolidated Financial Details (CER Billion), Since FY 2022
- Table 36.20 WuXi AppTec: Consolidated Financial Details (RMB Billion), Since FY 2022
- Table 36.21 Mergers and Acquisitions: Distribution by Year of Agreement
- Table 36.22 Mergers and Acquisitions: Distribution by Type of Agreement
- Table 36.23 Mergers and Acquisitions: Distribution by Local and International Agreements
- Table 36.24 Mergers and Acquisitions: Distribution by Intracontinental and Intercontinental Agreements
- Table 36.25 Most Active Players: Distribution by Number of Agreements
- Table 36.26 Mergers and Acquisitions: Distribution by Ownership Change Matrix
- Table 36.27 Mergers and Acquisitions: Distribution by Key Value Drivers
- Table 36.28 Recent Expansions: Distribution by Year of Expansion
- Table 36.29 Recent Expansions: Distribution by Status of Expansion
- Table 36.30 Recent Expansions: Distribution by Type of Expansion
- Table 36.31 Recent Expansions: Distribution by Year and Type of Expansion
- Table 36.32 Recent Expansions: Distribution by Location of Facility (Region)
- Table 36.33 Recent Expansions: Distribution by Location of Facility (Country)
- Table 36.34 Recent Expansions: Distribution by Distribution by Type of Expansion and Location of Facility (Region)
- Table 36.35 Recent Expansions: Distribution of Amount Invested by Year of Expansion
- Table 36.36 Recent Expansions: Distribution of Amount Invested by Type of Expansion
- Table 36.37 Recent Expansions: Distribution by Type of Pharmaceutical Product Manufactured
- Table 36.38 Recent Expansions: Distribution by Type of Service Offered
- Table 36.39 Most Active Players: Distribution by Number of Expansions
- Table 36.40 Most Active Players: Distribution by Amount Invested
- Table 36.41 Global Capacity of Pharmaceutical Contract Manufacturers (in million units): Distribution by Range of Installed Capacity
- Table 36.42 Global Capacity of Pharmaceutical Contract Manufacturers (in million units): Distribution by Company Size
- Table 36.43 Global Capacity of Pharmaceutical Contract Manufacturers (in million units): Distribution by Scale of Operation
- Table 36.44 Global Capacity of Pharmaceutical Contract Manufacturers (in million units): Distribution by Location of Manufacturing Facility
- Table 36.45 Pharmaceutical Contract Manufacturing Capacity in North America
- Table 36.46 Pharmaceutical Contract Manufacturing Capacity in Europe
- Table 36.47 Pharmaceutical Contract Manufacturing Capacity in Asia-Pacific
- Table 36.48 Pharmaceutical Contract Manufacturing Capacity in Rest of the World
- Table 36.49 Global Demand for Pharmaceutical Contract Manufacturing, Historical Trends, Since 2020 and Forecasted Estimates, Till 2035 (in Metric Tons)
- Table 36.50 Demand for Pharmaceutical Contract Manufacturing: Distribution by Scale of Operation, Historical Trends, Since 2020 and Forecasted Estimates, Till 2035 (in Metric Tons)
- Table 36.51 Demand for Pharmaceutical Contract Manufacturing: Distribution by Type of API, Historical Trends, Since 2020 and Forecasted Estimates, Till 2035 (in Metric Tons)
- Table 36.52 Demand for Pharmaceutical Contract Manufacturing: Distribution by Potency of API, Historical Trends, Since 2020 and Forecasted Estimates, Till 2035 (in Metric Tons)
- Table 36.53 Demand for Pharmaceutical Contract Manufacturing: Distribution by Geographical Regions, Historical Trends, Since 2020 and Forecasted Estimates, Till 2035 (in Metric Tons)
- Table 36.54 Global Pharmaceutical Contract Manufacturing Market, Historical Trends, Since 2023 and Forecasted Estimates, Till 2035 (USD Billion)
- Table 36.55 Global Pharmaceutical Contract Manufacturing Market, Forecasted Estimates, Till 2035: Conservative Scenario (USD Billion)
- Table 36.56 Global Pharmaceutical Contract Manufacturing Market, Forecasted Estimates, Till 2035: Optimistic Scenario (USD Billion)
- Table 36.57 Pharmaceutical Contract Manufacturing Market: Distribution by Type of Product Manufactured
- Table 36.58 Pharmaceutical Contract Manufacturing Market for API and Intermediates, Historical Trends, Since 2023 and Forecasted Estimates, Till 2035 (USD Billion)
- Table 36.59 Pharmaceutical Contract Manufacturing Market for FDFs, Historical Trends, Since 2023 and Forecasted Estimates, Till 2035 (USD Billion)
- Table 36.60 Pharmaceutical Contract Manufacturing Market: Distribution by Type of API
- Table 36.61 Pharmaceutical Contract Manufacturing Market for Originator APIs, Historical Trends, Since 2023 and Forecasted Estimates, Till 2035 (USD Billion)
- Table 36.62 Pharmaceutical Contract Manufacturing Market for Generic APIs, Historical Trends, Since 2023 and Forecasted Estimates, Till 2035 (USD Billion)
- Table 36.63 Pharmaceutical Contract Manufacturing Market: Distribution by API Potency
- Table 36.64 Pharmaceutical Contract Manufacturing Market for Low Potent APIs, Historical Trends, Since 2023 and Forecasted Estimates, Till 2035 (USD Billion)
- Table 36.65 Pharmaceutical Contract Manufacturing Market for High Potent APIs, Historical Trends, Since 2023 and Forecasted Estimates, Till 2035 (USD Billion)
- Table 36.66 Pharmaceutical Contract Manufacturing Market: Distribution by Type of FDF
- Table 36.67 Pharmaceutical Contract Manufacturing Market for Originator FDFs, Historical Trends, Since 2023 and Forecasted Estimates, Till 2035 (USD Billion)
- Table 36.68 Pharmaceutical Contract Manufacturing Market for Generic FDFs, Historical Trends, Since 2023 and Forecasted Estimates, Till 2035 (USD Billion)
- Table 36.69 Pharmaceutical Contract Manufacturing Market: Distribution by Dosage Form
- Table 36.70 Pharmaceutical Contract Manufacturing Market for Oral Solids, Historical Trends, Since 2023 and Forecasted Estimates, Till 2035 (USD Billion)
- Table 36.71 Pharmaceutical Contract Manufacturing Market for Liquids, Historical Trends, Since 2023 and Forecasted Estimates, Till 2035 (USD Billion)
- Table 36.72 Pharmaceutical Contract Manufacturing Market for Emulsions, Historical Trends, Since 2023 and Forecasted Estimates, Till 2035 (USD Billion)
- Table 36.73 Pharmaceutical Contract Manufacturing Market for Other Dosage Forms, Historical Trends, Since 2023 and Forecasted Estimates, Till 2035 (USD Billion)
- Table 36.74 Pharmaceutical Contract Manufacturing Market: Distribution by Type of Oral Solid
- Table 36.75 Pharmaceutical Contract Manufacturing Market for Tablets, Historical Trends, Since 2023 and Forecasted Estimates, Till 2035 (USD Billion)
- Table 36.76 Pharmaceutical Contract Manufacturing Market for Capsules, Historical Trends, Since 2023 and Forecasted Estimates, Till 2035 (USD Billion)
- Table 36.77 Pharmaceutical Contract Manufacturing Market for Other Oral Solids, Historical Trends, Since 2023 and Forecasted Estimates, Till 2035 (USD Billion)
- Table 36.78 Pharmaceutical Contract Manufacturing Market: Distribution by Type of Packaging Offered
- Table 36.79 Pharmaceutical Contract Manufacturing Market for Bottles, Historical Trends, Since 2023 and Forecasted Estimates, Till 2035 (USD Billion)
- Table 36.80 Pharmaceutical Contract Manufacturing Market for Blister Packs, Historical Trends, Since 2023 and Forecasted Estimates, Till 2035 (USD Billion)
- Table 36.81 Pharmaceutical Contract Manufacturing Market for Oral Liquid Bottles, Historical Trends, Since 2023 and Forecasted Estimates, Till 2035 (USD Billion)
- Table 36.82 Pharmaceutical Contract Manufacturing Market for Vials, Historical Trends, Since 2023 and Forecasted Estimates, Till 2035 (USD Billion)
- Table 36.83 Pharmaceutical Contract Manufacturing Market for Prefilled Syringe, Historical Trends, Since 2023 and Forecasted Estimates, Till 2035 (USD Billion)
- Table 36.84 Pharmaceutical Contract Manufacturing Market for Cartridges, Historical Trends, Since 2023 and Forecasted Estimates, Till 2035 (USD Billion)
- Table 36.85 Pharmaceutical Contract Manufacturing Market for Ampoules, Historical Trends, Since 2023 and Forecasted Estimates, Till 2035 (USD Billion)
- Table 36.86 Pharmaceutical Contract Manufacturing Market for Other Types of Packaging, Historical Trends, Since 2023 and Forecasted Estimates, Till 2035 (USD Billion)
- Table 36.87 Pharmaceutical Contract Manufacturing Market: Distribution by Scale of Operation
- Table 36.88 Pharmaceutical Contract Manufacturing Market for Clinical Scale, Historical Trends, Since 2023 and Forecasted Estimates, Till 2035 (USD Billion)
- Table 36.89 Pharmaceutical Contract Manufacturing Market for Commercial Scale, Historical Trends, Since 2023 and Forecasted Estimates, Till 2035 (USD Billion)
- Table 36.90 Pharmaceutical Contract Manufacturing Market: Distribution by End User
- Table 36.91 Pharmaceutical Contract Manufacturing Market for Small Companies, Historical Trends, Since 2023 and Forecasted Estimates, Till 2035 (USD Billion)
- Table 36.92 Pharmaceutical Contract Manufacturing Market for Mid-sized Companies, Historical Trends, Since 2023 and Forecasted Estimates, Till 2035 (USD Billion)
- Table 36.93 Pharmaceutical Contract Manufacturing Market for Large and Very Large Companies, Historical Trends, Since 2023 and Forecasted Estimates, Till 2035 (USD Billion)
- Table 36.94 Pharmaceutical Contract Manufacturing Market: Distribution by Geographical Region
- Table 36.95 Pharmaceutical Contract Manufacturing Market in North America, Historical Trends, Since 2023 and Forecasted Estimates, Till 2035 (USD Billion)
- Table 36.96 Pharmaceutical Contract Manufacturing Market in the US, Historical Trends (2021-2024) and Forecasted Estimates, Till 2035 (USD Billion)
- Table 36.97 Pharmaceutical Contract Manufacturing Market in Canada, Historical Trends, Since 2023 and Forecasted Estimates, Till 2035 (USD Billion)
- Table 36.98 Pharmaceutical Contract Manufacturing Market in Europe, Historical Trends, Since 2023 and Forecasted Estimates, Till 2035 (USD Billion)
- Table 36.99 Pharmaceutical Contract Manufacturing Market in Germany, Historical Trends, Since 2023 and Forecasted Estimates, Till 2035 (USD Billion)
- Table 36.100 Pharmaceutical Contract Manufacturing Market in France, Historical Trends, Since 2023 and Forecasted Estimates, Till 2035 (USD Billion)
- Table 36.101 Pharmaceutical Contract Manufacturing Market in the UK, Historical Trends, Since 2023 and Forecasted Estimates, Till 2035 (USD Billion)
- Table 36.102 Pharmaceutical Contract Manufacturing Market in Italy, Historical Trends, Since 2023 and Forecasted Estimates, Till 2035 (USD Billion)
- Table 36.103 Pharmaceutical Contract Manufacturing Market in Spain, Historical Trends, Since 2023 and Forecasted Estimates, Till 2035 (USD Billion)
- Table 36.104 Pharmaceutical Contract Manufacturing Market in Rest of the Europe, Historical Trends, Since 2023 and Forecasted Estimates, Till 2035 (USD Billion)
- Table 36.105 Pharmaceutical Contract Manufacturing Market in Asia-Pacific, Historical Trends, Since 2023 and Forecasted Estimates, Till 2035 (USD Billion)
- Table 36.106 Pharmaceutical Contract Manufacturing Market in China, Historical Trends, Since 2023 and Forecasted Estimates, Till 2035 (USD Billion)
- Table 36.107 Pharmaceutical Contract Manufacturing Market in Japan, Historical Trends, Since 2023 and Forecasted Estimates, Till 2035 (USD Billion)
- Table 36.108 Pharmaceutical Contract Manufacturing Market in India, Historical Trends, Since 2023 and Forecasted Estimates, Till 2035 (USD Billion)
- Table 36.109 Pharmaceutical Contract Manufacturing Market in South Korea, Historical Trends, Since 2023 and Forecasted Estimates, Till 2035 (USD Billion)
- Table 36.110 Pharmaceutical Contract Manufacturing Market in Australia, Historical Trends, Since 2023 and Forecasted Estimates, Till 2035 (USD Billion)
- Table 36.111 Pharmaceutical Contract Manufacturing Market in Rest of the Asia-Pacific, Historical Trends, Since 2023 and Forecasted Estimates, Till 2035 (USD Billion)
- Table 36.112 Pharmaceutical Contract Manufacturing Market in Latin America, Historical Trends, Since 2023 and Forecasted Estimates, Till 2035 (USD Billion)
- Table 36.113 Pharmaceutical Contract Manufacturing Market in Brazil, Historical Trends, Since 2023 and Forecasted Estimates, Till 2035 (USD Billion)
- Table 36.114 Pharmaceutical Contract Manufacturing Market in Argentina, Historical Trends, Since 2023 and Forecasted Estimates, Till 2035 (USD Billion)
- Table 36.115 Pharmaceutical Contract Manufacturing Market in Rest of the Latin America, Historical Trends, Since 2023 and Forecasted Estimates, Till 2035 (USD Billion)
- Table 36.116 Pharmaceutical Contract Manufacturing Market in Middle East and North Africa, Historical Trends, Since 2023 and Forecasted Estimates, Till 2035 (USD Billion)
- Table 36.117 Pharmaceutical Contract Manufacturing Market in Saudi Arabia, Historical Trends, Since 2023 and Forecasted Estimates, Till 2035 (USD Billion)
- Table 36.118 Pharmaceutical Contract Manufacturing Market in Egypt, Historical Trends, Since 2023 and Forecasted Estimates, Till 2035 (USD Billion)
- Table 36.119 Pharmaceutical Contract Manufacturing Market in Rest of the Middle East and North Africa, Historical Trends, Since 2023 and Forecasted Estimates, Till 2035 (USD Billion)
- Table 36.120 Pharmaceutical Contract Manufacturing Market: Distribution by Leading Players (USD Billion)
List of Figures
- Figure 2.1 Research Methodology: Project Methodology
- Figure 2.2 Research Methodology: Data Sources for Secondary Research
- Figure 2.3 Research Methodology: Robust Quality Control
- Figure 3.1 Market Dynamics: Forecast Methodology
- Figure 3.2 Market Dynamics: Market Assessment Framework
- Figure 4.1 Lessons Learnt from Past Recessions
- Figure 5.1 Executive Summary: Market Landscape
- Figure 5.2 Executive Summary: Market Trends
- Figure 5.3 Executive Summary: Market Forecast and Opportunity Analysis
- Figure 6.1 Type of Third-party Manufacturers
- Figure 6.2 Outsourcing Opportunities in Pharmaceutical Value Chain
- Figure 6.3 Services Offered by Contract Manufacturing Organizations
- Figure 6.4 Key Considerations while Selecting a Contract Manufacturing Organization
- Figure 7.1 Key Regulatory Requirements for CMOs and CROs in India
- Figure 7.2 Regulatory Landscape for Pharmaceutical CMOs: Distribution by Type of Regulatory Authority
- Figure 7.3 Bubble Analysis: Regional Regulatory Summary
- Figure 8.1 Pharmaceutical Contract Manufacturing Organizations: Distribution by Year of Establishment
- Figure 8.2 Pharmaceutical Contract Manufacturing Organizations: Distribution by Company Size
- Figure 8.3 Pharmaceutical Contract Manufacturing Organizations: Distribution by Location of Headquarters (Region)
- Figure 8.4 Pharmaceutical Contract Manufacturing Organizations: Distribution by Location of Headquarters (Country)
- Figure 8.5 Pharmaceutical Contract Manufacturing Organizations: Distribution by Location of Manufacturing Facility (Region)
- Figure 8.6 Pharmaceutical Contract Manufacturing Organizations: Distribution by Type of Offering
- Figure 8.7 Pharmaceutical Contract Manufacturing Organizations: Distribution by Type of Pharmaceutical Product Manufactured
- Figure 8.8 Pharmaceutical Contract Manufacturing Organizations: Distribution by Scale of Operation
- Figure 8.9 Pharmaceutical Contract Manufacturing Organizations: Distribution by Type of Service Offered
- Figure 8.10 Pharmaceutical Contract Manufacturing Organizations: Distribution by Type of Finished Dosage Form Manufactured
- Figure 8.11 Pharmaceutical Contract Manufacturing Organizations: Distribution by Type of Packaging Offered
- Figure 9.1 Albemarle: Business Segment-wise Financial Details (USD Billion), Since FY 2022
- Figure 9.2 Thermo Fischer Scientific (Parent Company of Patheon): Consolidated Financial Details (USD Billion), Since FY 2022
- Figure 9.3 West Pharmaceutical Services: Business Segment-wise Financial Details (USD Billion), Since FY 2022
- Figure 9.4 Eurofins Scientific: Consolidated Financial Details (EUR Billion), Since FY 2022
- Figure 9.5 Evonik Industries: Consolidated Financial Details (EUR Billion), Since FY 2022
- Figure 9.6 Fresenius Kabi: Consolidated Financial Details (EUR Billion), Since FY 2022
- Figure 9.7 Lonza: Business Segment-wise Financial Details (CHF Billion), Since FY 2022
- Figure 9.8 Aspen Pharmacare: Consolidated Financial Details (CER Billion), Since FY 2022
- Figure 9.9 WuXi AppTec: Consolidated Financial Details (RMB Billion), Since FY 2022
- Figure 10.1 Make versus Buy Decision Making Framework
- Figure 10.2 Make versus Buy Decision Making: Possible Scenario Descriptions
- Figure 11.1 Mergers and Acquisitions: Distribution by Year of Agreement
- Figure 11.2 Mergers and Acquisitions: Distribution by Type of Agreement
- Figure 11.3 Mergers and Acquisitions: Distribution by Local and International Agreements
- Figure 11.4 Mergers and Acquisitions: Distribution by Intracontinental and Intercontinental Agreements
- Figure 11.5 Most Active Players: Distribution by Number of Agreements
- Figure 11.6 Mergers and Acquisitions: Distribution by Ownership Change Matrix
- Figure 11.7 Mergers and Acquisitions: Distribution by Key Value Drivers
- Figure 12.1 Recent Expansions: Distribution by Year of Expansion
- Figure 12.2 Recent Expansions: Distribution by Status of Expansion
- Figure 12.3 Recent Expansions: Distribution by Type of Expansion
- Figure 12.4 Recent Expansions: Distribution by Year and Type of Expansion
- Figure 12.5 Recent Expansions: Distribution by Location of Facility (Region)
- Figure 12.6 Recent Expansions: Distribution by Location of Facility (Country)
- Figure 12.7 Recent Expansions: Distribution by Distribution by Type of Expansion and Location of Facility (Region)
- Figure 12.8 Recent Expansions: Distribution of Amount Invested by Year of Expansion
- Figure 12.9 Recent Expansions: Distribution of Amount Invested by Type of Expansion
- Figure 12.10 Recent Expansions: Distribution by Type of Pharmaceutical Product Manufactured
- Figure 12.11 Recent Expansions: Distribution by Type of Service Offered
- Figure 12.12 Most Active Players: Distribution by Number of Expansions
- Figure 12.13 Most Active Players: Distribution by Amount Invested
- Figure 13.1 Pharmaceutical Contract Manufacturing Organizations: Distribution by Location of Manufacturing Facilities
- Figure 13.2 Pharmaceutical Contract Manufacturing Facilities: North America Scenario
- Figure 13.3 Pharmaceutical Contract Manufacturing Facilities: Europe Scenario
- Figure 13.4 Pharmaceutical Contract Manufacturing Facilities: Asia-Pacific Scenario
- Figure 13.5 Pharmaceutical Contract Manufacturing Facilities: Rest of the World Scenario
- Figure 14.1 Global Capacity of Pharmaceutical Contract Manufacturers (in million units): Distribution by Range of Installed Capacity
- Figure 14.2 Global Capacity of Pharmaceutical Contract Manufacturers (in million units): Distribution by Company Size
- Figure 14.3 Global Capacity of Pharmaceutical Contract Manufacturers (in million units): Distribution by Scale of Operation
- Figure 14.4 Global Capacity of Pharmaceutical Contract Manufacturers (in million units): Distribution by Location of Manufacturing Facility
- Figure 14.5 Pharmaceutical Contract Manufacturing Capacity in North America
- Figure 14.6 Pharmaceutical Contract Manufacturing Capacity in Europe
- Figure 14.7 Pharmaceutical Contract Manufacturing Capacity in Asia-Pacific
- Figure 14.8 Pharmaceutical Contract Manufacturing Capacity in Rest of the World
- Figure 15.1 Global Demand for Pharmaceutical Contract Manufacturing, Historical Trends, Since 2020 and Forecasted Estimates, Till 2035 (in Metric Tons)
- Figure 15.2 Demand for Pharmaceutical Contract Manufacturing: Distribution by Scale of Operation, Historical Trends, Since 2020 and Forecasted Estimates, Till 2035 (in Metric Tons)
- Figure 15.3 Demand for Pharmaceutical Contract Manufacturing: Distribution by Type of API, Historical Trends, Since 2020 and Forecasted Estimates, Till 2035 (in Metric Tons)
- Figure 15.4 Demand for Pharmaceutical Contract Manufacturing: Distribution by Potency of API, Historical Trends, Since 2020 and Forecasted Estimates, Till 2035 (in Metric Tons)
- Figure 15.5 Demand for Pharmaceutical Contract Manufacturing: Distribution by Geographical Regions, Historical Trends, Since 2020 and Forecasted Estimates, Till 2035 (in Metric Tons)
- Figure 17.1 Global Pharmaceutical Contract Manufacturing Market, Historical Trends, Since 2023 and Forecasted Estimates, Till 2035 (USD Billion)
- Figure 17.2 Global Pharmaceutical Contract Manufacturing Market, Forecasted Estimates, Till 2035: Conservative Scenario (USD Billion)
- Figure 17.3 Global Pharmaceutical Contract Manufacturing Market, Forecasted Estimates, Till 2035: Optimistic Scenario (USD Billion)
- Figure 18.1 Pharmaceutical Contract Manufacturing Market: Distribution by Type of Product Manufactured
- Figure 18.2 Pharmaceutical Contract Manufacturing Market for API and Intermediates, Historical Trends, Since 2023 and Forecasted Estimates, Till 2035 (USD Billion)
- Figure 18.3 Pharmaceutical Contract Manufacturing Market for FDFs, Historical Trends, Since 2023 and Forecasted Estimates, Till 2035 (USD Billion)
- Figure 19.1 Pharmaceutical Contract Manufacturing Market: Distribution by Type of API
- Figure 19.2 Pharmaceutical Contract Manufacturing Market for Originator APIs, Historical Trends, Since 2023 and Forecasted Estimates, Till 2035 (USD Billion)
- Figure 19.3 Pharmaceutical Contract Manufacturing Market for Generic APIs, Historical Trends, Since 2023 and Forecasted Estimates, Till 2035 (USD Billion)
- Figure 20.1 Pharmaceutical Contract Manufacturing Market: Distribution by API Potency
- Figure 20.2 Pharmaceutical Contract Manufacturing Market for Low Potent APIs, Historical Trends, Since 2023 and Forecasted Estimates, Till 2035 (USD Billion)
- Figure 20.3 Pharmaceutical Contract Manufacturing Market for High Potent APIs, Historical Trends, Since 2023 and Forecasted Estimates, Till 2035 (USD Billion)
- Figure 21.1 Pharmaceutical Contract Manufacturing Market: Distribution by Type of FDF
- Figure 21.2 Pharmaceutical Contract Manufacturing Market for Originator FDFs, Historical Trends, Since 2023 and Forecasted Estimates, Till 2035 (USD Billion)
- Figure 21.3 Pharmaceutical Contract Manufacturing Market for Generic FDFs, Historical Trends, Since 2023 and Forecasted Estimates, Till 2035 (USD Billion)
- Figure 22.1 Pharmaceutical Contract Manufacturing Market: Distribution by Dosage Form
- Figure 22.2 Pharmaceutical Contract Manufacturing Market for Oral Solids, Historical Trends, Since 2023 and Forecasted Estimates, Till 2035 (USD Billion)
- Figure 22.3 Pharmaceutical Contract Manufacturing Market for Liquids, Historical Trends, Since 2023 and Forecasted Estimates, Till 2035 (USD Billion)
- Figure 22.4 Pharmaceutical Contract Manufacturing Market for Emulsions, Historical Trends, Since 2023 and Forecasted Estimates, Till 2035 (USD Billion)
- Figure 22.5 Pharmaceutical Contract Manufacturing Market for Other Dosage Forms, Historical Trends, Since 2023 and Forecasted Estimates, Till 2035 (USD Billion)
- Figure 23.1 Pharmaceutical Contract Manufacturing Market: Distribution by Type of Oral Solid
- Figure 23.2 Pharmaceutical Contract Manufacturing Market for Tablets, Historical Trends, Since 2023 and Forecasted Estimates, Till 2035 (USD Billion)
- Figure 23.3 Pharmaceutical Contract Manufacturing Market for Capsules, Historical Trends, Since 2023 and Forecasted Estimates, Till 2035 (USD Billion)
- Figure 23.4 Pharmaceutical Contract Manufacturing Market for Other Oral Solids, Historical Trends, Since 2023 and Forecasted Estimates, Till 2035 (USD Billion)
- Figure 24.1 Pharmaceutical Contract Manufacturing Market: Distribution by Type of Packaging Offered
- Figure 24.2 Pharmaceutical Contract Manufacturing Market for Bottles, Historical Trends, Since 2023 and Forecasted Estimates, Till 2035 (USD Billion)
- Figure 24.3 Pharmaceutical Contract Manufacturing Market for Blister Packs, Historical Trends, Since 2023 and Forecasted Estimates, Till 2035 (USD Billion)
- Figure 24.4 Pharmaceutical Contract Manufacturing Market for Oral Liquid Bottles, Historical Trends, Since 2023 and Forecasted Estimates, Till 2035 (USD Billion)
- Figure 24.5 Pharmaceutical Contract Manufacturing Market for Vials, Historical Trends, Since 2023 and Forecasted Estimates, Till 2035 (USD Billion)
- Figure 24.6 Pharmaceutical Contract Manufacturing Market for Prefilled Syringe, Historical Trends, Since 2023 and Forecasted Estimates, Till 2035 (USD Billion)
- Figure 24.7 Pharmaceutical Contract Manufacturing Market for Cartridges, Historical Trends, Since 2023 and Forecasted Estimates, Till 2035 (USD Billion)
- Figure 24.8 Pharmaceutical Contract Manufacturing Market for Ampoules, Historical Trends, Since 2023 and Forecasted Estimates, Till 2035 (USD Billion)
- Figure 24.9 Pharmaceutical Contract Manufacturing Market for Other Types of Packaging, Historical Trends, Since 2023 and Forecasted Estimates, Till 2035 (USD Billion)
- Figure 25.1 Pharmaceutical Contract Manufacturing Market: Distribution by Scale of Operation
- Figure 25.2 Pharmaceutical Contract Manufacturing Market for Clinical Scale, Historical Trends, Since 2023 and Forecasted Estimates, Till 2035 (USD Billion)
- Figure 25.3 Pharmaceutical Contract Manufacturing Market for Commercial Scale, Historical Trends, Since 2023 and Forecasted Estimates, Till 2035 (USD Billion)
- Figure 26.1 Pharmaceutical Contract Manufacturing Market: Distribution by End User
- Figure 26.2 Pharmaceutical Contract Manufacturing Market for Small Companies, Historical Trends, Since 2023 and Forecasted Estimates, Till 2035 (USD Billion)
- Figure 26.3 Pharmaceutical Contract Manufacturing Market for Mid-sized Companies, Historical Trends, Since 2023 and Forecasted Estimates, Till 2035 (USD Billion)
- Figure 26.4 Pharmaceutical Contract Manufacturing Market for Large and Very Large Companies, Historical Trends, Since 2023 and Forecasted Estimates, Till 2035 (USD Billion)
- Figure 27.1 Pharmaceutical Contract Manufacturing Market: Distribution by Geographical Region
- Figure 27.2 Pharmaceutical Contract Manufacturing Market in North America, Historical Trends, Since 2023 and Forecasted Estimates, Till 2035 (USD Billion)
- Figure 27.3 Pharmaceutical Contract Manufacturing Market in the US, Historical Trends (2021-2024) and Forecasted Estimates, Till 2035 (USD Billion)
- Figure 27.4 Pharmaceutical Contract Manufacturing Market in Canada, Historical Trends, Since 2023 and Forecasted Estimates, Till 2035 (USD Billion)
- Figure 27.5 Pharmaceutical Contract Manufacturing Market in Europe, Historical Trends, Since 2023 and Forecasted Estimates, Till 2035 (USD Billion)
- Figure 27.6 Pharmaceutical Contract Manufacturing Market in Germany, Historical Trends, Since 2023 and Forecasted Estimates, Till 2035 (USD Billion)
- Figure 27.7 Pharmaceutical Contract Manufacturing Market in France, Historical Trends, Since 2023 and Forecasted Estimates, Till 2035 (USD Billion)
- Figure 27.8 Pharmaceutical Contract Manufacturing Market in the UK, Historical Trends, Since 2023 and Forecasted Estimates, Till 2035 (USD Billion)
- Figure 27.9 Pharmaceutical Contract Manufacturing Market in Italy, Historical Trends, Since 2023 and Forecasted Estimates, Till 2035 (USD Billion)
- Figure 27.10 Pharmaceutical Contract Manufacturing Market in Spain, Historical Trends, Since 2023 and Forecasted Estimates, Till 2035 (USD Billion)
- Figure 27.11 Pharmaceutical Contract Manufacturing Market in Rest of the Europe, Historical Trends, Since 2023 and Forecasted Estimates, Till 2035 (USD Billion)
- Figure 27.12 Pharmaceutical Contract Manufacturing Market in Asia-Pacific, Historical Trends, Since 2023 and Forecasted Estimates, Till 2035 (USD Billion)
- Figure 27.13 Pharmaceutical Contract Manufacturing Market in China, Historical Trends, Since 2023 and Forecasted Estimates, Till 2035 (USD Billion)
- Figure 27.14 Pharmaceutical Contract Manufacturing Market in Japan, Historical Trends, Since 2023 and Forecasted Estimates, Till 2035 (USD Billion)
- Figure 27.15 Pharmaceutical Contract Manufacturing Market in India, Historical Trends, Since 2023 and Forecasted Estimates, Till 2035 (USD Billion)
- Figure 27.16 Pharmaceutical Contract Manufacturing Market in South Korea, Historical Trends, Since 2023 and Forecasted Estimates, Till 2035 (USD Billion)
- Figure 27.17 Pharmaceutical Contract Manufacturing Market in Australia, Historical Trends, Since 2023 and Forecasted Estimates, Till 2035 (USD Billion)
- Figure 27.18 Pharmaceutical Contract Manufacturing Market in Rest of the Asia-Pacific, Historical Trends, Since 2023 and Forecasted Estimates, Till 2035 (USD Billion)
- Figure 27.19 Pharmaceutical Contract Manufacturing Market in Latin America, Historical Trends, Since 2023 and Forecasted Estimates, Till 2035 (USD Billion)
- Figure 27.20 Pharmaceutical Contract Manufacturing Market in Brazil, Historical Trends, Since 2023 and Forecasted Estimates, Till 2035 (USD Billion)
- Figure 27.21 Pharmaceutical Contract Manufacturing Market in Argentina, Historical Trends, Since 2023 and Forecasted Estimates, Till 2035 (USD Billion)
- Figure 27.22 Pharmaceutical Contract Manufacturing Market in Rest of the Latin America, Historical Trends, Since 2023 and Forecasted Estimates, Till 2035 (USD Billion)
- Figure 27.23 Pharmaceutical Contract Manufacturing Market in Middle East and North Africa, Historical Trends, Since 2023 and Forecasted Estimates, Till 2035 (USD Billion)
- Figure 27.24 Pharmaceutical Contract Manufacturing Market in Saudi Arabia, Historical Trends, Since 2023 and Forecasted Estimates, Till 2035 (USD Billion)
- Figure 27.25 Pharmaceutical Contract Manufacturing Market in Egypt, Historical Trends, Since 2023 and Forecasted Estimates, Till 2035 (USD Billion)
- Figure 27.26 Pharmaceutical Contract Manufacturing Market in Rest of the Middle East and North Africa, Historical Trends, Since 2023 and Forecasted Estimates, Till 2035 (USD Billion)
- Figure 27.27 Market Movement Analysis: Geographical Regions
- Figure 27.28 Penetration-Growth (P-G) Matrix: Geographical Regions
- Figure 28.1 Pharmaceutical Contract Manufacturing Market: Distribution by Leading Players (USD Billion)
- Figure 33.1 Small Molecule and Large Molecule Drugs: Historical Trend of FDA Approval
- Figure 33.2 Small Molecules versus Large Molecules: Comparison of Manufacturing Process
- Figure 34.1 Conclusion: Market Landscape
- Figure 34.2 Conclusion: Mergers and Acquisitions
- Figure 34.3 Conclusion: Recent Expansions
- Figure 34.4 Conclusion: Capacity Analysis
- Figure 34.5 Conclusion: Demand Analysis
- Figure 34.6 Conclusion: Market Sizing and Opportunity Analysis

