PUBLISHER: MTN Consulting, LLC | PRODUCT CODE: 1593159

PUBLISHER: MTN Consulting, LLC | PRODUCT CODE: 1593159
Network Operator Capex Forecast - 4Q24 Edition: Telco Flatlines but GenAI-driven Data Center Hype Drives Comms Capex above $600B in 2024, Webscale will Lead Market by 2028
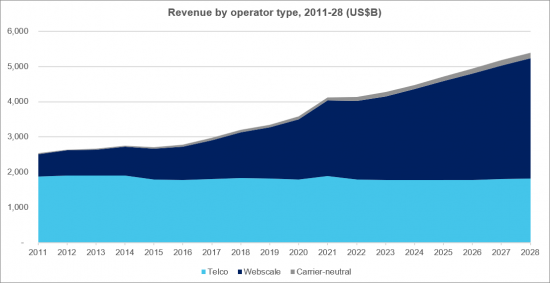
This forecast presents our latest projections for the network operator market, spanning telecommunications operators (telcos), webscalers, and carrier-neutral network operators (CNNOs). The forecast is based on our quarterly coverage of over 175 operators, and reflects market realities through the end of 3Q24. Our forecast includes revenues, capex and employee totals for all segments, and additional metrics for each individual segment. In 2024, we expect the three operator groups to account for $4.48 trillion (T) in revenues (2023: $4.27T), $612 billion (B) in capex (2023: $548B), and 8.86 million (M) employees (2023: 8.81M). This report provides 2011-23 actuals and projections through 2028, and includes projections from the most recent full forecast (12/23) for reference.
VISUALS

Below are the key highlights of the report:
Vendor addressable market: Tech vendors sell various products and services to each of the three operator segments tracked in this forecast - everything from GPU server chips to fiber optic splice enclosures to radio antennas to network construction to cloud software. Their addressable market is directly related to capex, which captures most external technology purchases including a large portion of software & services expenses. In 2011, the starting point of our coverage, total three segment capex was $336 billion, 90% of which was telco. By 2028, three segment capex will reach $638 billion, and telco will account for only 44% of the total. In the intervening years, an important segment of third-party neutral operators of network capacity and space has evolved; CNNO capex was just $6B in 2011 but will hit about $54B by 2028. But the real story of the market is webscale: capex spend by webscalers has surged multiple times as these tech companies innovate, scale and capture more of the world's digital value. In 2011, webscale capex was $29B, or 8% of the comms operator market. In 2023, it reached $193B (35% of total), and AI/GenAI demand is currently fueling it through another up cycle, which will push webscale to about $303B by 2028, or 48% of total (and more than telco for the first time).
Telco
This report includes region- and country-level projections for the telecommunications network operator (TNO, or telco) market. These projections are based upon MTN Consulting's quarterly coverage of 140 telcos across the globe, spanning 1Q11 through 2Q24. For 2024, we expect global telco revenues of $1,772 billion (flat versus 2023), capex of $297B (down 5% YoY), and employees of 4.457 million (down 1.2% YoY). Labor costs per employee in 2024 will be about $60.8K, up from $58.7K in 2023.
Webscale
This report includes projections for the growth and development of the webscale network operator (WNO, or webscale) market. The projections are based on our quarterly coverage of 21 webscalers, spanning 1Q11-2Q24, and they break out China from the rest of the globe. For 2024, we expect global webscale revenues of $2,584 billion, up 9% YoY, $311B in R&D spending (+6% YoY), $267 billion in capex (+39% YoY), and 4.284 million employees (+2.4% YoY). Our forecast for webscale capex has significantly increased since the last update in late 2023. However, the unusual spike in capex underway in 2024 will be followed by two years of decline.
Carrier-neutral
This report also includes projections for the growth and development of the carrier-neutral network operator (CNNO) market. The CNNO market is the smallest of three operator segments tracked by MTN Consulting, but CNNOs play a crucial, complementary role in the communications sector and own and operate a large portion of the world's cell towers, data centers, and fiber networks. Our CNNO projections are based upon quarterly tracking of 47 CNNOs across the globe. Our CNNO tracking is focused on publicly traded companies but we also attempt to capture the significant private equity-led activity in this sector. In 2024, we expect CNNO revenues to total about $125B (+4% YoY), capex of $48B (+16% YoY), and about 120K employees (flat YoY). CNNOs' asset base includes over 1,500 data centers, 3.3 million cell towers, and 1.1 million fiber route miles.
Companies mentioned:
|
|
Table of Contents
Key sections include:
- 1. Report Highlights
- 2. Summary
- 3. Network Operator Totals
- 4. Telco
- 5. Telco - Regional Splits
- 6. Webscale
- 7. Carrier-neutral (CNNO)
- 8. Spending outlook for top operators
- 9. About
This report has a large number of figures on each of the main result tabs: totals, telco, telco - regional splits, webscale, and carrier-neutral (CNNO). For a full list of figures please contact us.
Here is a list of figures on the "Totals" tab:
- Capex forecast by segment: 4Q24 v. Dec 2023 forecasts, % difference
- Capex forecast by segment: 4Q24 v. Dec 2023 forecasts, $B difference
- Revenue growth rates, all operators: New vs. old forecast
- Revenue growth rates, Telcos: New vs. old forecast
- Capital intensity, Telcos: New vs. old forecast
- Capital intensity, Webscalers: New vs. old forecast
- Capital intensity, Carrier-neutral operators: New vs. old forecast
- Revenue by operator type, 2011-28 (US$B)
- Capex by operator type, 2011-28 (US$B)
- Capex by operator type, 2011-28: % of total
- Capital intensity by operator type, 2011-28
- Employees by operator type (M)
- Revenues/employee by operator type (US$K)
- Network operator revenues by type, % global GDP
- Network operator employees (M), and % global population
- Telco revenues and capex per sub, 2011-22
- Top 50 spending operators, annualized 2Q24 capex ($B)
- Top 50 operators based on long-term capital intensity (3Q19-2Q24 avg)


