
PUBLISHER: MTN Consulting, LLC | PRODUCT CODE: 1555073

PUBLISHER: MTN Consulting, LLC | PRODUCT CODE: 1555073
Review of 2Q24 Capex and Outlook for all Segments - GenAI Bubble: Capex for Webscale and Carrier-neutral Sectors Climbs by 51% and 19% YoY in 2Q24, respectively, Telco Capex is still on the Decline as Companies Stabilize Profitability
This brief report reviews actual capex through June 2024 and the full-year outlook for key companies in three segments of communications network operators: telco, webscale and carrier-neutral.
VISUALS
MTN Consulting tracks communications network operator spending (capex) closely. Each quarter, we publish detailed Excel reviews for the telco & webscale markets. For carrier-neutral, we update our database informally each quarter and publish a detailed review once a year. For all three, we usually publish a market forecast twice a year: around December and around July. This year, our July update was postponed as we believed the market was too volatile to make publication of a new forecast feasible. That turned out to be a good decision. For example, interest rates now appear to be set to fall, which will support more telco capex and also entice some market consolidation (e.g. Verizon-Frontier). That gives more support to the presumption that telco spending will change directions after 2H24. Also, there is more support now for our thesis that GenAI is overly hyped and cannot sustain continued capex spikes.
We now plan to release an update around the end of 3Q24. As part of the update process, we expect to publish a number of shorter reports reviewing various aspects of the forecast. The starting point is a review of actual capex through 2Q24 and the latest guidance from key operators. That is the purpose of this report. As discussed below, webscale capex surged by over 50% YoY in 2Q24, carrier-neutral capex grew by about 20% YoY, but telco capex remains on the decline. That's where it has been for several straight quarters, recording YoY declines in the 5-10% range. The telco weakness is not a shock given the need to ramp down spending post 5G rollouts, and given the flat nature of the telecom industry. Moreover, we have long expected the cloud providers AWS, Azure and GCP to play a much larger role in telco networks, eventually. That is starting to happen as the cloud providers blend their solutions with more traditional telco vendors like Amdocs and Ericsson. For AWS, Azure and GCP, their combined sales to telcos now exceed $2B per quarter, from about $1B per quarter two years ago. This enables capex reductions.
Other topics we plan to address in the coming weeks include: labor costs & automation; data center spending & supply chain dynamics; shifting vendor landscape & implications for spending patterns; and wildcard topics, such as China starting a war, Trump winning, and India emerging as real player in tech supply chains.
COVERAGE:
Organizations mentioned:
|
|
Table of Contents
Summary
Capex results & outlook for key operators
- Webscale capex climbs 51% YoY in 2Q24
- Carrier-neutral capex up by 19% YoY in 2Q24
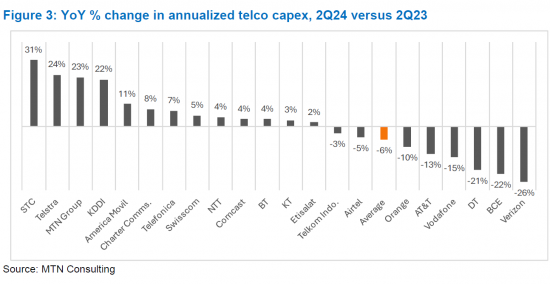
- Telco capex continued declining at a 5-10% YoY rate in 2Q24
Appendix
Figures:
- Figure 1: YoY % change in annualized capex for key webscalers, 2Q24
- Figure 2: Annualized capex for key CNNOs in 2Q24, YoY % change
- Figure 3: YoY % change in annualized telco capex, 2Q24 versus 2Q23

