
Need help finding what you are looking for?
Contact Us
PUBLISHER: Mordor Intelligence | PRODUCT CODE: 1690954

PUBLISHER: Mordor Intelligence | PRODUCT CODE: 1690954
India Biopesticides - Market Share Analysis, Industry Trends & Statistics, Growth Forecasts (2025 - 2030)
PUBLISHED:
PAGES: 129 Pages
DELIVERY TIME: 2-3 business days
SELECT AN OPTION
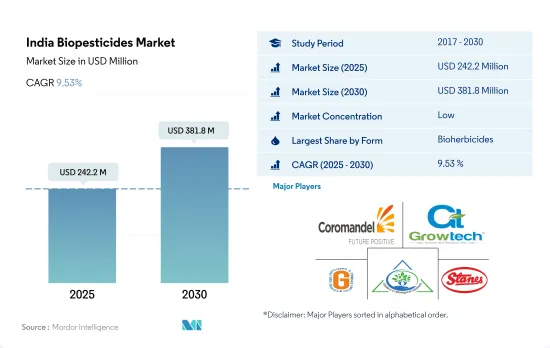
The India Biopesticides Market size is estimated at 242.2 million USD in 2025, and is expected to reach 381.8 million USD by 2030, growing at a CAGR of 9.53% during the forecast period (2025-2030).
- The increased public concerns about the probable adverse environmental effects associated with the use of synthetic plant protection products prompt the search for technologies and products based on biological processes to control pests.
- Out of 227 types of biopesticides, only 15 are pesticides registered in India. Neem-based pesticides, Bacillus thuringiensis, Nuclear Polyhedrosis virus, and Trichoderma are some of the major biopesticides produced and used in India.
- Biopesticides fall under the Insecticide Act (1968). Central Insecticides Board (CIB) and the Registration Committee (RC) are two "high-powered" bodies under this Act. CIB is the apex advisory. It comprises eminent scientists of all disciplines/fields concerned. The RC grants registrations to import or manufacture insecticides after scrutinizing the formulae and verifying claims of bio-efficacy and safety to human beings and animals.
- In India, several government agencies, such as the Ministry of Agriculture and Farmers Welfare, the Department of Biotechnology (DBT), and the Ministry of Science and Technology, have been promoting the research, development, and commercialization of biopesticides.
- The average consumption of pesticides in India is about 570 gm per ha. as compared to developed countries, like Japan, Thailand, and Germany, where the consumption rate is 11 kg, 17 kg, and 3 kg per ha, respectively. Though the average quantum of pesticide usage in India is low, the damage caused due to their indiscriminate usage and poor quality maintenance is alarming. In terms of value, much of the pesticide application is accounted for by a few crops. For example, cotton, paddy and vegetable crops account for 80% of the value of pesticides applied in India.
India Biopesticides Market Trends
Growing number of organic producers helping the increase in area under organic cultivation, primarily in row crops
- India is the largest country, in terms of the total number of certified organic producers in the world, with 1.3 million organic producers in 2019. Despite having a large number of organic producers, organic cultivation areas in the country account for around 2.0% of the total agriculture area in the country. In 2021, the organic area in the country was recorded as 711,094.0 hectares, which increased by about 3.4% compared to 2017. Organic farming in the country is concentrated in only a few states. The top ten organic farming states in the country account for about 80.0% of the total organic crop area. A few states have taken the lead in improving organic farming coverage, like Madhya Pradesh, Rajasthan, and Maharashtra, which are the top three organic farming states in the country. Madhya Pradesh alone accounted for about 27.0% of India's total organic cultivation area in 2019.
- Organic cultivation of row crops is dominant in the country, which accounted for about 59.7% of the total organic crop area in 2021. Cereal crop production is dominant rice, wheat, millet, and maize are the major cereals produced. Most cereal crops are grown in the kharif season (June - September). The crops grown in this season are mainly rain dependent or require more water, like rice, maize, cotton, and soybean.
- The overall organic cash crop cultivation area increased from 0.27 million hectares in 2017 to 0.28 million hectares in 2021. The major cash crops produced in the country are cotton, sugarcane, tea, and spices. There is a limited growth of organic horticultural crops currently in the country. The increasing demand for organic products and Indian government initiatives to go organic are anticipated to increase organic crop area between 2023 and 2029.
Growing demand and their easy accessibility through e-commerce channels, rising the per capita spending on organic food
- India's per capita spending on organic products is relatively low at USD 0.23 compared to the average per capita spending on organic products in Asia-Pacific. However, in recent years, shifting consumer demand has increased toward organic products as more customers perceive these items offer better immunity, higher quality, and more accessibility through e-commerce channels. India is a promising and developing market for organic foods and beverages. India's domestic organic food and beverage industry is expected to be worth USD 138.0 million by 2024, rising at a compound annual growth rate of 13% between 2019 to 2024.
- In 2022, the total combined organic food and beverages worth USD 108.0 million consumed in the country. The consumption value of organic products in the country increased from USD 45 million in 2016 to USD 96.0 million in 2021. Organic food sales have seen an increasing trend mainly due to increasing consumer awareness, and high-income consumers are propelling organic food and beverage consumption. Categories that gained the most demand included essential foods, such as organic eggs, dairy, and fruits and vegetables.
- Organic beverage consumption dominated the market and accounted for about 85.2% of the total combined organic food and beverages market value in 2022. The organic beverages segment includes organic packaged food and beverages that are certified by the approved certification body. Organic beverage consumption value increased at a CAGR of 14% between 2020 to 2022. The price premium associated with organic products hampers lower-income consumer access and is the major limiting factor for organic food consumption. However, organic products' active promotion and advantages drive the organic food market during the forecast period.
India Biopesticides Industry Overview
The India Biopesticides Market is fragmented, with the top five companies occupying 9.83%. The major players in this market are Coromandel International Ltd, GrowTech Agri Science Private Limited, Gujarat State Fertilizers & Chemicals Ltd, IPL Biologicals Limited and T.Stanes and Company Limited (sorted alphabetically).
Additional Benefits:
- The market estimate (ME) sheet in Excel format
- 3 months of analyst support
Product Code: 72612
TABLE OF CONTENTS
1 EXECUTIVE SUMMARY & KEY FINDINGS
2 REPORT OFFERS
3 INTRODUCTION
- 3.1 Study Assumptions & Market Definition
- 3.2 Scope of the Study
- 3.3 Research Methodology
4 KEY INDUSTRY TRENDS
- 4.1 Area Under Organic Cultivation
- 4.2 Per Capita Spending On Organic Products
- 4.3 Regulatory Framework
- 4.3.1 India
- 4.4 Value Chain & Distribution Channel Analysis
5 MARKET SEGMENTATION (includes market size in Value in USD and Volume, Forecasts up to 2030 and analysis of growth prospects)
- 5.1 Form
- 5.1.1 Biofungicides
- 5.1.2 Bioherbicides
- 5.1.3 Bioinsecticides
- 5.1.4 Other Biopesticides
- 5.2 Crop Type
- 5.2.1 Cash Crops
- 5.2.2 Horticultural Crops
- 5.2.3 Row Crops
6 COMPETITIVE LANDSCAPE
- 6.1 Key Strategic Moves
- 6.2 Market Share Analysis
- 6.3 Company Landscape
- 6.4 Company Profiles (includes Global Level Overview, Market Level Overview, Core Business Segments, Financials, Headcount, Key Information, Market Rank, Market Share, Products and Services, and Analysis of Recent Developments).
- 6.4.1 Andermatt Group AG
- 6.4.2 Central Biotech Private Limited
- 6.4.3 Coromandel International Ltd
- 6.4.4 GrowTech Agri Science Private Limited
- 6.4.5 Gujarat State Fertilizers & Chemicals Ltd
- 6.4.6 IPL Biologicals Limited
- 6.4.7 Jaipur Bio Fertilizers
- 6.4.8 Samriddhi Crops India Pvt. Ltd
- 6.4.9 T.Stanes and Company Limited
- 6.4.10 Volkschem Crop Science Private Limited
7 KEY STRATEGIC QUESTIONS FOR AGRICULTURAL BIOLOGICALS CEOS
8 APPENDIX
- 8.1 Global Overview
- 8.1.1 Overview
- 8.1.2 Porter's Five Forces Framework
- 8.1.3 Global Value Chain Analysis
- 8.1.4 Market Dynamics (DROs)
- 8.2 Sources & References
- 8.3 List of Tables & Figures
- 8.4 Primary Insights
- 8.5 Data Pack
- 8.6 Glossary of Terms
Have a question?


SELECT AN OPTION
Have a question?
Questions? Please give us a call or visit the contact form.