
Need help finding what you are looking for?
Contact Us
PUBLISHER: Mordor Intelligence | PRODUCT CODE: 1687726

PUBLISHER: Mordor Intelligence | PRODUCT CODE: 1687726
Mycorrhiza - Market Share Analysis, Industry Trends & Statistics, Growth Forecasts (2025 - 2030)
PUBLISHED:
PAGES: 280 Pages
DELIVERY TIME: 2-3 business days
SELECT AN OPTION
The Mycorrhiza Market size is estimated at 1.29 billion USD in 2025, and is expected to reach 2.05 billion USD by 2030, growing at a CAGR of 9.63% during the forecast period (2025-2030).
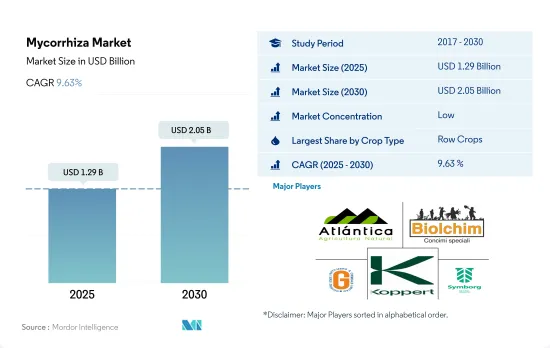
- Mycorrhiza is a fungus that establishes a symbiotic relationship with the plant root system. It increases the root surface area of the plants, which in turn enhances the nutrient uptake of the plants. Row crops dominate the mycorrhiza market, and the segment accounted for about 76.0% of the market value in 2022. Barley, corn, wheat, rapeseed, rye, sunflower, soybean, and rice are the major row crops grown globally.
- Horticultural crops represent 19.2% of the global mycorrhiza market, valued at USD 192.0 million in 2022, with Europe being the dominant market with a share of 52.6% in the same year. The demand for organic fruits and vegetables in the region is growing, with Germany and France being the major markets for organic food consumption.
- Cash crops, including coffee, tea, cocoa, cotton, and sugarcane, accounted for 4.7% of the global mycorrhiza market in 2022. The North American region dominates the mycorrhiza biofertilizer market for cash crops. The segment accounted for 59.2% of the total value in 2022, with the United States being the dominant market, accounting for 47.0% of the market share. The large cultivation area in the United States and the presence of phosphorous-deficient soils in about 16 states are the main factors contributing to this dominance.
- The use of mycorrhiza in agriculture provides a sustainable and eco-friendly approach to improving plant growth and productivity. The mycorrhiza market is expected to grow in the coming years as more farmers and growers adopt this technology to improve their yields and reduce their environmental footprint.
- Mycorrhiza is the most consumed biofertilizer globally, and it accounted for a share of 36.3% in 2022, with a market value of USD 995.4 million and a volume of 96.6 thousand metric tons. Mycorrhiza is a fungus that establishes a symbiotic relationship with the plant root system. It increases the root surface area of the plants, which in turn enhances the nutrient uptake of the plants.
- Europe dominated the global biofertilizers market with a share of 55.2% in 2022. Mycorrhiza biofertilizer in the European region accounted for a market value of USD 549.5 million in 2022 and a volume of 32.5 thousand metric tons in the same year. The European market is estimated to grow and register a CAGR of 9.3% between 2023 and 2029.
- North America accounted for 25.4% of the global mycorrhiza market in 2022. Row crops dominated the North American mycorrhiza biofertilizer market, accounting for about 68.1% of the market value in 2022. This is mainly due to the more phosphorous-demanding cereal crops, like corn and maize, and the presence of large-row crop cultivation areas in the country
- Mycorrhiza, also referred to as arbuscular mycorrhizal fungi (AMF), was proven to increase crop yields significantly. About 231 field trials conducted over four years in Europe in potato filed under ideal conditions increased the yield of marketable potatoes by 9.5% on average. Mycorrhizae contribute significantly to plant nutrition, particularly to phosphorus uptake. They contribute to the selective absorption of immobile (P, Zn, and Cu) and mobile (S, Ca, K, Fe, Mn, Cl, Br, and N) elements from plants and water uptake.
Global Mycorrhiza Market Trends
Organic production is at an all-time high in North America and Europe, due to the increasing awareness and Government initiatives.
- Organic agriculture has emerged as a significant contributor to sustainable food systems, with 187 countries practicing it globally. As of 2021, there was 72.3 million ha of organic agricultural land worldwide, with an average increase of 2.9% across all regions from 2018 to 2021. Organic arable land accounted for 14.4 million ha, representing 19.9% of the total organic agricultural land.
- The strongest markets for organic farming are North America and Europe, accounting for 41.0% of the global organic arable land. In 2022, Europe had 6.5 million ha of organic arable land, equivalent to 44.1% of the overall organic arable agricultural area. The most significant crops grown organically in North America and Europe are apples, strawberries, cereals, and olives.
- Developing countries in Asia-Pacific are also joining the organic agriculture movement and becoming self-sufficient in producing and providing fresh organic produce to meet their domestic demand. The trend of organic farming is gaining momentum in Asia-Pacific, with the region recording an 18.8% increase in organic arable land from 2017 to 2022. The major initiatives by governments in the region also play a vital role in the growing trend of organic farming. For example, Japan's Basic Plan for Food, Agriculture, and Rural Areas aims to triple the number of organic farmers and lands by 2030.
- The growth of organic agriculture is driven by the rising awareness of the benefits of organic farming, such as promoting soil health, reducing environmental impacts, and producing healthier food.
Per capita spending of organic food majorly observed in United States and Germany, attributed to the consumer demand for healthier and sustainable food
- The organic food market experienced significant growth in the past few years, with global sales reaching USD 120.6 billion in 2020, up from USD 70.8 billion in 2012. The trend toward organic food is being driven by several factors, such as increasing consumer demand for healthier, more sustainable food options and a growing awareness of the environmental impact of conventional agriculture. The global organic food market is expected to continue its growth trend over the coming years.
- According to a survey conducted by the Organic Trade Association in 2021, sales of organic fruits and vegetables increased by around 4.5% in the same year, accounting for 15% of the overall organic sales. North America dominates the market in terms of average spending on organic products, with per capita spending in the United States reaching USD 186.7 in 2021, the highest among all North American countries. Europe is also expected to experience significant growth in the organic food market, with Germany accounting for the highest per capita spending of USD 75.6 in 2021.
- While the organic food market is still dominated by developed countries with high consumer disposable incomes, it is also expected to grow in developing nations. For example, the increasing number of working-class people in the Asia-Pacific region may contribute to the market's expansion due to the growing availability and affordability of organic food products.
Mycorrhiza Industry Overview
The Mycorrhiza Market is fragmented, with the top five companies occupying 2%. The major players in this market are Atlantica Agricola, Biolchim SPA, Gujarat State Fertilizers & Chemicals Ltd, Koppert Biological Systems Inc. and Symborg, Inc. (sorted alphabetically).
Additional Benefits:
- The market estimate (ME) sheet in Excel format
- 3 months of analyst support
Product Code: 64677
TABLE OF CONTENTS
1 EXECUTIVE SUMMARY & KEY FINDINGS
2 REPORT OFFERS
3 INTRODUCTION
- 3.1 Study Assumptions & Market Definition
- 3.2 Scope of the Study
- 3.3 Research Methodology
4 KEY INDUSTRY TRENDS
- 4.1 Area Under Organic Cultivation
- 4.2 Per Capita Spending On Organic Products
- 4.3 Regulatory Framework
- 4.3.1 Argentina
- 4.3.2 Australia
- 4.3.3 Brazil
- 4.3.4 Canada
- 4.3.5 China
- 4.3.6 Egypt
- 4.3.7 France
- 4.3.8 Germany
- 4.3.9 India
- 4.3.10 Indonesia
- 4.3.11 Italy
- 4.3.12 Japan
- 4.3.13 Mexico
- 4.3.14 Netherlands
- 4.3.15 Nigeria
- 4.3.16 Philippines
- 4.3.17 Russia
- 4.3.18 South Africa
- 4.3.19 Spain
- 4.3.20 Thailand
- 4.3.21 Turkey
- 4.3.22 United Kingdom
- 4.3.23 United States
- 4.3.24 Vietnam
- 4.4 Value Chain & Distribution Channel Analysis
5 MARKET SEGMENTATION (includes market size in Value in USD and Volume, Forecasts up to 2030 and analysis of growth prospects)
- 5.1 Crop Type
- 5.1.1 Cash Crops
- 5.1.2 Horticultural Crops
- 5.1.3 Row Crops
- 5.2 Region
- 5.2.1 Africa
- 5.2.1.1 By Country
- 5.2.1.1.1 Egypt
- 5.2.1.1.2 Nigeria
- 5.2.1.1.3 South Africa
- 5.2.1.1.4 Rest of Africa
- 5.2.2 Asia-Pacific
- 5.2.2.1 By Country
- 5.2.2.1.1 Australia
- 5.2.2.1.2 China
- 5.2.2.1.3 India
- 5.2.2.1.4 Indonesia
- 5.2.2.1.5 Japan
- 5.2.2.1.6 Philippines
- 5.2.2.1.7 Thailand
- 5.2.2.1.8 Vietnam
- 5.2.2.1.9 Rest of Asia-Pacific
- 5.2.3 Europe
- 5.2.3.1 By Country
- 5.2.3.1.1 France
- 5.2.3.1.2 Germany
- 5.2.3.1.3 Italy
- 5.2.3.1.4 Netherlands
- 5.2.3.1.5 Russia
- 5.2.3.1.6 Spain
- 5.2.3.1.7 Turkey
- 5.2.3.1.8 United Kingdom
- 5.2.3.1.9 Rest of Europe
- 5.2.4 Middle East
- 5.2.4.1 By Country
- 5.2.4.1.1 Iran
- 5.2.4.1.2 Saudi Arabia
- 5.2.4.1.3 Rest of Middle East
- 5.2.5 North America
- 5.2.5.1 By Country
- 5.2.5.1.1 Canada
- 5.2.5.1.2 Mexico
- 5.2.5.1.3 United States
- 5.2.5.1.4 Rest of North America
- 5.2.6 South America
- 5.2.6.1 By Country
- 5.2.6.1.1 Argentina
- 5.2.6.1.2 Brazil
- 5.2.6.1.3 Rest of South America
- 5.2.1 Africa
6 COMPETITIVE LANDSCAPE
- 6.1 Key Strategic Moves
- 6.2 Market Share Analysis
- 6.3 Company Landscape
- 6.4 Company Profiles (includes Global Level Overview, Market Level Overview, Core Business Segments, Financials, Headcount, Key Information, Market Rank, Market Share, Products and Services, and Analysis of Recent Developments).
- 6.4.1 Atlantica Agricola
- 6.4.2 Biolchim SPA
- 6.4.3 Biostadt India Limited
- 6.4.4 Gujarat State Fertilizers & Chemicals Ltd
- 6.4.5 Indogulf BioAg LLC (Biotech Division of Indogulf Company)
- 6.4.6 Koppert Biological Systems Inc.
- 6.4.7 Sustane Natural Fertilizer Inc.
- 6.4.8 Symborg, Inc.
- 6.4.9 T.Stanes and Company Limited
- 6.4.10 Valent Biosciences LLC
7 KEY STRATEGIC QUESTIONS FOR AGRICULTURAL BIOLOGICALS CEOS
8 APPENDIX
- 8.1 Global Overview
- 8.1.1 Overview
- 8.1.2 Porter's Five Forces Framework
- 8.1.3 Global Value Chain Analysis
- 8.1.4 Market Dynamics (DROs)
- 8.2 Sources & References
- 8.3 List of Tables & Figures
- 8.4 Primary Insights
- 8.5 Data Pack
- 8.6 Glossary of Terms
Have a question?


SELECT AN OPTION
Have a question?
Questions? Please give us a call or visit the contact form.