
Need help finding what you are looking for?
Contact Us
PUBLISHER: Mordor Intelligence | PRODUCT CODE: 1686316

PUBLISHER: Mordor Intelligence | PRODUCT CODE: 1686316
Agricultural Biologicals - Market Share Analysis, Industry Trends & Statistics, Growth Forecasts (2025 - 2030)
PUBLISHED:
PAGES: 402 Pages
DELIVERY TIME: 2-3 business days
SELECT AN OPTION
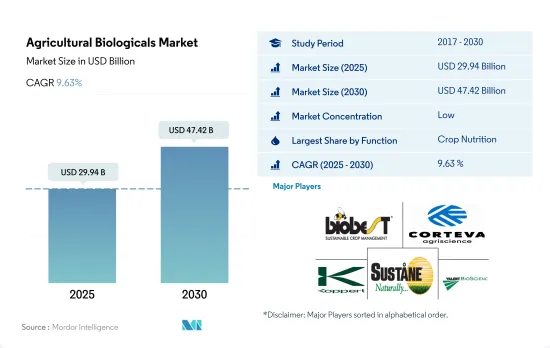
The Agricultural Biologicals Market size is estimated at 29.94 billion USD in 2025, and is expected to reach 47.42 billion USD by 2030, growing at a CAGR of 9.63% during the forecast period (2025-2030).
- The crop nutrition segment held the highest share of the global agricultural biologicals market in 2022, accounting for 64.7% by value and 98.1% by volume. Organic fertilizers accounted for about 58.8% of the crop nutrition market in 2022, owing to their vast availability and inexpensive cost.
- The global organic fertilizer market was dominated by meal-based fertilizers, which accounted for 43.2% in 2022. Bone meal is largely used to meet the phosphorus requirements of crop production, whereas blood meal is mostly used to supply nitrogen in crops.
- Row crops accounted for 81.3% of the crop nutrition segment in 2022, followed by horticultural and cash crops, which held shares of 10.0% and 8.7%, respectively. The dominance of row crops was partly due to their large cultivation area.
- Macrobials dominated the biocontrol agents segment, accounting for USD 3.11 billion in 2022. This high share was due to their ability to control a wide range of pests. When compared to other biocontrol organisms, macrobials are voracious feeders.
- In 2022, predators accounted for about 91.0% of the macrobial market by value due to their ability to attack various pest species and their life stages.
- Consumers' growing knowledge of the detrimental effects of synthetic fertilizers is boosting the demand for organic products both internationally and domestically. As a result, the market is expected to grow between 2023 and 2029.
- The European region is one of the world's major producers of organic crops and the largest consumer of organic products. Germany and France are some of the major organic crop producers in the region, and they account for the highest organic product consumption in the regional market. Due to the rise in the overall organic crop area, the regional market has expanded by about 22.9%. The market is expected to grow by a CAGR of 8.5% between 2023 and 2029, reaching USD 14.11 billion by 2029.
- The Asia-Pacific region is a large producer of organic products, ranking second in terms of market value. China and India are the region's leading organic crop producers and the region's largest organic product consumers as well. The region's organic agricultural area increased significantly from 2017 to 2021, growing from 4.9 million hectares in 2017 to 6.9 million hectares in 2021.
- North America accounted for 34.5% of the global biofertilizers market value in 2022. The area under cultivation of organic crops in the region increased by 13.5% from 1.4 million hectares in 2017 to 1.6 million hectares in 2021. The demand for organic food in the region is growing rapidly, with an average per capita spending on organic food products in North America valued at USD 109.7 in 2021.
- The expanding organic crop areas and the rising demand for organic products and biological fertilizers lower the overall chemical fertilizer usage and crop production costs. The governments' efforts to encourage organic farming are expected to drive the global agricultural biologicals market between 2023 and 2029, registering a CAGR of 9.4%.
Global Agricultural Biologicals Market Trends
Organic production is at an all-time high in North America and Europe, due to the increasing awareness and Government initiatives.
- Organic agriculture has emerged as a significant contributor to sustainable food systems, with 187 countries practicing it globally. As of 2021, there was 72.3 million ha of organic agricultural land worldwide, with an average increase of 2.9% across all regions from 2018 to 2021. Organic arable land accounted for 14.4 million ha, representing 19.9% of the total organic agricultural land.
- The strongest markets for organic farming are North America and Europe, accounting for 41.0% of the global organic arable land. In 2022, Europe had 6.5 million ha of organic arable land, equivalent to 44.1% of the overall organic arable agricultural area. The most significant crops grown organically in North America and Europe are apples, strawberries, cereals, and olives.
- Developing countries in Asia-Pacific are also joining the organic agriculture movement and becoming self-sufficient in producing and providing fresh organic produce to meet their domestic demand. The trend of organic farming is gaining momentum in Asia-Pacific, with the region recording an 18.8% increase in organic arable land from 2017 to 2022. The major initiatives by governments in the region also play a vital role in the growing trend of organic farming. For example, Japan's Basic Plan for Food, Agriculture, and Rural Areas aims to triple the number of organic farmers and lands by 2030.
- The growth of organic agriculture is driven by the rising awareness of the benefits of organic farming, such as promoting soil health, reducing environmental impacts, and producing healthier food.
Per capita spending of organic food majorly observed in United States and Germany, attributed to the consumer demand for healthier and sustainable food
- The organic food market experienced significant growth in the past few years, with global sales reaching USD 120.6 billion in 2020, up from USD 70.8 billion in 2012. The trend toward organic food is being driven by several factors, such as increasing consumer demand for healthier, more sustainable food options and a growing awareness of the environmental impact of conventional agriculture. The global organic food market is expected to continue its growth trend over the coming years.
- According to a survey conducted by the Organic Trade Association in 2021, sales of organic fruits and vegetables increased by around 4.5% in the same year, accounting for 15% of the overall organic sales. North America dominates the market in terms of average spending on organic products, with per capita spending in the United States reaching USD 186.7 in 2021, the highest among all North American countries. Europe is also expected to experience significant growth in the organic food market, with Germany accounting for the highest per capita spending of USD 75.6 in 2021.
- While the organic food market is still dominated by developed countries with high consumer disposable incomes, it is also expected to grow in developing nations. For example, the increasing number of working-class people in the Asia-Pacific region may contribute to the market's expansion due to the growing availability and affordability of organic food products.
Agricultural Biologicals Industry Overview
The Agricultural Biologicals Market is fragmented, with the top five companies occupying 4.05%. The major players in this market are Biobest Group NV, Corteva Agriscience, Koppert Biological Systems Inc., Sustane Natural Fertilizer Inc. and Valent Biosciences LLC (sorted alphabetically).
Additional Benefits:
- The market estimate (ME) sheet in Excel format
- 3 months of analyst support
Product Code: 52091
TABLE OF CONTENTS
1 EXECUTIVE SUMMARY & KEY FINDINGS
2 REPORT OFFERS
3 INTRODUCTION
- 3.1 Study Assumptions & Market Definition
- 3.2 Scope of the Study
- 3.3 Research Methodology
4 KEY INDUSTRY TRENDS
- 4.1 Area Under Organic Cultivation
- 4.2 Per Capita Spending On Organic Products
- 4.3 Regulatory Framework
- 4.3.1 Argentina
- 4.3.2 Australia
- 4.3.3 Brazil
- 4.3.4 Canada
- 4.3.5 China
- 4.3.6 Egypt
- 4.3.7 France
- 4.3.8 Germany
- 4.3.9 India
- 4.3.10 Indonesia
- 4.3.11 Italy
- 4.3.12 Japan
- 4.3.13 Mexico
- 4.3.14 Netherlands
- 4.3.15 Nigeria
- 4.3.16 Philippines
- 4.3.17 Russia
- 4.3.18 South Africa
- 4.3.19 Spain
- 4.3.20 Thailand
- 4.3.21 Turkey
- 4.3.22 United Kingdom
- 4.3.23 United States
- 4.3.24 Vietnam
- 4.4 Value Chain & Distribution Channel Analysis
5 MARKET SEGMENTATION (includes market size in Value in USD and Volume, Forecasts up to 2030 and analysis of growth prospects)
- 5.1 Function
- 5.1.1 Crop Nutrition
- 5.1.1.1 Biofertilizer
- 5.1.1.1.1 Azospirillum
- 5.1.1.1.2 Azotobacter
- 5.1.1.1.3 Mycorrhiza
- 5.1.1.1.4 Phosphate Solubilizing Bacteria
- 5.1.1.1.5 Rhizobium
- 5.1.1.1.6 Other Biofertilizers
- 5.1.1.2 Biostimulants
- 5.1.1.2.1 Amino Acids
- 5.1.1.2.2 Fulvic Acid
- 5.1.1.2.3 Humic Acid
- 5.1.1.2.4 Protein Hydrolysates
- 5.1.1.2.5 Seaweed Extracts
- 5.1.1.2.6 Other Biostimulants
- 5.1.1.3 Organic Fertilizer
- 5.1.1.3.1 Manure
- 5.1.1.3.2 Meal Based Fertilizers
- 5.1.1.3.3 Oilcakes
- 5.1.1.3.4 Other Organic Fertilizers
- 5.1.2 Crop Protection
- 5.1.2.1 Biocontrol Agents
- 5.1.2.1.1 Macrobials
- 5.1.2.1.2 Microbials
- 5.1.2.2 Biopesticides
- 5.1.2.2.1 Biofungicides
- 5.1.2.2.2 Bioherbicides
- 5.1.2.2.3 Bioinsecticides
- 5.1.2.2.4 Other Biopesticides
- 5.1.1 Crop Nutrition
- 5.2 Crop Type
- 5.2.1 Cash Crops
- 5.2.2 Horticultural Crops
- 5.2.3 Row Crops
- 5.3 Region
- 5.3.1 Africa
- 5.3.1.1 Egypt
- 5.3.1.2 Nigeria
- 5.3.1.3 South Africa
- 5.3.1.4 Rest of Africa
- 5.3.2 Asia-Pacific
- 5.3.2.1 Australia
- 5.3.2.2 China
- 5.3.2.3 India
- 5.3.2.4 Indonesia
- 5.3.2.5 Japan
- 5.3.2.6 Philippines
- 5.3.2.7 Thailand
- 5.3.2.8 Vietnam
- 5.3.2.9 Rest of Asia-Pacific
- 5.3.3 Europe
- 5.3.3.1 France
- 5.3.3.2 Germany
- 5.3.3.3 Italy
- 5.3.3.4 Netherlands
- 5.3.3.5 Russia
- 5.3.3.6 Spain
- 5.3.3.7 Turkey
- 5.3.3.8 United Kingdom
- 5.3.3.9 Rest of Europe
- 5.3.4 Middle East
- 5.3.4.1 Iran
- 5.3.4.2 Saudi Arabia
- 5.3.4.3 Rest of Middle East
- 5.3.5 North America
- 5.3.5.1 Canada
- 5.3.5.2 Mexico
- 5.3.5.3 United States
- 5.3.5.4 Rest of North America
- 5.3.6 South America
- 5.3.6.1 Argentina
- 5.3.6.2 Brazil
- 5.3.6.3 Rest of South America
- 5.3.1 Africa
6 COMPETITIVE LANDSCAPE
- 6.1 Key Strategic Moves
- 6.2 Market Share Analysis
- 6.3 Company Landscape
- 6.4 Company Profiles (includes Global Level Overview, Market Level Overview, Core Business Segments, Financials, Headcount, Key Information, Market Rank, Market Share, Products and Services, and Analysis of Recent Developments).
- 6.4.1 Agriculture Solutions Inc.
- 6.4.2 Biobest Group NV
- 6.4.3 Bioworks Inc.
- 6.4.4 California Organic Fertilizers Inc.
- 6.4.5 Cascade Agronomics LLC
- 6.4.6 Corteva Agriscience
- 6.4.7 Indogulf BioAg LLC (Biotech Division of Indogulf Company)
- 6.4.8 Koppert Biological Systems Inc.
- 6.4.9 Lallemand Inc.
- 6.4.10 Samriddhi Crops India Pvt Ltd
- 6.4.11 Sigma Agriscience LLC
- 6.4.12 Sustane Natural Fertilizer Inc.
- 6.4.13 Symborg Inc.
- 6.4.14 The Espoma Company
- 6.4.15 Valent Biosciences LLC
7 KEY STRATEGIC QUESTIONS FOR AGRICULTURAL BIOLOGICALS CEOS
8 APPENDIX
- 8.1 Global Overview
- 8.1.1 Overview
- 8.1.2 Porter's Five Forces Framework
- 8.1.3 Global Value Chain Analysis
- 8.1.4 Market Dynamics (DROs)
- 8.2 Sources & References
- 8.3 List of Tables & Figures
- 8.4 Primary Insights
- 8.5 Data Pack
- 8.6 Glossary of Terms
Have a question?


SELECT AN OPTION
Have a question?
Questions? Please give us a call or visit the contact form.