
PUBLISHER: Mordor Intelligence | PRODUCT CODE: 1644271

PUBLISHER: Mordor Intelligence | PRODUCT CODE: 1644271
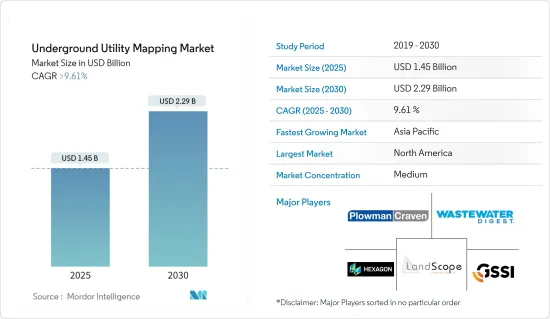
Underground Utility Mapping - Market Share Analysis, Industry Trends & Statistics, Growth Forecasts (2025 - 2030)
The Underground Utility Mapping Market size is estimated at USD 1.45 billion in 2025, and is expected to reach USD 2.29 billion by 2030, at a CAGR of greater than 9.61% during the forecast period (2025-2030).
Two primary factors are propelling the underground utility mapping market: heightened economic activities, especially in developing nations, and increasing government initiatives aimed at maintaining these underground utilities.
Key Highlights
- In recent years, the subsurface utility engineering (SUE) industry has been at the forefront, crafting innovative solutions to the challenges of mapping underground utility infrastructures. By melding geophysical technologies, such as electromagnetic locators and ground-penetrating radars, with non-technical methods like historical records, the industry is able to amass a comprehensive dataset of subsurface infrastructures.
- Moreover, the World Economic Forum anticipates that global investments in urban grey infrastructure will skyrocket to USD 10,548 billion by 2030. Such monumental urban development investments herald a significant growth opportunity for the underground utility mapping market.
- As urbanization accelerates, the global trend of smart cities is gaining traction. The United Nations projects that by 2050, urban populations will swell by 404 million in India, 292 million in China, and 212 million in Nigeria.
- Meanwhile, Latin America, an emerging continent, is experiencing the swiftest urbanization. With numerous global smart city projects in motion, international investments are pouring in. The Organization for Economic Cooperation and Development (OECD) estimates that from 2010 to 2030, global investments in smart city initiatives will near USD 1.8 trillion, encompassing all metropolitan infrastructure projects. This surge in smart city developments is set to amplify demand in the underground utility mapping market.
- Infrastructure planning, often sidelined in urban development, is vital for the seamless operation of complex facilities. A pivotal tool in this endeavor is 3D utility mapping, which provides a three-dimensional perspective of an area and its utilities. This method captures subsurface data, encompassing water, sewer, and gas lines, alongside structural maps and electrical wiring. Armed with a detailed 3D utility map and a Conceptual Site Model (CSM), planners can swiftly pinpoint challenges and devise effective solutions.
- By merging emerging technologies with utility maps, the underground utility mapping market is undergoing a transformation. These advancements bolster the accuracy, efficiency, and safety of exploration activities. Consequently, exploration teams can adeptly navigate challenges tied to underground infrastructure, streamline their routes, and mitigate risks, driving the market's growth and fostering innovation.
- While Ground Penetrating Radar (GPR) excels at pinpointing the horizontal locations of targets, various factors can sway the speed and precision of depth measurements. Soil type and moisture content are pivotal. For instance, radar signals slow down in challenging soils like sand and clay. Moisture-rich materials further influence signal speed. Thus, while pinpointing the exact speed of GPR signals across different materials poses challenges, estimates generally hover around 90% accuracy.
Underground Utility Mapping Market Trends
Ground Penetrating Radar is Expected to be the Largest Component Type Solution
- Ground-penetrating radar (GPR) stands out as the premier choice for utility mapping, emitting directional electromagnetic waves in the MHz and GHz range. By analyzing the return of these signals, GPR accurately pinpoints the location of underground utility infrastructure.
- GPR technology is notably adept at identifying both metallic and nonmetallic utilities. Utility surveyors favor GPR for its swift data acquisition, cost-effectiveness, and high-resolution imagery in utility mapping surveys.
- Beyond utility mapping, GPR serves as a non-destructive tool for evaluating concrete structures, revealing insights on rebar placements, slab thickness, and the presence of voids or conduits. This non-invasive approach not only ensures precise results but also minimizes disruptions to ongoing construction projects.
- In a forward-looking move, drone manufacturers are crafting GPR-enabled drones, hinting at a burgeoning market opportunity as they become poised to detect underground utilities.
- With the expansion of natural gas pipelines, the demand for precise mapping and monitoring intensifies. Ground penetration techniques play a pivotal role in locating, identifying, and evaluating pipeline conditions, all while safeguarding the surrounding environment. As of February 2024, data from GGON highlights China's dominance in the global gas pipeline landscape. Boasting 442 operational pipelines and an additional 302 either proposed or under construction, China's network is a significant contributor to the global tally of over 1,500 operational gas pipelines.
North America Holds Largest Market Share
- In North America, rapid urbanization and population growth are straining existing infrastructure systems, leading to a heightened demand for underground utility mapping services. The complexity and density of urban areas necessitate precise mapping to prevent damage to underground utilities during construction.
- The National Underground Asset Registry Advisory Group reports that the challenge of locating underground utilities costs the U.S. economy approximately USD 50 billion annually. This issue has also led to over 1,500 injuries and nearly 400 fatalities in the past two decades. Furthermore, inaccuracies in underground utility mapping contribute significantly to delays in highway construction. Such uncertainties are driving the adoption of advanced technology-based solutions in the region.
- Numerous cities and municipalities across North America are channeling investments into smart city initiatives. These efforts aim to harness technology for better infrastructure management, enhanced public services, and optimized resource allocation. Within this context, underground utility mapping plays a pivotal role, offering vital data for infrastructural asset management and planning.
- Efforts are underway in the region to develop methods for sharing data on underground utilities, especially those captured during construction. A notable example is the City of Chicago's pilot program, which aims to deploy a platform for data collection and sharing a 3D map of the subway.
- Regional players are increasingly adopting inorganic growth strategies to capture larger market shares, further propelling the segment's growth. Additionally, many public works departments in the region are utilizing GIS technology to pinpoint the locations of underground utilities.
Underground Utility Mapping Industry Overview
The underground utility mapping market features a semi-consolidated landscape, characterized by the coexistence of global giants and a multitude of small to medium-sized enterprises. Key players shaping the market include Hexagon AB, GSSI Geophysical Survey Systems Inc., LandScope Engineering Ltd, Plowman Craven Limited, and Geospatial Corporation. These players are strategically leveraging partnerships and acquisitions to bolster their product offerings and secure a competitive edge.
For example, in April 2024, USIC, LLC ("USIC"), a prominent player in underground utility damage prevention, forged an official partnership with the U.S. Army's Partnership for Your Success (PaYS) Program. This initiative provides American soldiers with opportunities to serve their country while simultaneously preparing for their post-service careers. The partnership was ceremoniously signed at USIC's corporate headquarters, with the event being hosted by the Indiana Army National Guard Recruiting and Retention Battalion. As a recognized PaYS Partner, USIC pledges to offer soldiers an interview and a shot at employment once they conclude their Army tenure. This strategic alliance not only facilitates a smoother transition for soldiers into civilian life but also underscores the US Army's dedication to nurturing strong relationships with the corporate sector.
Additional Benefits:
- The market estimate (ME) sheet in Excel format
- 3 months of analyst support
TABLE OF CONTENTS
1 INTRODUCTION
- 1.1 Study Assumptions and Market Definition
- 1.2 Scope of the Study
2 RESEARCH METHODOLOGY
3 EXECUTIVE SUMMARY
4 MARKET INSIGHTS
- 4.1 Market Overview
- 4.2 Industry Attractiveness - Porter's Five Forces Analysis
- 4.2.1 Threat of New Entrants
- 4.2.2 Bargaining Power of Buyers/Consumers
- 4.2.3 Bargaining Power of Suppliers
- 4.2.4 Threat of Substitute Products
- 4.2.5 Intensity of Competitive Rivalry
5 MARKET DYNAMICS
- 5.1 Market Drivers
- 5.1.1 Emerging Technologies Combined With Utility Maps to Improve the Exploration Activities
- 5.1.2 Increasing Availability of Detecting Applications and Increased Return on Marketing Spending
- 5.2 Market Challenges
- 5.2.1 Significantly High Maintenance Costs of Mapping Tools
6 IMPACT OF COVID-19 ON THE UNDERGROUND UTILITY MAPPING MARKET
7 MARKET SEGMENTATION
- 7.1 By Component Type
- 7.1.1 Solutions
- 7.1.1.1 Ground Penetrating Radar
- 7.1.1.2 Electromagnetic Locators
- 7.1.1.3 Other Solutions
- 7.1.2 Services
- 7.1.1 Solutions
- 7.2 By End-user Industry
- 7.2.1 Public Safety
- 7.2.2 Oil and Gas
- 7.2.3 Building and Construction
- 7.2.4 Telecommunication
- 7.2.5 Electricity
- 7.2.6 Other End-user Industries
- 7.3 By Geography
- 7.3.1 North America
- 7.3.2 Europe
- 7.3.3 Asia
- 7.3.4 Australia and New Zealand
- 7.3.5 Latin America
- 7.3.6 Middle East and Africa
8 COMPETITIVE LANDSCAPE
- 8.1 Company Profiles
- 8.1.1 Hexagon AB
- 8.1.2 GSSI Geophysical Survey Systems Inc.
- 8.1.3 Landscope Engineering Ltd
- 8.1.4 Plowman Craven Limited
- 8.1.5 Geospatial Corporation
- 8.1.6 Vivax-Metrotech Corp.
- 8.1.7 Maverick Inspection Ltd
- 8.1.8 Red Laser Scanning
- 8.1.9 Technics Group
- 8.1.10 multiVIEW Locates Inc.
9 INVESTMENT ANALYSIS
10 FUTURE OF THE MARKET

