
PUBLISHER: Mordor Intelligence | PRODUCT CODE: 1635379

PUBLISHER: Mordor Intelligence | PRODUCT CODE: 1635379
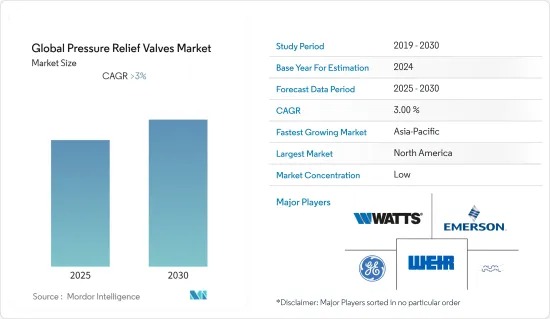
Global Pressure Relief Valves - Market Share Analysis, Industry Trends & Statistics, Growth Forecasts (2025 - 2030)
The Global Pressure Relief Valves Market is expected to register a CAGR of greater than 3% during the forecast period.
The COVID-19 pandemic halted the production of various products in the pressure relief valves industry, which is attributed to the global lockdown. This hampered the growth of the pressure relief valve market. COVID-19 affected the sales of pressure relief valves in the first quarter of 2021 and is anticipated to hurt the market growth throughout 2022. Though sales of pressure relief valves plummeted during the initial stages of the pandemic, with global manufacturing sector operations reviving toward threshold rates, the market is expected to recover sharply over subsequent years.
However, the oil and gas industry has rebounded strongly throughout 2021, with oil prices reaching their highest levels in six years. The future is bright and hugely profitable for the oil and gas industry because the current dependence on energy from fossil fuels is too heavy to accommodate the spontaneous migration to renewable energy. The Power Generation Electric grids worldwide have a goal of carbon-free power generation. Coal is being replaced by gas which requires valves to regulate the flow of gas in a pneumatic system. The growth in these industries will drive the growth of the pressure relief valves market.
The United States of America is the world's leading country in the production of chemical products followed by Germany, Russia, and China. The United States is also the largest producer and consumer of petrochemicals with a 20% share of total oil production in 2021, followed by Saudi Arabia (11%), Russia (11%), and Canada (6%). China is the leading power-producing country followed by the United States, India, and Russia. China produced 7779.1 terawatt hours of electricity in 2020. As these are the top countries producing oil & gas, power, and petrochemicals - the end-users for pressure relief valves - they are the major markets for the valves and will see significant growth in the pressure relief valves market during the forecast period.
Pressure Relief Valves Market Trends
Increasing Oil & Gas Demand Driving the Growth of the Market
Each day, the world produced 95.57 million barrels of oil in 2021, and in 2022, it's estimated that this will reach 99.89 million barrels per day. In 2020, the world's crude oil demand reached 91 million barrels per day. This was the lowest amount of demand since 2012, but it quickly increased as COVID-19 pandemic lockdowns began to lift during 2021 and into 2022. In 2021, the world discovered the equivalent of 4.7 billion barrels of oil in crude oil and natural gas. The U.S. consumes 17.178 million barrels of oil per day. This makes the U.S. the leading country as far as oil consumption goes, followed by China, which consumes 14.225 million barrels per day, and India, which consumes 4.669 million barrels per day.
In 2021, the world consumed 97.39 million barrels of oil a day. In 2022, it's estimated that the world will consume 99.61 million barrels per day, and by 2023, it's estimated that consumption will reach 101.55 million barrels per day. The crude oil to the refineries and refined products such as gasoline, kerosene, jet fuel, and heating oil from refineries to the market are carried through oil pipelines. Overly high-pressure levels could result in pipeline bursts or cause even the most resilient valves to malfunction. Due to this, pressure relief valves are installed in an oil pipeline. The growing oil & gas across the world will surely drive the pressure relief valves market.
Increasing Need for Nuclear Power Expected to Drive the Growth of the Market
According to World Nuclear Association, around 10% of the world's electricity is generated by about 440 nuclear power reactors. About 55 more reactors are under construction, equivalent to approximately 15% of the existing capacity. In 2020 nuclear plants supplied 2553 TWh of electricity, down from 2657 TWh in 2019. Prior to 2020, electricity generation from nuclear energy had increased for seven consecutive years. Thirteen countries in 2020 produced at least one-quarter of their electricity from nuclear. France gets around three-quarters of its electricity from nuclear energy, Slovakia and Ukraine get more than half from nuclear, whilst Hungary, Belgium, Slovenia, Bulgaria, Finland, and the Czech Republic get one-third or more. South Korea normally gets more than 30% of its electricity from nuclear, while in the USA, UK, Spain, Romania, and Russia about one-fifth of electricity is from nuclear.
There is a need for new generating capacity around the world, both to replace old fossil fuel units, especially coal-fired ones, which emit a lot of carbon dioxide, and to meet the increased demand for electricity in many countries. The World Nuclear Association has put forward an ambitious scenario called the Harmony programme which proposes the addition of 1000 GWe of new nuclear capacity by 2050, to provide 25% of electricity then (about 10,000 TWh) from 1250 GWe of capacity (after allowing for retirements).
Surge in need for nuclear power generation is expected to open up new opportunities for pressure relief valves industry participants. As pressure relief valves are critical for safeguarding turbines, super heaters, and boilers and allowing station to operate at a predetermined pressure.
Pressure Relief Valves Industry Overview
The pressure relief valve market is fairly fragmented. Some of the key players in the market are General Electric, Emerson Electric Co., Watts, The Weir Group PLC, and Alfa Laval. The market players undergo competition to capture the market share. Major companies apply many strategies like mergers and acquisitions, and technological innovations to provide their customers with the broadest portfolio of valves to improve process performance and reliability.
Additional Benefits:
- The market estimate (ME) sheet in Excel format
- 3 months of analyst support
TABLE OF CONTENTS
1 INTRODUCTION
- 1.1 Study Deliverables
- 1.2 Study Assumptions
- 1.3 Scope of the Study
2 RESEARCH METHODOLOGY
- 2.1 Analysis Methodology
- 2.2 Research Phases
3 EXECUTIVE SUMMARY
4 MARKET DYNAMICS
- 4.1 Market Overview
- 4.2 Market Dynamics
- 4.2.1 Drivers
- 4.2.2 Restraints
- 4.3 Value Chain / Supply Chain Analysis
- 4.4 Industry Policies and Regulations
- 4.5 Technological Developments in the Sector
- 4.6 Industry Attractiveness - Porter's Five Forces Analysis
- 4.7 Impact of COVID-19 on the Market
5 MARKET SEGMENTATION
- 5.1 By Product Type
- 5.1.1 Pilot Operated
- 5.1.2 Spring Loaded
- 5.1.3 Dead Weight
- 5.1.4 Others
- 5.2 By Set Pressure
- 5.2.1 High Pressure
- 5.2.2 Medium Pressure
- 5.2.3 Low Pressure
- 5.3 By End User
- 5.3.1 Oil & Gas
- 5.3.2 Chemical Processing
- 5.3.3 Power Generation
- 5.3.4 Paper & Pulp
- 5.3.5 Food & Beverages
- 5.3.6 Pharmaceuticals
- 5.3.7 Others
- 5.4 By Geography
- 5.4.1 North America
- 5.4.1.1 United States
- 5.4.1.2 Canada
- 5.4.1.3 Mexico
- 5.4.2 Europe
- 5.4.2.1 Germany
- 5.4.2.2 United Kingdom
- 5.4.2.3 Italy
- 5.4.2.4 France
- 5.4.2.5 Rest of Europe
- 5.4.3 Asia-Pacific
- 5.4.3.1 China
- 5.4.3.2 India
- 5.4.3.3 Japan
- 5.4.3.4 South-Korea
- 5.4.3.5 Rest of Asia-Pacific
- 5.4.4 Middle East and Africa
- 5.4.4.1 UAE
- 5.4.4.2 Saudi Arabia
- 5.4.4.3 Iran
- 5.4.4.4 Rest of the Middle East and Africa
- 5.4.5 Rest of the World
- 5.4.1 North America
6 COMPETITIVE LANDSCAPE
- 6.1 Market Concentration Overview
- 6.2 Company Profiles
- 6.2.1 General Electric
- 6.2.2 Emerson Electric Co.
- 6.2.3 Watts Water Technologies, Inc
- 6.2.4 Weir Group Plc.
- 6.2.5 Alfa Laval Corporate AB
- 6.2.6 Curtis-Wright Corp
- 6.2.7 AGF Manufacturing, Inc.
- 6.2.8 Mercury Manufacturing Company
- 6.2.9 IMI Plc
- 6.2.10 Goetze KG Armaturen*
7 MARKET OPPORTUNITIES AND FUTURE TRENDS
8 DISCLAIMER

