PUBLISHER: Mordor Intelligence | PRODUCT CODE: 2122278

PUBLISHER: Mordor Intelligence | PRODUCT CODE: 2122278
Active Geofencing - Market Share Analysis, Industry Trends & Statistics, Growth Forecasts (2026 - 2031)
According to Mordor Intelligence, the active geofencing market size is expected to grow from USD 2.23 billion in 2025 to USD 2.7 billion in 2026 and is forecast to reach USD 6.97 billion by 2031 at 20.94% CAGR over 2026-2031.
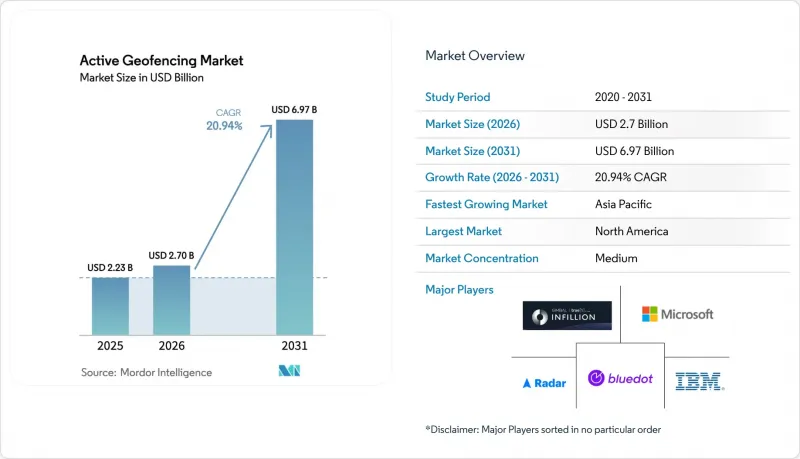
This report is Segmented by Component (Solutions, Services), Deployment Mode (Cloud, On-Premise, Hybrid), Technology (GPS/GNSS, Cellular, and More), End-User Enterprise Size (SMEs, Large Enterprises), End-User Industry Vertical (BFSI, Retail and E-Commerce, and More), and Geography (North America, South America, Europe, Asia Pacific, and More). The Market Forecasts are Provided in Terms of Value (USD).
Global Active Geofencing Market Trends and Insights
Proliferation of IoT-enabled Mobile Devices
Roughly 30 billion connected devices will be active worldwide by 2025, providing a dense sensor fabric that feeds high-granularity location streams into geofencing engines. Modern smartphones fuse GPS, cellular, Wi-Fi RTT, and Bluetooth Low Energy to achieve sub-meter accuracy, enabling safety-critical use cases such as hospital asset tracking and industrial automation. 5G's ultra-low latency further tightens geofence response times, ensuring that alerts or control messages execute inside mission-critical thresholds.
Rising Demand for Hyper-local Marketing
Retailers and quick-service restaurants use geofencing to push time-sensitive offers that triple acquisition rates versus untargeted messaging. Lower CPMs than print or out-of-home media, combined with measurable foot-traffic attribution, have led major chains to embed geofencing into omnichannel playbooks. Dynamic radius sizing based on real-time travel time models also raises message relevance, sustaining high engagement while lowering ad waste.
Heightened Consumer-privacy Regulations
The FTC's prohibition on selling sensitive geolocation data, combined with multimillion-dollar penalties levied on U.S. carriers, compels vendors to invest in granular consent management and on-device anonymization. Europe's GDPR remains the global template, requiring explicit opt-in for location tracking and rigorous data minimization. Adapting active geofencing workflows to multiple state-level rules in the United States adds compliance overhead that can slow roll-outs.
Other drivers and restraints analyzed in the detailed report include:
- Integration with Fleet Telematics and Last-mile Logistics
- Expansion of Drone-based Inspections
- Battery-drain and Device-performance Concerns
For complete list of drivers and restraints, kindly check the Table Of Contents.
Segment Analysis
Solution contributed 65.74% of 2025 revenue, and the services segment is on track for 17.55% CAGR as enterprises outsource design, deployment, and optimization tasks that demand scarce spatial-analytics expertise. System integrators bundle compliance audits, low-code app development, and managed monitoring so that customers can launch campaigns in weeks instead of quarters. In regulated sectors, service providers fine-tune consent flows and encryption settings to pass HIPAA or PCI audits on the first attempt. Rising demand for outcome-based contracts is encouraging vendors to peg fees to lift in foot traffic or reduction in theft incidents, aligning incentives and deepening client stickiness.
Platform vendors also promote certification programs to enlarge the talent pool, while universities add micro-credentials in location engineering. These initiatives ease the entry barrier for small businesses and expand the overall active geofencing market. Continuous optimization services updating polygon boundaries, modifying dwell-time rules, and A/B testing creative assets ensure that campaigns remain effective as urban density, traffic patterns, or store footprints evolve
Cloud retained 65.95% share in 2025 thanks to elastic scaling and global coverage, but hybrid architectures are growing fastest at 19.11% CAGR because they let firms process sensitive coordinates on-premise while offloading analytics to the cloud. Hospitals, for example, keep patient-level location events inside a private subnet yet use cloud AI to forecast bed demand. Financial institutions follow a similar pattern: geofence checks for fraud prevention run locally, whereas aggregated heat maps go to the cloud for marketing insights.
Edge devices routers, gateways, and smartphones now host lightweight brokers that decide, in milliseconds, where to execute each location rule. This adaptive routing lowers latency for safety-critical alerts and trims egress fees. As national data-sovereignty laws proliferate, vendors bundle geo-fencing policy engines with data-residency controls, thereby future-proofing large deployments across multiple jurisdictions.
Complete Report Scope:
- By Component
- Solution
- Services
- By Deployment Mode
- Cloud
- On-premise
- Hybrid
- By Technology
- GPS/GNSS
- Cellular
- Wi-Fi/BLE
- RFID/NFC
- UAV/Drone Geofencing Systems
- By End-User Enterprise Size
- Small and Medium Enterprises (SMEs)
- Large Enterprises
- By End-User Industry Vertical
- Banking, Financial Services and Insurance (BFSI)
- Retail and E-commerce
- Transportation and Logistics
- Healthcare and Life Sciences
- Government and Defense
- Industrial Manufacturing
- Media and Entertainment
- Other End-user Industry Vertical
- By Geography
- North America
- United States
- Canada
- Mexico
- South America
- Brazil
- Argentina
- Rest of South America
- Europe
- Germany
- United Kingdom
- France
- Italy
- Spain
- Russia
- Rest of Europe
- Asia Pacific
- China
- India
- Japan
- South Korea
- Australia and New Zealand
- ASEAN
- Rest of Asia Pacific
- Middle East and Africa
- Middle East
- Saudi Arabia
- United Arab Emirates
- Turkey
- Rest of Middle East
- Africa
- South Africa
- Nigeria
- Kenya
- Rest of Africa
- Middle East
- North America
Geography Analysis
North America held 38.02% revenue share in 2025 owing to widespread 5G coverage, mature advertising ecosystems, and strong enterprise IT budgets. U.S. retailers report double-digit foot-traffic lift when adding geofencing to loyalty apps, and logistics providers routinely geofence fulfilment centres to shave loading-dock idle time. The FTC's clear enforcement stance creates predictable compliance rules that let vendors innovate without guessing the regulatory direction. Canada leverages geofencing in government digital-service portals, while Mexico's e-commerce boom fuels adoption among parcel carriers and mall operators.
Asia Pacific is the fastest-growing region at 17.01% CAGR through 2031, helped by urbanization, smartphone saturation, and megacity smart-infrastructure projects. China's "super-apps" embed geofencing across payments, ride-hailing, and local commerce, normalizing the technology for 1 billion consumers. India's Unified Logistics Interface Platform links carrier APIs with geofence-verified delivery milestones, streamlining regulatory filings and reducing demurrage. Advanced 5G private-network pilots in South Korea and Japan support factory automation, where micro-geofences around robotic workcells ensure worker safety and asset protection.
Europe maintains steady momentum under a privacy-first paradigm. Cities such as Stockholm and Barcelona use geofenced "green zones" to redirect polluting vehicles, cutting congestion and emissions. Manufacturers integrate geofencing into Industry 4.0 lines for predictive maintenance and accident prevention. The European Commission's push for common urban-mobility data layers is spurring interoperable geofencing standards, enhancing cross-border logistics efficiency. Eastern European logistics hubs and Nordic renewable-energy plants add to a diverse set of regional deployments.
- Google LLC
- Apple Inc.
- Microsoft Corporation
- IBM Corporation
- Amazon Web Services, Inc.
- ESRI, Inc.
- Bluedot Innovation Pty Ltd
- Radar Labs Inc.
- Infillion Inc. (Gimbal)
- Verve Group, Inc.
- HERE Technologies
- Qualcomm Technologies, Inc.
- GeoComply Solutions Inc.
- LocationSmart
- Skyhook Holdings, Inc.
- Samsung Electronics Co., Ltd.
- Oracle Corporation
- SAP SE
- TomTom International B.V.
- Uber Technologies, Inc. (Uber Map Services)
- Unacast, Inc.
- Foursquare Labs, Inc.
- SZ DJI Technology Co., Ltd.
- Geofeedia, Inc.
Additional Benefits:
- The market estimate (ME) sheet in Excel format
- 3 months of analyst support
TABLE OF CONTENTS
1 INTRODUCTION
- 1.1 Study Assumptions and Market Definition
- 1.2 Scope of the Study
2 RESEARCH METHODOLOGY
3 EXECUTIVE SUMMARY
4 MARKET LANDSCAPE
- 4.1 Market Overview
- 4.2 Market Drivers
- 4.2.1 Proliferation of IoT-enabled mobile devices driving precise location data
- 4.2.2 Rising demand for hyper-local marketing among retailers and QSRs
- 4.2.3 Integration of geofencing in fleet telematics and last-mile logistics
- 4.2.4 Expansion of drone-based industrial inspections requiring dynamic geofence safety zones
- 4.2.5 Government smart-city initiatives mandating geo-aware public services
- 4.2.6 Emergence of spatial computing and AR platforms needing real-time geofencing layers
- 4.3 Market Restraints
- 4.3.1 Heightened consumer-privacy regulations limiting persistent tracking
- 4.3.2 Battery-drain and device-performance concerns with always-on apps
- 4.3.3 Fragmented accuracy across indoor/outdoor geolocation technologies
- 4.3.4 Competitive substitution from broad LBS platforms commoditising geofencing
- 4.4 Industry Value-Chain Analysis
- 4.5 Regulatory Landscape
- 4.6 Technological Outlook
- 4.7 Porter's Five Forces Analysis
- 4.7.1 Bargaining Power of Suppliers
- 4.7.2 Bargaining Power of Buyers
- 4.7.3 Threat of New Entrants
- 4.7.4 Threat of Substitute Products
- 4.7.5 Intensity of Competitive Rivalry
5 MARKET SIZE AND GROWTH FORECASTS (VALUE)
- 5.1 By Component
- 5.1.1 Solution
- 5.1.2 Services
- 5.2 By Deployment Mode
- 5.2.1 Cloud
- 5.2.2 On-premise
- 5.2.3 Hybrid
- 5.3 By Technology
- 5.3.1 GPS/GNSS
- 5.3.2 Cellular
- 5.3.3 Wi-Fi/BLE
- 5.3.4 RFID/NFC
- 5.3.5 UAV/Drone Geofencing Systems
- 5.4 By End-User Enterprise Size
- 5.4.1 Small and Medium Enterprises (SMEs)
- 5.4.2 Large Enterprises
- 5.5 By End-User Industry Vertical
- 5.5.1 Banking, Financial Services and Insurance (BFSI)
- 5.5.2 Retail and E-commerce
- 5.5.3 Transportation and Logistics
- 5.5.4 Healthcare and Life Sciences
- 5.5.5 Government and Defense
- 5.5.6 Industrial Manufacturing
- 5.5.7 Media and Entertainment
- 5.5.8 Other End-user Industry Vertical
- 5.6 By Geography
- 5.6.1 North America
- 5.6.1.1 United States
- 5.6.1.2 Canada
- 5.6.1.3 Mexico
- 5.6.2 South America
- 5.6.2.1 Brazil
- 5.6.2.2 Argentina
- 5.6.2.3 Rest of South America
- 5.6.3 Europe
- 5.6.3.1 Germany
- 5.6.3.2 United Kingdom
- 5.6.3.3 France
- 5.6.3.4 Italy
- 5.6.3.5 Spain
- 5.6.3.6 Russia
- 5.6.3.7 Rest of Europe
- 5.6.4 Asia Pacific
- 5.6.4.1 China
- 5.6.4.2 India
- 5.6.4.3 Japan
- 5.6.4.4 South Korea
- 5.6.4.5 Australia and New Zealand
- 5.6.4.6 ASEAN
- 5.6.4.7 Rest of Asia Pacific
- 5.6.5 Middle East and Africa
- 5.6.5.1 Middle East
- 5.6.5.1.1 Saudi Arabia
- 5.6.5.1.2 United Arab Emirates
- 5.6.5.1.3 Turkey
- 5.6.5.1.4 Rest of Middle East
- 5.6.5.2 Africa
- 5.6.5.2.1 South Africa
- 5.6.5.2.2 Nigeria
- 5.6.5.2.3 Kenya
- 5.6.5.2.4 Rest of Africa
- 5.6.5.1 Middle East
- 5.6.1 North America
6 COMPETITIVE LANDSCAPE
- 6.1 Market Concentration
- 6.2 Strategic Moves
- 6.3 Market Share Analysis
- 6.4 Company Profiles (includes Global level Overview, Market level overview, Core Segments, Financials as available, Strategic Information, Market Rank/Share for key companies, Products and Services, and Recent Developments)
- 6.4.1 Google LLC
- 6.4.2 Apple Inc.
- 6.4.3 Microsoft Corporation
- 6.4.4 IBM Corporation
- 6.4.5 Amazon Web Services, Inc.
- 6.4.6 ESRI, Inc.
- 6.4.7 Bluedot Innovation Pty Ltd
- 6.4.8 Radar Labs Inc.
- 6.4.9 Infillion Inc. (Gimbal)
- 6.4.10 Verve Group, Inc.
- 6.4.11 HERE Technologies
- 6.4.12 Qualcomm Technologies, Inc.
- 6.4.13 GeoComply Solutions Inc.
- 6.4.14 LocationSmart
- 6.4.15 Skyhook Holdings, Inc.
- 6.4.16 Samsung Electronics Co., Ltd.
- 6.4.17 Oracle Corporation
- 6.4.18 SAP SE
- 6.4.19 TomTom International B.V.
- 6.4.20 Uber Technologies, Inc. (Uber Map Services)
- 6.4.21 Unacast, Inc.
- 6.4.22 Foursquare Labs, Inc.
- 6.4.23 SZ DJI Technology Co., Ltd.
- 6.4.24 Geofeedia, Inc.
7 MARKET OPPORTUNITIES AND FUTURE OUTLOOK
- 7.1 White-space and Unmet-need Assessment

