
PUBLISHER: MarketsandMarkets | PRODUCT CODE: 1859654
PUBLISHER: MarketsandMarkets | PRODUCT CODE: 1859654
Crane Rental Market by Type (Fixed Cranes, Mobile Cranes), Weightlifting Capacity (Low, Low to Medium, Heavy, Extremely Heavy), End-use Industry (Building & Construction, Infrastructure, Other End-use Industries), and Region - Global Forecast to 2030
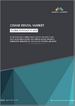
The crane rental market size is projected to reach USD 68.04 billion by 2030 from USD 53.12 billion in 2025, at a CAGR of 5.1% from 2025 to 2030.
| Scope of the Report | |
|---|---|
| Years Considered for the Study | 2021-2030 |
| Base Year | 2024 |
| Forecast Period | 2025-2030 |
| Units Considered | Value (USD Million) Volume (Million Units) |
| Segments | Type, Weightlifting Capacity, End-use Industry, and Region |
| Regions covered | North America, Asia Pacific, Europe, the Middle East & Africa, and South America |
The crane rental sector is expected to grow due to rising construction and infrastructure development worldwide. Many companies prefer renting cranes over purchasing them because of the significant initial costs and ongoing maintenance expenses associated with ownership. Additionally, the demand for crane rentals is increasing as a result of heightened activity in renewable energy, oil and gas, and various industrial projects.
"Mobile cranes segment is projected to exhibit the highest CAGR from 2025 to 2030"
The mobile cranes segment is expected to record the highest CAGR in the crane rental market during the forecast period, owing to their high flexibility and ability to move around job sites at high speed. Mobile cranes can be used in a wide variety of applications, including construction and industrial maintenance. They are easy to set up and versatile, and hence, they are preferred by rental companies and contractors.
"Low weightlifting capacity segment is projected to exhibit the highest CAGR during the forecast period"
The low weightlifting capacity segment is expected to record the highest CAGR in the crane rental market during the forecast period since they are simple to carry, use, and maintain, and they are affordable when used on a short-term basis. They are also small in size and can be used in urban construction sites where space is limited.
"Building & construction segment is projected to account for the largest market share in 2030"
The building & construction segment is the largest end-use industry in the crane rental market, as construction sites need cranes to lift and handle materials. The rapid pace of residential, commercial, and public infrastructure projects increases the demand for cranes. Renting cranes helps construction companies manage costs and access modern equipment without making significant investments.
"The Asia Pacific crane rental market is projected to grow at the highest CAGR during the forecast period"
Asia Pacific is experiencing high growth in the crane rental market due to its high rate of urbanization, industrialization, and extensive infrastructure spending. Countries such as China, India, and Indonesia are immensely investing in construction and transportation works. The government's smart city and renewable energy programs are also increasing the demand for crane rental.
By Company Type: Tier 1 - 25%, Tier 2 - 42%, and Tier 3 - 33%
By Designation: C-level Executives - 20%, Directors - 30%, and Others - 50%
By Region: North America - 20%, Europe - 10%, Asia Pacific - 40%, South America - 10%, and the Middle East & Africa - 20%
Companies Covered: Liebherr (Germany), United Rentals Inc. (US), PALFINGER AG (Austria), Sarens NV (Belgium), Mammoet (Netherlands), and The Manitowoc Company, Inc. (US), among others, are covered in the report.
The study includes an in-depth competitive analysis of these key players in the crane rental market, with their company profiles, recent developments, and key market strategies.
Research Coverage
This research report categorizes the crane rental market based on type (mobile cranes and fixed cranes), weightlifting capacity (low, low to medium, heavy, and extremely heavy), end-use industry (building & construction, infrastructure, oil & gas, energy & power, marine & offshore, mining & excavation, transportation, and other end-use industries), and region (Asia Pacific, North America, Europe, South America, and the Middle East & Africa). The report's scope covers detailed information regarding the drivers, restraints, challenges, and opportunities influencing the growth of the crane rental market. A detailed analysis of the key industry players has been done to provide insights into their business overview, products offered, and key strategies, such as partnerships, product launches, expansions, and acquisitions, associated with the crane rental market. This report covers a competitive analysis of upcoming startups in the crane rental market ecosystem.
Reasons to Buy the Report
The report will offer the market leaders/new entrants with information on the closest approximations of the revenue numbers for the overall crane rental market and the subsegments. This report will help stakeholders understand the competitive landscape, gain more insights into positioning their businesses better, and plan suitable go-to-market strategies. The report will help stakeholders understand the market and provide them with information on key market drivers, restraints, challenges, and opportunities.
The report provides insights into the following points:
- Analysis of key drivers (surge in construction and infrastructure projects), restraints (elevated maintenance and operational expenses for rental providers), opportunities (rapid infrastructure growth across emerging markets), and challenges (heightened market competition and pricing pressures)
- Product Development/Innovation: Detailed insights into upcoming technologies, research & development activities, and product & service launches in the crane rental market
- Market Development: Comprehensive information about profitable markets-the report analyzes the crane rental market across varied regions
Market Diversification: Exhaustive information about new products & services, untapped geographies, recent developments, and investments in the crane rental market
- Competitive Assessment: In-depth assessment of market shares, growth strategies, and product/service offerings of leading players, such as Liebherr (Germany), United Rentals Inc. (US), PALFINGER AG (Austria), Sarens NV (Belgium), Mammoet (Netherlands), and The Manitowoc Company, Inc. (US).
TABLE OF CONTENTS
1 INTRODUCTION
- 1.1 STUDY OBJECTIVES
- 1.2 MARKET DEFINITION
- 1.3 STUDY SCOPE
- 1.3.1 MARKETS COVERED AND REGIONAL SCOPE
- 1.3.2 INCLUSIONS AND EXCLUSIONS
- 1.3.3 YEARS CONSIDERED
- 1.3.4 CURRENCY CONSIDERED
- 1.3.5 UNIT CONSIDERED
- 1.3.6 STAKEHOLDERS
- 1.4 SUMMARY OF CHANGES
2 RESEARCH METHODOLOGY
- 2.1 RESEARCH DATA
- 2.1.1 SECONDARY DATA
- 2.1.1.1 Key data from secondary sources
- 2.1.2 PRIMARY DATA
- 2.1.2.1 Key data from primary sources
- 2.1.1 SECONDARY DATA
- 2.2 MARKET SIZE ESTIMATION
- 2.3 DATA TRIANGULATION
- 2.4 RESEARCH ASSUMPTIONS
- 2.5 RISK ASSESSMENT
- 2.6 GROWTH RATE ASSUMPTIONS
3 EXECUTIVE SUMMARY
- 3.1 KEY INSIGHTS AND MARKET HIGHLIGHTS
- 3.2 KEY MARKET PARTICIPANTS: SHARE INSIGHTS AND STRATEGIC DEVELOPMENTS
- 3.3 HIGH-GROWTH SEGMENTS & EMERGING FRONTIERS
- 3.4 SNAPSHOT: ASIA PACIFIC MARKET SIZE AND FORECAST
4 PREMIUM INSIGHTS
- 4.1 ATTRACTIVE OPPORTUNITIES FOR PLAYERS IN CRANE RENTAL MARKET
- 4.2 CRANE RENTAL MARKET, BY TYPE AND REGION
- 4.3 CRANE RENTAL MARKET, BY WEIGHTLIFTING CAPACITY
- 4.4 CRANE RENTAL MARKET, BY END-USE INDUSTRY
- 4.5 CRANE RENTAL MARKET, BY COUNTRY
5 MARKET OVERVIEW
- 5.1 INTRODUCTION
- 5.2 MARKET DYNAMICS
- 5.2.1 DRIVERS
- 5.2.1.1 Rising offshore oil and gas development activities
- 5.2.1.2 Growing emphasis on smart city developments
- 5.2.1.3 Surge in construction and infrastructure projects
- 5.2.2 RESTRAINTS
- 5.2.2.1 Intense price wars and reduced profit margins creating barriers for new entrants
- 5.2.2.2 Fluctuating demand due to economic cycles
- 5.2.2.3 High maintenance and operational costs for rental companies
- 5.2.3 OPPORTUNITIES
- 5.2.3.1 Expansion in emerging economies
- 5.2.3.2 Technological advancements and digitalization
- 5.2.3.3 Expanding wind energy sector
- 5.2.4 CHALLENGES
- 5.2.4.1 Volatility in raw material and fuel prices
- 5.2.4.2 Shortage of skilled workforce
- 5.2.1 DRIVERS
- 5.3 UNMET NEEDS AND WHITE SPACES
- 5.3.1 UNMET NEEDS IN CRANE RENTAL MARKET
- 5.3.1.1 Greater availability of specialized and high-capacity cranes
- 5.3.1.2 Digitalization and fleet management systems
- 5.3.1.3 Improved service, maintenance, and technical support
- 5.3.1.4 Flexible and transparent pricing models
- 5.3.1.5 Skilled operators and safety assurance
- 5.3.2 WHITE SPACE OPPORTUNITIES
- 5.3.2.1 Expansion into emerging and underserved markets
- 5.3.2.2 Green and sustainable crane fleets
- 5.3.2.3 Digital platforms and smart fleet management
- 5.3.2.4 Enhanced value-added services
- 5.3.2.5 Integrated lifting and project solutions
- 5.3.1 UNMET NEEDS IN CRANE RENTAL MARKET
- 5.4 INTERCONNECTED MARKETS AND CROSS-SECTOR OPPORTUNITIES
- 5.4.1 INTERCONNECTED MARKETS
- 5.4.2 CROSS-SECTOR OPPORTUNITIES
- 5.4.3 STRATEGIC MOVES BY TIER 1/2/3 PLAYERS
- 5.4.4 KEY MOVES AND STRATEGIC FOCUS
6 INDUSTRY TRENDS
- 6.1 PORTER'S FIVE FORCES' ANALYSIS
- 6.1.1 THREAT OF NEW ENTRANTS
- 6.1.2 THREAT OF SUBSTITUTES
- 6.1.3 BARGAINING POWER OF SUPPLIERS
- 6.1.4 BARGAINING POWER OF BUYERS
- 6.1.5 INTENSITY OF COMPETITIVE RIVALRY
- 6.2 MACROECONOMIC ANALYSIS
- 6.2.1 INTRODUCTION
- 6.2.2 GDP TRENDS AND FORECASTS
- 6.2.3 URBANIZATION AND DEMOGRAPHIC SHIFTS
- 6.2.4 TRADE AND GLOBAL SUPPLY CHAIN DYNAMICS
- 6.3 VALUE CHAIN ANALYSIS
- 6.4 ECOSYSTEM ANALYSIS
- 6.5 PRICING ANALYSIS
- 6.5.1 AVERAGE SELLING PRICE TREND OF KEY PLAYERS, BY END-USE INDUSTRY
- 6.5.2 AVERAGE SELLING PRICE TREND, BY REGION
- 6.6 TRADE ANALYSIS
- 6.6.1 IMPORT SCENARIO
- 6.6.2 EXPORT SCENARIO
- 6.7 KEY CONFERENCES AND EVENTS, 2025-2026
- 6.8 TRENDS/DISRUPTIONS IMPACTING CUSTOMER BUSINESS
- 6.9 INVESTMENT AND FUNDING SCENARIO
- 6.10 CASE STUDY ANALYSIS
- 6.10.1 INSTALLATION OF 7MW WIND MACHINE HOUSING IN SINGLE LIFT
- 6.10.2 PAPERPAK'S REFINED BAG FOR HARPER, INC. TO MEET SUSTAINABILITY DEMAND
- 6.10.3 GAS-FIRED POWER PLANT MAINTENANCE PROJECT: MAMMOET'S SUCCESS IN MINIMIZING DOWNTIME
- 6.11 IMPACT OF 2025 US TARIFF ON CRANE RENTAL MARKET
- 6.11.1 INTRODUCTION
- 6.11.2 KEY TARIFF RATES
- 6.11.3 PRICE IMPACT ANALYSIS
- 6.11.4 KEY IMPACT ON VARIOUS REGIONS
- 6.11.5 IMPACT ON END-USE INDUSTRIES
7 STRATEGIC DISRUPTION THROUGH TECHNOLOGY, PATENTS, DIGITAL, AND AI ADOPTIONS
- 7.1 KEY TECHNOLOGIES
- 7.1.1 TELEMATICS SYSTEMS (FLEET OPTIMIZATION)
- 7.1.2 IOT SENSORS (PREDICTIVE MAINTENANCE)
- 7.1.3 DIGITAL PLATFORMS AND SOFTWARE SOLUTIONS (CUSTOMER SERVICE EXCELLENCE)
- 7.2 COMPLEMENTARY TECHNOLOGIES
- 7.2.1 ELECTRIC AND HYBRID CRANES
- 7.2.2 SIMULATOR-BASED TRAINING SYSTEMS
- 7.2.3 DIGITAL SAFETY TOOLS
- 7.2.4 SUSTAINABLE AND ECO-FRIENDLY LIFTING EQUIPMENT (GREEN CRANES)
- 7.3 ADJACENT TECHNOLOGIES
- 7.3.1 REMOTE MONITORING SYSTEM
- 7.3.2 AUTOMATED LIFTING SYSTEMS
- 7.4 TECHNOLOGY/PRODUCT ROADMAP
- 7.4.1 SHORT-TERM (2025-2027) | DIGITAL TRANSITION AND FLEET OPTIMIZATION PHASE
- 7.4.2 MID-TERM (2027-2030): SUSTAINABLE FLEETS AND SMART CONSTRUCTION INTEGRATION
- 7.4.3 LONG-TERM (2030-2035+): FULLY AUTOMATED, INTELLIGENT, AND SUSTAINABLE LIFTING ECOSYSTEMS
- 7.5 PATENT ANALYSIS
- 7.5.1 INTRODUCTION
- 7.5.2 APPROACH
- 7.5.3 TOP APPLICANTS
- 7.6 FUTURE APPLICATIONS
- 7.6.1 FULLY AUTOMATED AND INTELLIGENT CRANE RENTAL SYSTEMS
- 7.7 IMPACT OF AI/GEN AI ON CRANE RENTAL MARKET
- 7.7.1 TOP USE CASES AND MARKET POTENTIAL
- 7.7.2 BEST PRACTICES IN CRANE RENTAL
- 7.7.3 CASE STUDIES OF AI IMPLEMENTATION IN CRANE RENTAL MARKET
- 7.7.4 INTERCONNECTED ADJACENT ECOSYSTEM AND IMPACT ON MARKET PLAYERS
- 7.7.5 CLIENTS' READINESS TO ADOPT GENERATIVE AI IN CRANE RENTAL MARKET
- 7.8 SUCCESS STORIES AND REAL-WORLD APPLICATIONS
- 7.8.1 DEEP SOUTH DELIVERS SEAMLESS EXECUTION IN SOUTHEAST PETROCHEMICAL TURNAROUND
- 7.8.2 LAMPSON INTERNATIONAL DEMONSTRATES EXCEPTIONAL PERFORMANCE IN SEATTLE HOTEL CONSTRUCTION PROJECT
8 SUSTAINABILITY AND REGULATORY LANDSCAPE
- 8.1 REGIONAL REGULATIONS AND COMPLIANCE
- 8.1.1 REGULATORY BODIES, GOVERNMENT AGENCIES, AND OTHER ORGANIZATIONS
- 8.1.2 INDUSTRY STANDARDS
- 8.2 SUSTAINABILITY INITIATIVES
- 8.2.1 CARBON IMPACT AND ECO-APPLICATIONS OF CRANE RENTAL
- 8.2.1.1 Carbon Impact Reduction
- 8.2.1.2 Eco-Applications
- 8.2.1 CARBON IMPACT AND ECO-APPLICATIONS OF CRANE RENTAL
- 8.3 SUSTAINABILITY IMPACT AND REGULATORY POLICY INITIATIVES
- 8.4 CERTIFICATIONS, LABELING, ECO-STANDARDS
9 CUSTOMER LANDSCAPE & BUYER BEHAVIOR
- 9.1 DECISION-MAKING PROCESS
- 9.2 BUYER STAKEHOLDERS AND BUYING EVALUATION CRITERIA
- 9.2.1 KEY STAKEHOLDERS IN BUYING PROCESS
- 9.2.2 BUYING CRITERIA
- 9.3 ADOPTION BARRIERS & INTERNAL CHALLENGES
- 9.4 UNMET NEEDS FROM VARIOUS END-USE INDUSTRIES
- 9.5 MARKET PROFITIBILITY
- 9.5.1 REVENUE POTENTIAL
- 9.5.2 COST DYNAMICS
- 9.5.3 MARGIN OPPORTUNITIES, BY APPLICATION
10 CRANE RENTAL MARKET, BY TYPE
- 10.1 INTRODUCTION
- 10.2 FIXED CRANES
- 10.2.1 HIGH STABILITY, HEIGHT, AND LIFTING POWER TO DRIVE DEMAND
- 10.3 MOBILE CRANES
- 10.3.1 UNMATCHED MOBILITY, VERSATILITY, AND ADAPTABILITY ACROSS JOB SITES TO DRIVE DEMAND
11 CRANE RENTAL MARKET, BY WEIGHTLIFTING CAPACITY
- 11.1 INTRODUCTION
- 11.2 LOW
- 11.2.1 SUITABILITY FOR WIDE ARRAY OF TASKS IN VARIOUS INDUSTRIES TO FUEL MARKET GROWTH
- 11.3 LOW TO MEDIUM
- 11.3.1 AFFORDABILITY AND VERSATILITY FOR WIDE RANGE OF APPLICATIONS TO DRIVE MARKET
- 11.4 HEAVY
- 11.4.1 ADOPTION IN INTRICATE AND SPECIALIZED APPLICATIONS TO DRIVE DEMAND
- 11.5 EXTREME HEAVY
- 11.5.1 DEMAND FOR PRECISE, EFFICIENT, AND SAFE HANDLING IN CONSTRUCTION AND ENERGY SECTORS TO DRIVE MARKET
12 CRANE RENTAL MARKET, BY END-USE INDUSTRY
- 12.1 INTRODUCTION
- 12.2 BUILDING & CONSTRUCTION
- 12.2.1 RESIDENTIAL CONSTRUCTION
- 12.2.1.1 Growing preference for rental over ownership of cranes to drive market
- 12.2.2 COMMERCIAL CONSTRUCTION
- 12.2.2.1 Need to reduce downtime and improve project efficiency to drive market
- 12.2.1 RESIDENTIAL CONSTRUCTION
- 12.3 INFRASTRUCTURE
- 12.3.1 IMPLEMENTATION OF VARIOUS INFRASTRUCTURE PROJECTS IN MAJOR ECONOMIES TO FUEL MARKET GROWTH
- 12.4 OIL & GAS
- 12.4.1 EXPANSION OF OIL & GAS SECTOR TO FUEL SEGMENTAL GROWTH
- 12.5 ENERGY & POWER
- 12.5.1 ONGOING RENEWABLE ENERGY SECTOR EXPANSION TO DRIVE MARKET GROWTH
- 12.6 MARINE & OFFSHORE
- 12.6.1 GROWING EMPHASIS ON OFFSHORE WIND FARMS AND RENEWABLE ENERGY PROJECTS TO DRIVE DEMAND
- 12.7 MINING & EXCAVATION
- 12.7.1 REQUIREMENT FOR SPECIALIZED LIFTING SOLUTIONS IN REMOTE AND CHALLENGING TERRAINS TO FUEL DEMAND
- 12.8 TRANSPORTATION
- 12.8.1 INFRASTRUCTURE DEVELOPMENT ACTIVITIES IN MAJOR ECONOMIES TO SUPPORT MARKET GROWTH
- 12.9 OTHER END-USE INDUSTRIES
13 CRANE RENTAL MARKET, BY REGION
- 13.1 INTRODUCTION
- 13.2 ASIA PACIFIC
- 13.2.1 CHINA
- 13.2.1.1 Rapid infrastructure expansion and industrial modernization to drive market
- 13.2.2 INDIA
- 13.2.2.1 Government infrastructure programs and urban development to drive market
- 13.2.3 JAPAN
- 13.2.3.1 Urban development and reconstruction to drive market
- 13.2.4 SOUTH KOREA
- 13.2.4.1 Growth of construction and energy sectors to drive market
- 13.2.5 AUSTRALIA
- 13.2.5.1 Expansion of modern retail and convenience stores to drive market
- 13.2.6 REST OF ASIA PACIFIC
- 13.2.1 CHINA
- 13.3 NORTH AMERICA
- 13.3.1 US
- 13.3.1.1 Increasing implementation of infrastructure, energy, and urban development projects to propel market
- 13.3.2 CANADA
- 13.3.2.1 Growing infrastructure, energy, and offshore development activities to drive market
- 13.3.3 MEXICO
- 13.3.3.1 Expanding construction and energy infrastructure activities driving market growth
- 13.3.1 US
- 13.4 EUROPE
- 13.4.1 GERMANY
- 13.4.1.1 Increase in construction and infrastructure investments to drive market
- 13.4.2 FRANCE
- 13.4.2.1 Implementation of construction and infrastructure modernization initiatives to fuel demand
- 13.4.3 UK
- 13.4.3.1 Expanding infrastructure and urban development projects to support market growth
- 13.4.4 ITALY
- 13.4.4.1 Infrastructure and offshore energy projects to augment market growth
- 13.4.5 SPAIN
- 13.4.5.1 Urban renewal and tourism-led construction growth to drive demand
- 13.4.6 SWEDEN
- 13.4.6.1 Strong infrastructure investments and sustainable construction initiatives to drive market
- 13.4.7 AUSTRIA
- 13.4.7.1 Expansion of urban infrastructure and regulatory framework supporting crane rental growth
- 13.4.8 SWITZERLAND
- 13.4.8.1 Steady industrial growth and technological advancements to drive market
- 13.4.9 REST OF EUROPE
- 13.4.1 GERMANY
- 13.5 MIDDLE EAST & AFRICA
- 13.5.1 GCC COUNTRIES
- 13.5.1.1 Saudi Arabia
- 13.5.1.1.1 Development of mega infrastructure and offshore energy projects to drive market
- 13.5.1.2 UAE
- 13.5.1.2.1 Economic diversification and expansion of large-scale energy and infrastructure projects to drive market
- 13.5.1.3 Rest of GCC countries
- 13.5.1.1 Saudi Arabia
- 13.5.2 SOUTH AFRICA
- 13.5.2.1 Large-scale infrastructure development and expanding industrial projects strengthening crane rental demand
- 13.5.3 REST OF MIDDLE EAST & AFRICA
- 13.5.1 GCC COUNTRIES
- 13.6 SOUTH AMERICA
- 13.6.1 BRAZIL
- 13.6.1.1 Increase in construction and offshore energy development activities fueling demand
- 13.6.2 ARGENTINA
- 13.6.2.1 Significant infrastructure development to support market growth
- 13.6.3 REST OF SOUTH AMERICA
- 13.6.1 BRAZIL
14 COMPETITIVE LANDSCAPE
- 14.1 OVERVIEW
- 14.2 KEY PLAYER STRATEGIES'/RIGHT TO WIN
- 14.3 REVENUE ANALYSIS
- 14.4 MARKET SHARE ANALYSIS
- 14.5 COMPANY VALUATION AND FINANCIAL METRICS
- 14.6 BRAND/PRODUCT COMPARISON
- 14.7 COMPANY EVALUATION MATRIX: KEY PLAYERS, 2024
- 14.7.1 STARS
- 14.7.2 EMERGING LEADERS
- 14.7.3 PERVASIVE PLAYERS
- 14.7.4 PARTICIPANTS
- 14.7.5 COMPANY FOOTPRINT: KEY PLAYERS, 2024
- 14.7.5.1 Company footprint
- 14.7.5.2 Region footprint
- 14.7.5.3 Type footprint
- 14.7.5.4 Weightlifting capacity footprint
- 14.7.5.5 End-use industry footprint
- 14.8 COMPANY EVALUATION MATRIX: STARTUPS/SMES, 2024
- 14.8.1 PROGRESSIVE COMPANIES
- 14.8.2 RESPONSIVE COMPANIES
- 14.8.3 DYNAMIC COMPANIES
- 14.8.4 STARTING BLOCKS
- 14.8.5 COMPETITIVE BENCHMARKING: STARTUPS/SMES, 2024
- 14.8.5.1 Detailed list of key startups/SMEs
- 14.8.5.2 Competitive benchmarking of key startups/SMEs
- 14.9 COMPETITIVE SCENARIO
- 14.9.1 PRODUCT LAUNCHES
- 14.9.2 DEALS
- 14.9.3 EXPANSIONS
- 14.9.4 OTHER DEVELOPMENTS
15 COMPANY PROFILES
- 15.1 KEY PLAYERS
- 15.1.1 UNITED RENTALS, INC.
- 15.1.1.1 Business overview
- 15.1.1.2 Products/Solutions/Services offered
- 15.1.1.3 Recent developments
- 15.1.1.3.1 Deals
- 15.1.1.3.2 Other developments
- 15.1.1.4 MnM view
- 15.1.1.4.1 Key strengths
- 15.1.1.4.2 Strategic choices
- 15.1.1.4.3 Weaknesses and competitive threats
- 15.1.2 LIEBHERR
- 15.1.2.1 Business overview
- 15.1.2.2 Products/Solutions/Services offered
- 15.1.2.3 Recent developments
- 15.1.2.3.1 Product launches
- 15.1.2.3.2 Deals
- 15.1.2.4 MnM view
- 15.1.2.4.1 Key strengths
- 15.1.2.4.2 Strategic choices
- 15.1.2.4.3 Weaknesses and competitive threats
- 15.1.3 PALFINGER AG
- 15.1.3.1 Business overview
- 15.1.3.2 Products/Solutions/Services offered
- 15.1.3.3 Recent developments
- 15.1.3.3.1 Product launches
- 15.1.3.4 MnM view
- 15.1.3.4.1 Key strengths
- 15.1.3.4.2 Strategic choices
- 15.1.3.4.3 Weaknesses and competitive threats
- 15.1.4 SARENS NV
- 15.1.4.1 Business overview
- 15.1.4.2 Products/Solutions/Services offered
- 15.1.4.3 Recent developments
- 15.1.4.3.1 Product launches
- 15.1.4.3.2 Deals
- 15.1.4.3.3 Expansions
- 15.1.4.4 MnM view
- 15.1.4.4.1 Key strengths
- 15.1.4.4.2 Strategic choices
- 15.1.4.4.3 Weaknesses and competitive threats
- 15.1.5 MAMMOET
- 15.1.5.1 Business overview
- 15.1.5.2 Products/Solutions/Services offered
- 15.1.5.3 Recent developments
- 15.1.5.3.1 Product launches
- 15.1.5.3.2 Deals
- 15.1.5.4 MnM view
- 15.1.5.4.1 Key strengths
- 15.1.5.4.2 Strategic choices
- 15.1.5.4.3 Weaknesses and competitive threats
- 15.1.6 THE MANITOWOC COMPANY INC.
- 15.1.6.1 Business overview
- 15.1.6.2 Products/Solutions/Services offered
- 15.1.6.3 Recent developments
- 15.1.6.3.1 Deals
- 15.1.6.4 MnM view
- 15.1.6.4.1 Key strengths
- 15.1.6.4.2 Strategic choices
- 15.1.6.4.3 Weaknesses and competitive threats
- 15.1.7 MAXIM CRANE WORKS
- 15.1.7.1 Business overview
- 15.1.7.2 Products/Solutions/Services offered
- 15.1.7.3 Recent developments
- 15.1.7.3.1 Deals
- 15.1.7.4 MnM view
- 15.1.7.4.1 Key strengths
- 15.1.7.4.2 Strategic choices
- 15.1.7.4.3 Weaknesses and competitive threats
- 15.1.8 ACTION CONSTRUCTION EQUIPMENT LTD.
- 15.1.8.1 Business overview
- 15.1.8.2 Products/Solutions/Services offered
- 15.1.8.3 MnM view
- 15.1.8.3.1 Key strengths
- 15.1.8.3.2 Strategic choices
- 15.1.8.3.3 Weaknesses and competitive threats
- 15.1.9 LEAVITT CRANES
- 15.1.9.1 Business overview
- 15.1.9.2 Products/Solutions/Services offered
- 15.1.9.3 MnM view
- 15.1.9.3.1 Right to win
- 15.1.9.3.2 Strategic choices
- 15.1.9.3.3 Weaknesses and competitive threats
- 15.1.10 WASEL GMBH
- 15.1.10.1 Business overview
- 15.1.10.2 Products/Solutions/Services offered
- 15.1.10.3 Recent developments
- 15.1.10.3.1 Deals
- 15.1.10.4 MnM view
- 15.1.10.4.1 Right to win
- 15.1.10.4.2 Strategic choices
- 15.1.10.4.3 Weaknesses and competitive threats
- 15.1.1 UNITED RENTALS, INC.
- 15.2 OTHER PLAYERS
- 15.2.1 WELDEX (INTERNATIONAL) OFFSHORE LTD.
- 15.2.2 MEDIACO GROUP
- 15.2.3 BUCKNER HEAVYLIFT CRANES, LLC
- 15.2.4 VMS EQUIPMENT
- 15.2.5 DAIKYO KENKI CO., LTD.
- 15.2.6 EUROGRUAS
- 15.2.7 SHINSEI MACHINERY CO., LTD.
- 15.2.8 AMERICAN CRANE RENTAL, INC.
- 15.2.9 SANGHVI MOVERS LIMITED
- 15.2.10 DEEP SOUTH CRANE & RIGGING LLC
- 15.2.11 STARLOG ENTERPRISES LIMITED
- 15.2.12 MYCRANE
- 15.2.13 LAMPSON INTERNATIONAL LLC
- 15.2.14 IMPERIAL CRANES
- 15.2.15 BKL BAUKRAN LOGISTIK GMBH
16 APPENDIX
- 16.1 DISCUSSION GUIDE
- 16.2 KNOWLEDGESTORE: MARKETSANDMARKETS' SUBSCRIPTION PORTAL
- 16.3 CUSTOMIZATION OPTIONS
- 16.4 RELATED REPORTS
- 16.5 AUTHOR DETAILS
List of Tables
- TABLE 1 CRANE RENTAL MARKET: IMPACT OF PORTER'S FIVE FORCES ANALYSIS
- TABLE 2 GLOBAL GDP GROWTH PROJECTION, 2021-2028 (USD TRILLION)
- TABLE 3 CRANE RENTAL MARKET: ROLE OF COMPANIES IN ECOSYSTEM
- TABLE 4 AVERAGE SELLING PRICE OF CRANE RENTAL OFFERED BY KEY PLAYERS, BY END-USE INDUSTRY, 2024 (USD/UNIT)
- TABLE 5 AVERAGE SELLING PRICE TREND OF CRANE RENTAL, BY REGION, 2024-2030 (USD/UNIT)
- TABLE 6 IMPORT DATA FOR HS CODE 8426-COMPLIANT PRODUCTS, BY COUNTRY, 2020-2024 (USD MILLION)
- TABLE 7 EXPORT DATA FOR HS CODE 8426-COMPLIANT PRODUCTS, BY COUNTRY, 2020-2024 (USD MILLION)
- TABLE 8 CRANE RENTAL MARKET: LIST OF KEY CONFERENCES AND EVENTS, 2025-2026
- TABLE 9 RENTAL CRANE MARKET: LIST OF MAJOR PATENTS: 2024
- TABLE 10 TOP USE CASES AND MARKET POTENTIAL
- TABLE 11 BEST PRACTICES: COMPANIES IMPLEMENTING USE CASES
- TABLE 12 CRANE RENTAL MARKET: CASE STUDIES RELATED TO GEN AI IMPLEMENTATION
- TABLE 13 NORTH AMERICA: REGULATORY BODIES, GOVERNMENT AGENCIES, AND OTHER ORGANIZATIONS
- TABLE 14 EUROPE: REGULATORY BODIES, GOVERNMENT AGENCIES, AND OTHER ORGANIZATIONS
- TABLE 15 ASIA PACIFIC: REGULATORY BODIES, GOVERNMENT AGENCIES, AND OTHER ORGANIZATIONS
- TABLE 16 SOUTH AMERICA: LIST OF REGULATORY BODIES, GOVERNMENT AGENCIES, AND OTHER ORGANIZATIONS
- TABLE 17 MIDDLE EAST & AFRICA: LIST OF REGULATORY BODIES, GOVERNMENT AGENCIES, AND OTHER ORGANIZATIONS
- TABLE 18 GLOBAL INDUSTRY STANDARDS IN CRANE RENTAL MARKET
- TABLE 19 CERTIFICATIONS, LABELING, ECO-STANDARDS IN CRANE RENTAL MARKET
- TABLE 20 INFLUENCE OF STAKEHOLDERS ON BUYING PROCESS FOR TOP THREE END-USE INDUSTRIES
- TABLE 21 KEY BUYING CRITERIA FOR TOP THREE END-USE INDUSTRIES
- TABLE 22 UNMET NEEDS IN CRANE RENTAL MARKET IN KEY END-USE INDUSTRIES
- TABLE 23 CRANE RENTAL MARKET, BY TYPE, 2021-2023 (USD MILLION)
- TABLE 24 CRANE RENTAL MARKET, BY TYPE, 2024-2030 (USD MILLION)
- TABLE 25 CRANE RENTAL MARKET, BY TYPE, 2021-2023 (UNITS)
- TABLE 26 CRANE RENTAL MARKET, BY TYPE, 2024-2030 (UNITS)
- TABLE 27 CRANE RENTAL MARKET, BY WEIGHTLIFTING CAPACITY, 2021-2023 (USD MILLION)
- TABLE 28 CRANE RENTAL MARKET, BY WEIGHTLIFTING CAPACITY, 2024-2030 (USD MILLION)
- TABLE 29 CRANE RENTAL MARKET, BY WEIGHTLIFTING CAPACITY, 2021-2023 (UNITS)
- TABLE 30 CRANE RENTAL MARKET, BY WEIGHTLIFTING CAPACITY, 2024-2030 (UNITS)
- TABLE 31 CRANE RENTAL MARKET, BY END-USE INDUSTRY, 2021-2023 (USD MILLION)
- TABLE 32 CRANE RENTAL MARKET, BY END-USE INDUSTRY, 2024-2030 (USD MILLION)
- TABLE 33 CRANE RENTAL MARKET, BY END-USE INDUSTRY, 2021-2023 (UNITS)
- TABLE 34 CRANE RENTAL MARKET, BY END-USE INDUSTRY, 2024-2030 (UNITS)
- TABLE 35 CRANE RENTAL MARKET, BY REGION, 2021-2023 (USD MILLION)
- TABLE 36 CRANE RENTAL MARKET, BY REGION, 2024-2030 (USD MILLION)
- TABLE 37 CRANE RENTAL MARKET, BY REGION, 2021-2023 (UNITS)
- TABLE 38 CRANE RENTAL MARKET, BY REGION, 2024-2030 (UNITS)
- TABLE 39 ASIA PACIFIC: CRANE RENTAL MARKET, BY COUNTRY, 2021-2023 (USD MILLION)
- TABLE 40 ASIA PACIFIC: CRANE RENTAL MARKET, BY COUNTRY, 2024-2030 (USD MILLION)
- TABLE 41 ASIA PACIFIC: CRANE RENTAL MARKET, BY COUNTRY, 2021-2023 (UNITS)
- TABLE 42 ASIA PACIFIC: CRANE RENTAL MARKET, BY COUNTRY, 2024-2030 (UNITS)
- TABLE 43 ASIA PACIFIC: CRANE RENTAL MARKET, BY TYPE, 2021-2023 (USD MILLION)
- TABLE 44 ASIA PACIFIC: CRANE RENTAL MARKET, BY TYPE, 2024-2030 (USD MILLION)
- TABLE 45 ASIA PACIFIC: CRANE RENTAL MARKET, BY TYPE, 2021-2023 (UNITS)
- TABLE 46 ASIA PACIFIC: CRANE RENTAL MARKET, BY TYPE, 2024-2030 (UNITS)
- TABLE 47 ASIA PACIFIC: CRANE RENTAL MARKET, BY WEIGHTLIFTING CAPACITY, 2021-2023 (USD MILLION)
- TABLE 48 ASIA PACIFIC: CRANE RENTAL MARKET, BY WEIGHTLIFTING CAPACITY, 2024-2030 (USD MILLION)
- TABLE 49 ASIA PACIFIC: CRANE RENTAL MARKET, BY WEIGHTLIFTING CAPACITY, 2021-2023 (UNITS)
- TABLE 50 ASIA PACIFIC: CRANE RENTAL MARKET, BY WEIGHTLIFTING CAPACITY, 2024-2030 (UNITS)
- TABLE 51 ASIA PACIFIC: CRANE RENTAL MARKET, BY END-USE INDUSTRY, 2021-2023 (USD MILLION)
- TABLE 52 ASIA PACIFIC: CRANE RENTAL MARKET, BY END-USE INDUSTRY, 2024-2030 (USD MILLION)
- TABLE 53 ASIA PACIFIC: CRANE RENTAL MARKET, BY END-USE INDUSTRY, 2021-2023 (UNITS)
- TABLE 54 ASIA PACIFIC: CRANE RENTAL MARKET, BY END-USE INDUSTRY, 2024-2030 (UNITS)
- TABLE 55 CHINA: CRANE RENTAL MARKET, BY END-USE INDUSTRY, 2021-2023 (USD MILLION)
- TABLE 56 CHINA: CRANE RENTAL MARKET, BY END-USE INDUSTRY, 2024-2030 (USD MILLION)
- TABLE 57 CHINA: CRANE RENTAL MARKET, BY END-USE INDUSTRY, 2021-2023 (UNITS)
- TABLE 58 CHINA: CRANE RENTAL MARKET, BY END-USE INDUSTRY, 2024-2030 UNITS)
- TABLE 59 INDIA: CRANE RENTAL MARKET, BY END-USE INDUSTRY, 2021-2023 (USD MILLION)
- TABLE 60 INDIA: CRANE RENTAL MARKET, BY END-USE INDUSTRY, 2024-2030 (USD MILLION)
- TABLE 61 INDIA: CRANE RENTAL MARKET, BY END-USE INDUSTRY, 2021-2023 (UNITS)
- TABLE 62 INDIA: CRANE RENTAL MARKET, BY END-USE INDUSTRY, 2024-2030 (UNITS)
- TABLE 63 JAPAN: CRANE RENTAL MARKET, BY END-USE INDUSTRY, 2021-2023 (USD MILLION)
- TABLE 64 JAPAN: CRANE RENTAL MARKET, BY END-USE INDUSTRY, 2024-2030 (USD MILLION)
- TABLE 65 JAPAN: CRANE RENTAL MARKET, BY END-USE INDUSTRY, 2021-2023 (UNITS)
- TABLE 66 JAPAN: CRANE RENTAL MARKET, BY END-USE INDUSTRY, 2024-2030 (UNITS)
- TABLE 67 SOUTH KOREA: CRANE RENTAL MARKET, BY END-USE INDUSTRY, 2021-2023 (USD MILLION)
- TABLE 68 SOUTH KOREA: CRANE RENTAL MARKET, BY END-USE INDUSTRY, 2024-2030 (USD MILLION)
- TABLE 69 SOUTH KOREA: CRANE RENTAL MARKET, BY END-USE INDUSTRY, 2021-2023 (UNITS)
- TABLE 70 SOUTH KOREA: CRANE RENTAL MARKET, BY END-USE INDUSTRY, 2024-2030 (UNITS)
- TABLE 71 AUSTRLIA: CRANE RENTAL MARKET, BY END-USE INDUSTRY, 2021-2023 (USD MILLION)
- TABLE 72 AUSTRLIA: CRANE RENTAL MARKET, BY END-USE INDUSTRY, 2024-2030 (USD MILLION)
- TABLE 73 AUSTRLIA: CRANE RENTAL MARKET, BY END-USE INDUSTRY, 2021-2023 (UNITS)
- TABLE 74 AUSTRLIA: CRANE RENTAL MARKET, BY END-USE INDUSTRY, 2024-2030 (UNITS)
- TABLE 75 REST OF ASIA PACIFIC: CRANE RENTAL MARKET, BY END-USE INDUSTRY, 2021-2023 (USD MILLION)
- TABLE 76 REST OF ASIA PACIFIC: CRANE RENTAL MARKET, BY END-USE INDUSTRY, 2024-2030 (USD MILLION)
- TABLE 77 REST OF ASIA PACIFIC: CRANE RENTAL MARKET, BY END-USE INDUSTRY, 2021-2023 (UNITS)
- TABLE 78 REST OF ASIA PACIFIC: CRANE RENTAL MARKET, BY END-USE INDUSTRY, 2024-2030 (UNITS)
- TABLE 79 NORTH AMERICA: CRANE RENTAL MARKET, BY COUNTRY, 2021-2023 (USD MILLION)
- TABLE 80 NORTH AMERICA: CRANE RENTAL MARKET, BY COUNTRY, 2024-2030 (USD MILLION)
- TABLE 81 NORTH AMERICA: CRANE RENTAL MARKET, BY COUNTRY, 2021-2023 (UNITS)
- TABLE 82 NORTH AMERICA: CRANE RENTAL MARKET, BY COUNTRY, 2024-2030 (UNITS)
- TABLE 83 NORTH AMERICA: CRANE RENTAL MARKET, BY TYPE, 2021-2023 (USD MILLION)
- TABLE 84 NORTH AMERICA: CRANE RENTAL MARKET, BY TYPE, 2024-2030 (USD MILLION)
- TABLE 85 NORTH AMERICA: CRANE RENTAL MARKET, BY TYPE, 2021-2023 (UNITS)
- TABLE 86 NORTH AMERICA: CRANE RENTAL MARKET, BY TYPE, 2024-2030 UNITS)
- TABLE 87 NORTH AMERICA: CRANE RENTAL MARKET, BY WEIGHTLIFTING CAPACITY, 2021-2023 (USD MILLION)
- TABLE 88 NORTH AMERICA: CRANE RENTAL MARKET, BY WEIGHTLIFTING CAPACITY, 2024-2030 (USD MILLION)
- TABLE 89 NORTH AMERICA: CRANE RENTAL MARKET, BY WEIGHTLIFTING CAPACITY, 2021-2023 (UNITS)
- TABLE 90 NORTH AMERICA: CRANE RENTAL MARKET, BY WEIGHTLIFTING CAPACITY, 2024-2030 (UNITS)
- TABLE 91 NORTH AMERICA: CRANE RENTAL MARKET, BY END-USE INDUSTRY, 2021-2023 (USD MILLION)
- TABLE 92 NORTH AMERICA: CRANE RENTAL MARKET, BY END-USE INDUSTRY, 2024-2030 (USD MILLION)
- TABLE 93 NORTH AMERICA: CRANE RENTAL MARKET, BY END-USE INDUSTRY, 2021-2023 (UNITS)
- TABLE 94 NORTH AMERICA: CRANE RENTAL MARKET, BY END-USE INDUSTRY, 2024-2030 (UNITS)
- TABLE 95 US: CRANE RENTAL MARKET, BY END-USE INDUSTRY, 2021-2023 (USD MILLION)
- TABLE 96 US: CRANE RENTAL MARKET, BY END-USE INDUSTRY, 2024-2030 (USD MILLION)
- TABLE 97 US: CRANE RENTAL MARKET, BY END-USE INDUSTRY, 2021-2023 (UNITS)
- TABLE 98 US: CRANE RENTAL MARKET, BY END-USE INDUSTRY, 2024-2030 (UNITS)
- TABLE 99 CANADA: CRANE RENTAL MARKET, BY END-USE INDUSTRY, 2021-2023 (USD MILLION)
- TABLE 100 CANADA: CRANE RENTAL MARKET, BY END-USE INDUSTRY, 2024-2030 (USD MILLION)
- TABLE 101 CANADA: CRANE RENTAL MARKET, BY END-USE INDUSTRY, 2021-2023 (UNITS)
- TABLE 102 CANADA: CRANE RENTAL MARKET, BY END-USE INDUSTRY, 2024-2030 (UNITS)
- TABLE 103 MEXICO: CRANE RENTAL MARKET, BY END-USE INDUSTRY, 2021-2023 (USD MILLION)
- TABLE 104 MEXICO: CRANE RENTAL MARKET, BY END-USE INDUSTRY, 2024-2030 (USD MILLION)
- TABLE 105 MEXICO: CRANE RENTAL MARKET, BY END-USE INDUSTRY, 2021-2023 (UNITS)
- TABLE 106 MEXICO: CRANE RENTAL MARKET, BY END-USE INDUSTRY, 2024-2030 UNITS)
- TABLE 107 EUROPE: CRANE RENTAL MARKET, BY COUNTRY, 2021-2023 (USD MILLION)
- TABLE 108 EUROPE: CRANE RENTAL MARKET, BY COUNTRY, 2024-2030 (USD MILLION)
- TABLE 109 EUROPE: CRANE RENTAL MARKET, BY COUNTRY, 2021-2023 (UNITS)
- TABLE 110 EUROPE: CRANE RENTAL MARKET, BY COUNTRY, 2024-2030 (UNITS)
- TABLE 111 EUROPE: CRANE RENTAL MARKET, BY TYPE, 2021-2023 (USD MILLION)
- TABLE 112 EUROPE: CRANE RENTAL MARKET, BY TYPE, 2024-2030 (USD MILLION)
- TABLE 113 EUROPE: CRANE RENTAL MARKET, BY TYPE, 2021-2023 (UNITS)
- TABLE 114 EUROPE: CRANE RENTAL MARKET, BY TYPE, 2024-2030 (UNITS)
- TABLE 115 EUROPE: CRANE RENTAL MARKET, BY WEIGHTLIFTING CAPACITY, 2021-2023 (USD MILLION)
- TABLE 116 EUROPE: CRANE RENTAL MARKET, BY WEIGHTLIFTING CAPACITY, 2024-2030 (USD MILLION)
- TABLE 117 EUROPE: CRANE RENTAL MARKET, BY WEIGHTLIFTING CAPACITY, 2021-2023 (UNITS)
- TABLE 118 EUROPE: CRANE RENTAL MARKET, BY WEIGHTLIFTING CAPACITY, 2024-2030 (UNITS)
- TABLE 119 EUROPE: CRANE RENTAL MARKET, BY END-USE INDUSTRY, 2021-2023 (USD MILLION)
- TABLE 120 EUROPE: CRANE RENTAL MARKET, BY END-USE INDUSTRY, 2024-2030 (USD MILLION)
- TABLE 121 EUROPE: CRANE RENTAL MARKET, BY END-USE INDUSTRY, 2021-2023 (UNITS)
- TABLE 122 EUROPE: CRANE RENTAL MARKET, BY END-USE INDUSTRY, 2024-2030 (UNITS)
- TABLE 123 GERMANY: CRANE RENTAL MARKET, BY END-USE INDUSTRY, 2021-2023 (USD MILLION)
- TABLE 124 GERMANY: CRANE RENTAL MARKET, BY END-USE INDUSTRY, 2024-2030 (USD MILLION)
- TABLE 125 GERMANY: CRANE RENTAL MARKET, BY END-USE INDUSTRY, 2021-2023 (UNITS)
- TABLE 126 GERMANY: CRANE RENTAL MARKET, BY END-USE INDUSTRY, 2024-2030 (UNITS)
- TABLE 127 FRANCE: CRANE RENTAL MARKET, BY END-USE INDUSTRY, 2021-2023 (USD MILLION)
- TABLE 128 FRANCE: CRANE RENTAL MARKET, BY END-USE INDUSTRY, 2024-2030 (USD MILLION)
- TABLE 129 FRANCE: CRANE RENTAL MARKET, BY END-USE INDUSTRY, 2021-2023 (UNITS)
- TABLE 130 FRANCE: CRANE RENTAL MARKET, BY END-USE INDUSTRY, 2024-2030 (UNITS)
- TABLE 131 UK: CRANE RENTAL MARKET, BY END-USE INDUSTRY, 2021-2023 (USD MILLION)
- TABLE 132 UK: CRANE RENTAL MARKET, BY END-USE INDUSTRY, 2024-2030 (USD MILLION)
- TABLE 133 UK: CRANE RENTAL MARKET, BY END-USE INDUSTRY, 2021-2023 (UNITS)
- TABLE 134 UK: CRANE RENTAL MARKET, BY END-USE INDUSTRY, 2024-2030 (UNITS)
- TABLE 135 ITALY: CRANE RENTAL MARKET, BY END-USE INDUSTRY, 2021-2023 (USD MILLION)
- TABLE 136 ITALY: CRANE RENTAL MARKET, BY END-USE INDUSTRY, 2024-2030 (USD MILLION)
- TABLE 137 ITALY: CRANE RENTAL MARKET, BY END-USE INDUSTRY, 2021-2023 (UNITS)
- TABLE 138 ITALY: CRANE RENTAL MARKET, BY END-USE INDUSTRY, 2024-2030 UNITS)
- TABLE 139 SPAIN: CRANE RENTAL MARKET, BY END-USE INDUSTRY, 2021-2023 (USD MILLION)
- TABLE 140 SPAIN: CRANE RENTAL MARKET, BY END-USE INDUSTRY, 2024-2030 (USD MILLION)
- TABLE 141 SPAIN: CRANE RENTAL MARKET, BY END-USE INDUSTRY, 2021-2023 UNITS)
- TABLE 142 SPAIN: CRANE RENTAL MARKET, BY END-USE INDUSTRY, 2024-2030 (UNITS)
- TABLE 143 SWEDEN: CRANE RENTAL MARKET, BY END-USE INDUSTRY, 2021-2023 (USD MILLION)
- TABLE 144 SWEDEN: CRANE RENTAL MARKET, BY END-USE INDUSTRY, 2024-2030 (USD MILLION)
- TABLE 145 SWEDEN: CRANE RENTAL MARKET, BY END-USE INDUSTRY, 2021-2023 (UNITS)
- TABLE 146 SWEDEN: CRANE RENTAL MARKET, BY END-USE INDUSTRY, 2024-2030 (UNITS)
- TABLE 147 AUSTRIA: CRANE RENTAL MARKET, BY END-USE INDUSTRY, 2021-2023 (USD MILLION)
- TABLE 148 AUSTRIA: CRANE RENTAL MARKET, BY END-USE INDUSTRY, 2024-2030 (USD MILLION)
- TABLE 149 AUSTRIA: CRANE RENTAL MARKET, BY END-USE INDUSTRY, 2021-2023 (UNITS)
- TABLE 150 AUSTRIA: CRANE RENTAL MARKET, BY END-USE INDUSTRY, 2024-2030 (UNITS)
- TABLE 151 SWITZERLAND: CRANE RENTAL MARKET, BY END-USE INDUSTRY, 2021-2023 (USD MILLION)
- TABLE 152 SWITZERLAND: CRANE RENTAL MARKET, BY END-USE INDUSTRY, 2024-2030 (USD MILLION)
- TABLE 153 SWITZERLAND: CRANE RENTAL MARKET, BY END-USE INDUSTRY, 2021-2023 (UNITS)
- TABLE 154 SWITZERLAND: CRANE RENTAL MARKET, BY END-USE INDUSTRY, 2024-2030 (UNITS)
- TABLE 155 REST OF EUROPE: CRANE RENTAL MARKET, BY END-USE INDUSTRY, 2021-2023 (USD MILLION)
- TABLE 156 REST OF EUROPE: CRANE RENTAL MARKET, BY END-USE INDUSTRY, 2024-2030 (USD MILLION)
- TABLE 157 REST OF EUROPE: CRANE RENTAL MARKET, BY END-USE INDUSTRY, 2021-2023 (UNITS)
- TABLE 158 REST OF EUROPE: CRANE RENTAL MARKET, BY END-USE INDUSTRY, 2024-2030 (UNITS)
- TABLE 159 MIDDLE EAST & AFRICA: CRANE RENTAL MARKET, BY COUNTRY, 2021-2023 (USD MILLION)
- TABLE 160 MIDDLE EAST & AFRICA: CRANE RENTAL MARKET, BY COUNTRY, 2024-2030 (USD MILLION)
- TABLE 161 MIDDLE EAST & AFRICA: CRANE RENTAL MARKET, BY COUNTRY, 2021-2023 (UNITS)
- TABLE 162 MIDDLE EAST & AFRICA: CRANE RENTAL MARKET, BY COUNTRY, 2024-2030 (UNITS)
- TABLE 163 MIDDLE EAST & AFRICA: CRANE RENTAL MARKET, BY TYPE, 2021-2023 (USD MILLION)
- TABLE 164 MIDDLE EAST & AFRICA: CRANE RENTAL MARKET, BY TYPE, 2024-2030 (USD MILLION)
- TABLE 165 MIDDLE EAST & AFRICA: CRANE RENTAL MARKET, BY TYPE, 2021-2023 (UNITS)
- TABLE 166 MIDDLE EAST & AFRICA: CRANE RENTAL MARKET, BY TYPE, 2024-2030 (UNITS)
- TABLE 167 MIDDLE EAST & AFRICA: CRANE RENTAL MARKET, BY WEIGHTLIFTING CAPACITY, 2021-2023 (USD MILLION)
- TABLE 168 MIDDLE EAST & AFRICA: CRANE RENTAL MARKET, BY WEIGHTLIFTING CAPACITY, 2024-2030 (USD MILLION)
- TABLE 169 MIDDLE EAST & AFRICA: CRANE RENTAL MARKET, BY WEIGHTLIFTING CAPACITY, 2021-2023 (UNITS)
- TABLE 170 MIDDLE EAST & AFRICA: CRANE RENTAL MARKET, BY WEIGHTLIFTING CAPACITY, 2024-2030 (UNITS)
- TABLE 171 MIDDLE EAST & AFRICA: CRANE RENTAL MARKET, BY END-USE INDUSTRY, 2021-2023 (USD MILLION)
- TABLE 172 MIDDLE EAST & AFRICA: CRANE RENTAL MARKET, BY END-USE INDUSTRY, 2024-2030 (USD MILLION)
- TABLE 173 MIDDLE EAST & AFRICA: CRANE RENTAL MARKET, BY END-USE INDUSTRY, 2021-2023 (UNITS)
- TABLE 174 MIDDLE EAST & AFRICA: CRANE RENTAL MARKET, BY END-USE INDUSTRY, 2024-2030 (UNITS)
- TABLE 175 GCC COUNTRIES: CRANE RENTAL MARKET, BY END-USE INDUSTRY, 2021-2023 (USD MILLION)
- TABLE 176 GCC COUNTRIES: CRANE RENTAL MARKET, BY END-USE INDUSTRY, 2024-2030 (USD MILLION)
- TABLE 177 GCC COUNTRIES: CRANE RENTAL MARKET, BY END-USE INDUSTRY, 2021-2023 (UNITS)
- TABLE 178 GCC COUNTRIES: CRANE RENTAL MARKET, BY END-USE INDUSTRY, 2024-2030 (UNITS)
- TABLE 179 SAUDI ARABIA: CRANE RENTAL MARKET, BY END-USE INDUSTRY, 2021-2023 (USD MILLION)
- TABLE 180 SAUDI ARABIA: CRANE RENTAL MARKET, BY END-USE INDUSTRY, 2024-2030 (USD MILLION)
- TABLE 181 SAUDI ARABIA: CRANE RENTAL MARKET, BY END-USE INDUSTRY, 2021-2023 (UNITS)
- TABLE 182 SAUDI ARABIA: CRANE RENTAL MARKET, BY END-USE INDUSTRY, 2024-2030 UNITS)
- TABLE 183 UAE: CRANE RENTAL MARKET, BY END-USE INDUSTRY, 2021-2023 (USD MILLION)
- TABLE 184 UAE: CRANE RENTAL MARKET, BY END-USE INDUSTRY, 2024-2030 (USD MILLION)
- TABLE 185 UAE: CRANE RENTAL MARKET, BY END-USE INDUSTRY, 2021-2023 UNITS)
- TABLE 186 UAE: CRANE RENTAL MARKET, BY END-USE INDUSTRY, 2024-2030 (UNITS)
- TABLE 187 REST OF GCC COUNTRIES: CRANE RENTAL MARKET, BY END-USE INDUSTRY, 2021-2023 (USD MILLION)
- TABLE 188 REST OF GCC COUNTRIES: CRANE RENTAL MARKET, BY END-USE INDUSTRY, 2024-2030 (USD MILLION)
- TABLE 189 REST OF GCC COUNTRIES: CRANE RENTAL MARKET, BY END-USE INDUSTRY, 2021-2023 (UNITS)
- TABLE 190 REST OF GCC COUNTRIES: CRANE RENTAL MARKET, BY END-USE INDUSTRY, 2024-2030 (UNITS)
- TABLE 191 SOUTH AFRICA: CRANE RENTAL MARKET, BY END-USE INDUSTRY, 2021-2023 (USD MILLION)
- TABLE 192 SOUTH AFRICA: CRANE RENTAL MARKET, BY END-USE INDUSTRY, 2024-2030 (USD MILLION)
- TABLE 193 SOUTH AFRICA: CRANE RENTAL MARKET, BY END-USE INDUSTRY, 2021-2023 (UNITS)
- TABLE 194 SOUTH AFRICA: CRANE RENTAL MARKET, BY END-USE INDUSTRY, 2024-2030 (UNITS)
- TABLE 195 REST OF MIDDLE EAST & AFRICA: CRANE RENTAL MARKET, BY END-USE INDUSTRY, 2021-2023 (USD MILLION)
- TABLE 196 REST OF MIDDLE EAST & AFRICA: CRANE RENTAL MARKET, BY END-USE INDUSTRY, 2024-2030 (USD MILLION)
- TABLE 197 REST OF MIDDLE EAST & AFRICA: CRANE RENTAL MARKET, BY END-USE INDUSTRY, 2021-2023 (UNITS)
- TABLE 198 REST OF MIDDLE EAST & AFRICA: CRANE RENTAL MARKET, BY END-USE INDUSTRY, 2024-2030 (UNITS)
- TABLE 199 SOUTH AMERICA: CRANE RENTAL MARKET, BY COUNTRY, 2021-2023 (USD MILLION)
- TABLE 200 SOUTH AMERICA: CRANE RENTAL MARKET, BY COUNTRY, 2024-2030 (USD MILLION)
- TABLE 201 SOUTH AMERICA: CRANE RENTAL MARKET, BY COUNTRY, 2021-2023 (UNITS)
- TABLE 202 SOUTH AMERICA: CRANE RENTAL MARKET, BY COUNTRY, 2024-2030 (UNITS)
- TABLE 203 SOUTH AMERICA: CRANE RENTAL MARKET, BY TYPE, 2021-2023 (USD MILLION)
- TABLE 204 SOUTH AMERICA: CRANE RENTAL MARKET, BY TYPE, 2024-2030 (USD MILLION)
- TABLE 205 SOUTH AMERICA: CRANE RENTAL MARKET, BY TYPE, 2021-2023 (UNITS)
- TABLE 206 SOUTH AMERICA: CRANE RENTAL MARKET, BY TYPE, 2024-2030 (UNITS)
- TABLE 207 SOUTH AMERICA: CRANE RENTAL MARKET, BY WEIGHTLIFTING CAPACITY, 2021-2023 (USD MILLION)
- TABLE 208 SOUTH AMERICA: CRANE RENTAL MARKET, BY WEIGHTLIFTING CAPACITY, 2024-2030 (USD MILLION)
- TABLE 209 SOUTH AMERICA: CRANE RENTAL MARKET, BY WEIGHTLIFTING CAPACITY, 2021-2023 (UNITS)
- TABLE 210 SOUTH AMERICA: CRANE RENTAL MARKET, BY WEIGHTLIFTING CAPACITY, 2024-2030 (UNITS)
- TABLE 211 SOUTH AMERICA: CRANE RENTAL MARKET, BY END-USE INDUSTRY, 2021-2023 (USD MILLION)
- TABLE 212 SOUTH AMERICA: CRANE RENTAL MARKET, BY END-USE INDUSTRY, 2024-2030 (USD MILLION)
- TABLE 213 SOUTH AMERICA: CRANE RENTAL MARKET, BY END-USE INDUSTRY, 2021-2023 (UNITS)
- TABLE 214 SOUTH AMERICA: CRANE RENTAL MARKET, BY END-USE INDUSTRY, 2024-2030 (UNITS)
- TABLE 215 BRAZIL: CRANE RENTAL MARKET, BY END-USE INDUSTRY, 2021-2023 (USD MILLION)
- TABLE 216 BRAZIL: CRANE RENTAL MARKET, BY END-USE INDUSTRY, 2024-2030 (USD MILLION)
- TABLE 217 BRAZIL: CRANE RENTAL MARKET, BY END-USE INDUSTRY, 2021-2023 (UNITS)
- TABLE 218 BRAZIL: CRANE RENTAL MARKET, BY END-USE INDUSTRY, 2024-2030 (UNITS)
- TABLE 219 ARGENTINA: CRANE RENTAL MARKET, BY END-USE INDUSTRY, 2021-2023 (USD MILLION)
- TABLE 220 ARGENTINA: CRANE RENTAL MARKET, BY END-USE INDUSTRY, 2024-2030 (USD MILLION)
- TABLE 221 ARGENTINA: CRANE RENTAL MARKET, BY END-USE INDUSTRY, 2021-2023 (UNITS)
- TABLE 222 ARGENTINA: CRANE RENTAL MARKET, BY END-USE INDUSTRY, 2024-2030 (UNITS)
- TABLE 223 REST OF SOUTH AMERICA: CRANE RENTAL MARKET, BY END-USE INDUSTRY, 2021-2023 (USD MILLION)
- TABLE 224 REST OF SOUTH AMERICA: CRANE RENTAL MARKET, BY END-USE INDUSTRY, 2024-2030 (USD MILLION)
- TABLE 225 REST OF SOUTH AMERICA: CRANE RENTAL MARKET, BY END-USE INDUSTRY, 2021-2023 (UNITS)
- TABLE 226 REST OF SOUTH AMERICA: CRANE RENTAL MARKET, BY END-USE INDUSTRY, 2024-2030 (UNITS)
- TABLE 227 CRANE RENTAL MARKET: OVERVIEW OF STRATEGIES ADOPTED BY KEY MARKET PLAYERS, JANUARY 2021 AND OCTOBER 2025
- TABLE 228 CRANE RENTAL MARKET: DEGREE OF COMPETITION
- TABLE 229 CRANE RENTAL MARKET: REGION FOOTPRINT
- TABLE 230 CRANE RENTAL MARKET: TYPE FOOTPRINT
- TABLE 231 CRANE RENTAL MARKET: WEIGHTLIFTING CAPACITY FOOTPRINT
- TABLE 232 CRANE RENTAL MARKET: END-USE INDUSTRY FOOTPRINT
- TABLE 233 CRANE RENTAL MARKET: DETAILED LIST OF KEY STARTUPS/SMES
- TABLE 234 CRANE RENTAL MARKET: COMPETITIVE BENCHMARKING OF KEY STARTUPS/SMES (1/2)
- TABLE 235 CRANE RENTAL MARKET: COMPETITIVE BENCHMARKING OF KEY STARTUPS/SMES (2/2)
- TABLE 236 CRANE RENTAL MARKET: PRODUCT LAUNCHES, JANUARY 2021-OCTOBER 2025
- TABLE 237 CRANE RENTAL MARKET: DEALS, JANUARY 2021-OCTOBER 2025
- TABLE 238 CRANE RENTAL MARKET: EXPANSIONS, JANUARY 2021-OCTOBER 2025
- TABLE 239 CRANE RENTAL MARKET: OTHER DEVELOPMENTS, JANUARY 2021-OCTOBER 2025
- TABLE 240 UNITED RENTALS, INC.: COMPANY OVERVIEW
- TABLE 241 UNITED RENTALS, INC.: PRODUCTS/SOLUTIONS/SERVICES OFFERED
- TABLE 242 UNITED RENTALS, INC.: DEALS
- TABLE 243 UNITED RENTALS, INC.: OTHER DEVELOPMENTS
- TABLE 244 LIEBHERR: COMPANY OVERVIEW
- TABLE 245 LIEBHERR: PRODUCTS/SOLUTIONS/SERVICES OFFERED
- TABLE 246 LIEBHERR: PRODUCT LAUNCHES
- TABLE 247 LIEBHERR: DEALS
- TABLE 248 PALFINGER AG: COMPANY OVERVIEW
- TABLE 249 PALFINGER AG: PRODUCTS/SOLUTIONS/SERVICES OFFERED
- TABLE 250 PALFINGER AG: PRODUCT LAUNCHES
- TABLE 251 SARENS NV: COMPANY OVERVIEW
- TABLE 252 SARENS NV: PRODUCTS/SOLUTIONS/SERVICES OFFERED
- TABLE 253 SARENS NV: PRODUCT LAUNCHES
- TABLE 254 SARENS NV: DEALS
- TABLE 255 SARENS NV: EXPANSIONS
- TABLE 256 MAMMOET: COMPANY OVERVIEW
- TABLE 257 MAMMOET: PRODUCTS/SOLUTIONS/SERVICES OFFERED
- TABLE 258 MAMMOET: PRODUCT LAUNCHES
- TABLE 259 MAMMOET: DEALS
- TABLE 260 THE MANITOWOC COMPANY INC.: COMPANY OVERVIEW
- TABLE 261 THE MANITOWOC COMPANY INC.: PRODUCTS/SOLUTIONS/SERVICES OFFERED
- TABLE 262 THE MANITOWOC COMPANY INC.: DEALS
- TABLE 263 MAXIM CRANE WORKS: COMPANY OVERVIEW
- TABLE 264 MAXIM CRANE WORKS: PRODUCTS/SOLUTIONS/SERVICES OFFERED
- TABLE 265 MAXIM CRANE WORKS: DEALS
- TABLE 266 ACTION CONSTRUCTION EQUIPMENT LTD.: COMPANY OVERVIEW
- TABLE 267 ACTION CONSTRUCTION EQUIPMENT LTD.: PRODUCTS/SOLUTIONS/ SERVICES OFFERED
- TABLE 268 LEAVITT CRANES: COMPANY OVERVIEW
- TABLE 269 LEAVITT CRANES: PRODUCTS/SOLUTIONS/SERVICES OFFERED
- TABLE 270 WASEL GMBH: COMPANY OVERVIEW
- TABLE 271 WASEL GMBH: PRODUCTS/SOLUTIONS/SERVICES OFFERED
- TABLE 272 WASEL GMBH: DEALS
- TABLE 273 WELDEX (INTERNATIONAL) OFFSHORE LTD.: COMPANY OVERVIEW
- TABLE 274 MEDIACO GROUP: COMPANY OVERVIEW
- TABLE 275 BUCKNER HEAVYLIFT CRANES, LLC: COMPANY OVERVIEW
- TABLE 276 VMS EQUIPMENT: COMPANY OVERVIEW
- TABLE 277 DAIKYO KENKI CO., LTD.: COMPANY OVERVIEW
- TABLE 278 EUROGRUAS: COMPANY OVERVIEW
- TABLE 279 SHINSEI MACHINERY CO., LTD.: COMPANY OVERVIEW
- TABLE 280 AMERICAN CRANE RENTAL, INC.: COMPANY OVERVIEW
- TABLE 281 SANGHVI MOVERS LIMITED: COMPANY OVERVIEW
- TABLE 282 DEEP SOUTH CRANE & RIGGING LLC: COMPANY OVERVIEW
- TABLE 283 STARLOG ENTERPRISES LIMITED: COMPANY OVERVIEW
- TABLE 284 MYCRANE: COMPANY OVERVIEW
- TABLE 285 LAMPSON INTERNATIONAL LLC: COMPANY OVERVIEW
- TABLE 286 IMPERIAL CRANES: COMPANY OVERVIEW
- TABLE 287 BKL BAUKRAN LOGISTIK GMBH: COMPANY OVERVIEW
List of Figures
- FIGURE 1 CRANE RENTAL MARKET SEGMENTATION AND REGIONAL SCOPE
- FIGURE 2 CRANE RENTAL MARKET: RESEARCH DESIGN
- FIGURE 3 STAKEHOLDERS INVOLVED AND BREAKDOWN OF PRIMARY INTERVIEWS
- FIGURE 4 MARKET SIZE ESTIMATION METHODOLOGY: REVENUE OF MARKET PLAYERS
- FIGURE 5 MARKET SIZE ESTIMATION: BOTTOM-UP APPROACH
- FIGURE 6 MARKET SIZE ESTIMATION: TOP-DOWN APPROACH
- FIGURE 7 CRANE RENTAL MARKET: DATA TRIANGULATION
- FIGURE 8 KEY INSIGHTS AND MARKET HIGHLIGHTS
- FIGURE 9 GLOBAL CRANE RENTAL MARKET, 2025-2030
- FIGURE 10 MAJOR STRATEGIES ADOPTED BY KEY PLAYERS IN CRANE RENTAL MARKET (2021-2025)
- FIGURE 11 HIGH-GROWTH SEGMENTS AND EMERGING FRONTIERS IN CRANE RENTAL MARKET, 2024
- FIGURE 12 ASIA PACIFIC TO REGISTER HIGHEST CAGR DURING FORECAST PERIOD
- FIGURE 13 EXPANSION OF INFRASTRUCTURE SECTOR TO CREATE LUCRATIVE OPPORTUNITIES FOR MARKET PLAYERS
- FIGURE 14 ASIA PACIFIC ACCOUNTED FOR LARGEST MARKET SHARE IN 2024
- FIGURE 15 LOW SEGMENT DOMINATED CRANE RENTAL MARKET IN 2024
- FIGURE 16 BUILDING & CONSTRUCTION SEGMENT ACCOUNTED FOR LARGEST SHARE OF CRANE RENTAL MARKET IN 2024
- FIGURE 17 INDIA TO REGISTER HIGHEST CAGR DURING FORECAST PERIOD
- FIGURE 18 CRANE RENTAL MARKET: DRIVERS, RESTRAINTS, OPPORTUNITIES, AND CHALLENGES
- FIGURE 19 NUMBER OF OIL & GAS EXTRACTION PROJECTS, BY REGION, 2016-2024
- FIGURE 20 OIL & GAS DISCOVERIES (MILLION BARRELS OF OIL EQUIVALENT), BY COUNTRY, 2023 & 2024
- FIGURE 21 GLOBAL FLOOR AREA AND BUILDINGS ENERGY INTENSITY IN NET ZERO SCENARIO, 2010-2030
- FIGURE 22 CRANE RENTAL MARKET: PORTER'S FIVE FORCES ANALYSIS
- FIGURE 23 NUMBER OF PEOPLE LIVING IN URBAN AND RURAL AREAS (GLOBAL), 2010-2024
- FIGURE 24 GLOBAL TRADE IN MERCHANDISE, 2014-2024
- FIGURE 25 CRANE RENTAL MARKET: VALUE CHAIN ANALYSIS
- FIGURE 26 OVERVIEW OF CRANE RENTAL VALUE CHAIN
- FIGURE 27 CRANE RENTAL MARKET: ECOSYSTEM ANALYSIS
- FIGURE 28 AVERAGE SELLING PRICE OF CRANE RENTAL OFFERED BY KEY PLAYERS, BY END-USE INDUSTRY, 2024
- FIGURE 29 AVERAGE SELLING PRICE TREND OF CRANE RENTAL BY REGION, 2024-2030
- FIGURE 30 IMPORT SCENARIO FOR HS CODE 8426-COMPLIANT PRODUCTS, BY COUNTRY, 2020-2024
- FIGURE 31 EXPORT SCENARIO FOR HS CODE 8426-COMPLIANT PRODUCTS, BY COUNTRY, 2020-2024
- FIGURE 32 TRENDS/DISRUPTIONS IMPACTING CUSTOMER BUSINESS
- FIGURE 33 INVESTMENT AND FUNDING SCENARIO, 2019-2024
- FIGURE 34 LIST OF MAJOR PATENTS RELATED TO RENTAL CRANE, 2015-2024
- FIGURE 35 REGIONAL ANALYSIS OF PATENTS GRANTED FOR RENTAL CRANE, 2015-2024
- FIGURE 36 CRANE RENTAL MARKET: DECISION-MAKING FACTORS
- FIGURE 37 INFLUENCE OF STAKEHOLDERS ON BUYING PROCESS FOR TOP THREE END-USE INDUSTRIES
- FIGURE 38 KEY BUYING CRITERIA FOR TOP THREE END-USE INDUSTRIES
- FIGURE 39 ADOPTION BARRIERS & INTERNAL CHALLENGES
- FIGURE 40 MOBILE CRANES SEGMENT TO ACCOUNT FOR LARGEST MARKET SHARE IN 2025
- FIGURE 41 LOW WEIGHTLIFTING CAPACITY SEGMENT TO DOMINATE MARKET IN 2025
- FIGURE 42 BUILDING & CONSTRUCTION SEGMENT TO ACCOUNT FOR LARGEST MARKET SHARE IN 2025
- FIGURE 43 ASIA PACIFIC TO ACCOUNT FOR LARGEST SHARE OF CRANE RENTAL MARKET DURING FORECAST PERIOD
- FIGURE 44 ASIA PACIFIC: CRANE RENTAL MARKET SNAPSHOT
- FIGURE 45 MIDDLE EAST & AFRICA: CRANE RENTAL MARKET SNAPSHOT
- FIGURE 46 CRANE RENTAL MARKET: REVENUE ANALYSIS OF KEY PLAYERS, 2020-2024
- FIGURE 47 CRANE RENTAL MARKET SHARE ANALYSIS, 2024
- FIGURE 48 CRANE RENTAL MARKET: COMPANY VALUATION
- FIGURE 49 CRANE RENTAL MARKET: FINANCIAL MATRIX (EV/EBITDA RATIO)
- FIGURE 50 CRANE RENTAL MARKET: YEAR-TO-DATE PRICE AND FIVE-YEAR STOCK BETA
- FIGURE 51 CRANE RENTAL MARKET: BRAND/PRODUCT COMPARISON
- FIGURE 52 CRANE RENTAL MARKET: COMPANY EVALUATION MATRIX (KEY PLAYERS), 2024
- FIGURE 53 CRANE RENTAL MARKET: COMPANY FOOTPRINT
- FIGURE 54 CRANE RENTAL MARKET: COMPANY EVALUATION MATRIX (STARTUPS/SMES), 2024
- FIGURE 55 UNITED RENTALS, INC.: COMPANY SNAPSHOT
- FIGURE 56 LIEBHERR: COMPANY SNAPSHOT
- FIGURE 57 PALFINGER AG: COMPANY SNAPSHOT
- FIGURE 58 THE MANITOWOC COMPANY, INC.: COMPANY SNAPSHOT
- FIGURE 59 ACTION CONSTRUCTION EQUIPMENT LTD.: COMPANY SNAPSHOT

