
PUBLISHER: Juniper Research Ltd | PRODUCT CODE: 1518931

PUBLISHER: Juniper Research Ltd | PRODUCT CODE: 1518931
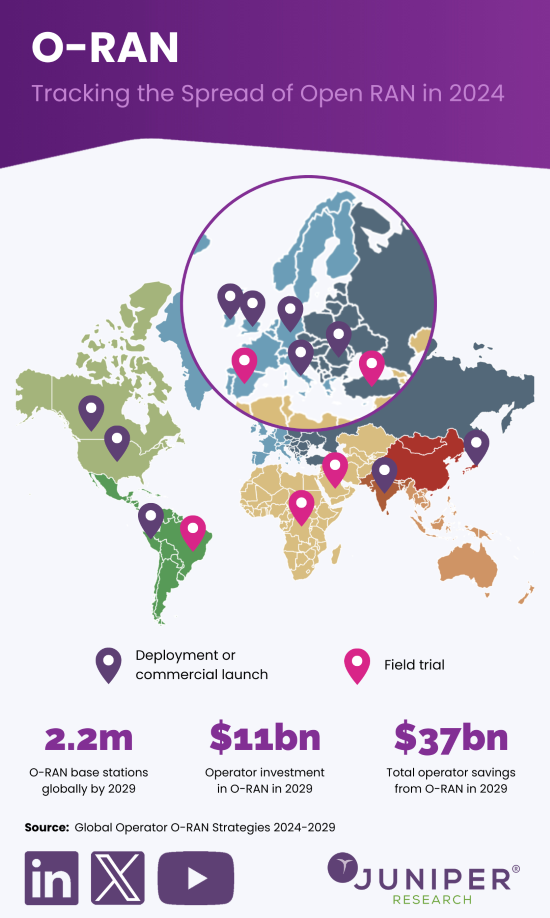
Global Operator O-RAN Strategies: 2024-2029
'Open-RAN Investment by Operators to Surge in Next Five Years Reaching $39 Billion, as Operators Focus on Maximising Network Efficiency'
| KEY STATISTICS | |
|---|---|
| Operator O-RAN investment in 2024: | $3.5bn |
| Operator O-RAN investment in 2029: | $39bn |
| Proportion of total base stations that are O-RAN-compliant in 2029: | 19.1% |
| Forecast period: | 2024-2029 |
Overview
Juniper Research's "O-RAN (Open Radio Access Network)" research suite provides insights and actionable insights into this rapidly growing and competitive market; enabling stakeholders, such as operators and O-RAN vendors to navigate and capitalise on the development and deployment of O-RAN hardware and software in operator networks.
This is achieved through a detailed assessment of the solution flexibility factors driving O-RAN architectures development and deployment in the telecommunications industry, including the growing volume and technical challenges of volatility in cellular data generation, and increasing mobile user equipment and higher RAN capital and operating expenditure. The report also provides an analysis of the different O-RAN components, including the RIC (Radio Access Network Intelligent Controller) split into non-RT RIC (Real-time Radio Access Network Intelligent Controller) and near-RT-RIC, SMO (Service Management and Orchestration), O-Cloud, and radio units, distributed units, and centralised units. It also provides operators with strategies for xApp and rApp development and deployment, O-RAN security innovation, multi-vendor and integration, and brownfield deployments.
The market growth report also includes analysis and recommendations for how operators can maximise the impact of O-RAN on quality of service, network performance, and network efficiency. Analysis and recommendations are provided for RIS (Reconfigurable Intelligent Surface) integration, MOCN (Multi Operator Core Network), network slicing, traffic steering, and private networks.
The market forecast suite includes several different options that can be purchased separately, including access to data mapping and a forecast document; a strategy and trends document detailing critical trends in the market and strategic recommendations for deploying O-RAN and maximising its benefits, such as eliminating vendor lock-in and increased access to intelligence and automation, and a Competitor Leaderboard containing extensive analysis of 13 market leaders and technology providers in O-RAN.
The connectivity technology coverage can also be purchased as a Full Research Suite, which contains all these elements and offers a substantial discount.
Collectively, they provide a critical tool for understanding these rapidly emerging market segments, and for operators and O-RAN vendors shaping their future strategy for monetisation and network transformation. Its unparalleled coverage makes this research suite an incredibly useful resource for charting the future of a crucial and rapidly growing market.
Key Features
- Market Dynamics: Insights into key trends and opportunities within the O-RAN market; such as RIS integration, RAN sharing, traffic steering, network slicing, as well as single-0vednor and multi-vendor RAN. These use cases will be critical to operators maximising total cost of ownership saving and benefits to quality of service and network technologies performance. Included is analysis of the latest O-RAN standards released by the O-RAN Alliance such as the introduction of a new O-RAN fronthaul interface, and trials by operators and vendors. Also provided are recommendations for the development and deployment of xApps and rApps, the deployment and integration of multi-vendor O-RAN, and strategies for greenfield and brownfield O-RAN deployments.
- Key Takeaways & Strategic Recommendations: In-depth analysis of key development opportunities and findings within the O-RAN market shares, accompanied by strategic recommendations for operators and O-RAN vendors.
- Benchmark Industry Forecasts: The forecast market size business overview into mobile network operators and O-RAN vendors provides forecasts for the total number of mobile subscribers and cellular IoT devices, total operator revenue, and total cellular data generated. Also included are forecasts for the total number of base stations, total number of O-RAN base stations, total operator investment and commercial deployment in O-RAN, and cumulative investment in O-RAN over the next five years.
- Juniper Research Competitor Leaderboard: Key player capability and capacity assessment of 13 O-RAN vendors via the Juniper Research Competitor Leaderboard. This features market sizing for major players in the O-RAN industry and detailed analysis of their offerings.
Market Data & Forecasting Report
The research suite for the "O-RAN" market includes access to the full set of forecast data of 40 tables and over 24,000 datapoints. Metrics in the research suite include:
- Total User Equipment, Split by Mobile Subscriptions and Cellular IoT Devices
- Total Cellular Data Generated by User Equipment, Split by Mobile Subscriptions and Cellular IoT Devices
- Total Operator Revenue from User Equipment, Split by Mobile Subscriptions and Cellular IoT Devices
- Total Number of Base Stations
- Total Number of O-RAN Compliant Base Stations
- Total Operator Investment in O-RAN Per Year
- Cumulative Operator Investment in O-RAN
Juniper Research Interactive Forecast Excel contains the following functionality:
- Statistics Analysis: Users benefit from the ability to search for specific metrics, displayed for all regions and countries across the data period. Graphs are easily modified and can be exported to the clipboard.
- Country Data Tool: This tool lets users look at metrics for all regions and countries in the forecast period. Users can refine the metrics displayed via a search bar.
- Country Comparison Tool: Users can select and compare specific countries. The ability to export graphs is included in this tool.
- What-if Analysis: Here, users can compare forecast metrics using a proactive approach, against their own assumptions, via 5 interactive scenarios.
Market Trends & Strategies Report
This growth of demand report thoroughly examines the "O-RAN" market landscape; assessing market trends and factors shaping the evolution of this rapidly developing and growing market. The future market trends report delivers a comprehensive analysis of the strategic business opportunities for operators and O-RAN vendors.
The innovative ecosystem report addresses how stakeholders should maximise the impact of O-RAN through use cases such as RIS integration, MOCN, network slicing, traffic steering, and private networks. Analysis, market breakdown and strategic recommendations are provided for xApp and rApp development and deployment, network security innovation, such as zero trust architectures, brownfield O-RAN deployments, and multi-vendor operator deployments.
It also includes evaluation of specific operators' cloudification strategies and the wider O-RAN market in key countries. This includes analysis of the progress in O-RAN deployments and development, the development of O-RAN standards by the O-RAN Alliance, and country-level O-RAN trends.
Competitor Leaderboard Report
The Competitor Leaderboard report provides a detailed evaluation and market positioning for 13 O-RAN vendors. The key companies are positioned as established leaders, leading challengers, or disruptors and challengers based on capacity and capability assessment. This includes analysis of the key advantages in the market, O-RAN technology and ecosystem, and O-RAN partnerships and integration, with key vendors including:
|
|
This O-RAN solutions document is centred around the Juniper Research Competitor Leaderboard; a vendor positioning tool that provides an at-a-glance view of the competitive landscape in a market, backed by a robust methodology.
Table of Contents
Market Trends & Strategies
1. Key Takeaways & Strategic Recommendations
- 1.1. Key Takeaways
- 1.2. Key Strategic Recommendations
2. Market Landscape
- 2.1. O-RAN Introduction
- Figure 2.1: Map of O-RAN Commercial Deployments
- 2.2. O-RAN Standard Developments
- 2.3. O-RAN Trials and Developments
- 2.4 Key Factors Driving O-RAN Development and Deployment
- 2.4.1. 5G and 6G Networks Necessitate Expanded RAN Deployments
- Figure 2.2: Total Number of Base Stations, Split by Eight Key Regions, 2024-2029
- i. Base Station Site Availability Issues Promote RAN Sharing
- 2.4.2. Cellular Data Generation Growth Requires RAN Intelligence
- Figure 2.3: Total Cellular Data Consumed (PB), Split by Mobile Subscribers and Cellular IoT, 2024-2029
- i. Increasingly Volatility in Cellular Data Consumption
- 2.4.1. 5G and 6G Networks Necessitate Expanded RAN Deployments
3. Future Strategies & Opportunities
- 3.1 Key Components of O-RAN
- Figure 3.1: O-RAN Architecture
- 3.1.1. O-RAN Units
- 3.1.2. RIC
- Figure 3.2:RIC Use Cases
- Figure 3.3: RIC Architecture
- i. xApp and rApp Strategies
- 3.1.3. SMO
- 3.1.4. O-Cloud
- 3.2 Key Strategic Considerations for Operators Implementing O-RAN
- 3.2.1. Multi-Vendor Transitions and System Integration
- 3.2.2. Greenfield and Brownfield O-RAN Deployments
- 3.2.3. Security in O-RAN Deployments
- Figure 3.4: 2024 O-RAN Security Specifications Roadmap
- i. Zero-Trust Architectures in O-RAN
- 3.3. Operator Opportunities in O-RAN
- 3.3.1. Intelligent Electromagnetic Environments With RIS
- Figure 3.5: RIS In Operation
- 3.3.2. MOCN (Multi-Operator Core Networks) Strategies in O-RAN
- 3.3.3. MIMO
- 3.3.4. Network Slicing Optimisation
- 3.3.5. Traffic Steering
- 3.3.6. Private Networks
- Figure 3.6: Key Market Verticals for Private Networks
- 3.3.1. Intelligent Electromagnetic Environments With RIS
4. Country Readiness Index
- 4.1. Introduction to Country Readiness Index
- Figure 4.1: O-RAN Country Readiness Index Regional Definitions
- Table 4.2: Juniper Research Country Readiness Index Scoring Criteria: O-RAN
- Figure 4.3: Juniper Research Country Readiness Index: O-RAN
- Table 4.4: O-RAN Country Readiness Index: Market Segments
- 4.2. Focus Markets
- i. vRAN and Telecommunications Cloud Development Paves the Way for O-RAN Deployments
- ii. Huawei Ban Promotes O-RAN to Increase Competition
- 4.2.2. The US
- Figure 4.5: Total Operator Revenue from User Equipment in the US ($m), 2024-2029
- Figure 4.6: Cumulative Operator Investment in O-RAN in the US ($m), 2024-2029
- 4.3. Growth Markets
- i. China
- Figure 4.7:Total Operator Revenue From User Equipment in China ($m), 2024-2029
- Figure 4.8:Total Operator Investment in O-RAN in China ($m), 2024-2029
- i. China
- 4.4. Developing Markets
- Table 4.9: Juniper Research's Country Readiness Index Heatmap: North America
- Table 4.10: Juniper Research's Country Readiness Index Heatmap: Latin America
- Table 4.11: Juniper Research's Country Readiness Index Heatmap: West Europe
- Table 4.12: Juniper Research's Country Readiness Index Heatmap: Central & East Europe
- Table 4.13: Juniper Research's Country Readiness Index Heatmap: Far East & China
- Table 4.14: Juniper Research's Country Readiness Index Heatmap: Indian Subcontinent
- Table 4.15: Juniper Research's Country Readiness Index Heatmap: Rest of Asia Pacific
- Table 4.16: Juniper Research's Country Readiness Index Heatmap: Africa & Middle East
Competitor Leaderboard
1. Competitor Leaderboard
- 1.1. Why Read This Report
- Figure 1.1: Juniper Research Competitor Leaderboard Vendors and Product Portfolios
- Figure 1.2: Juniper Research Competitor Leaderboard: O-RAN Vendors
- Source: Juniper ResearchTable 1.3:Juniper Research Competitor Leaderboard: RAN Vendors & Positioning
- Table 1.4: Juniper Research Competitor Leaderboard Heatmap: O-RAN Vendors
2. Vendor Profiles
- 2.1. Vendor Profiles
- 2.1.1. Airspan Networks
- i. Corporate Information
- ii. Geographical Spread
- iii. Key Clients & Strategic Partnerships
- iv. High-level View of Offerings
- Figure 2.1: Airspan OpenRANGE Deployment
- v. Juniper Research's View: Key Strengths & Strategic Development Opportunities
- 2.1.2. Ericsson
- i. Corporate Information
- Table 2.2: Ericsson's Financial Information ($m), 2020-2023
- ii. Geographical Spread
- iii. Key Clients & Strategic Partnerships
- iv. High-level View of Offerings
- Figure 2.3: Ericsson's Intelligent Automation Platform Components and Interfaces
- v. Juniper Research's View: Key Strengths & Strategic Development Opportunities
- i. Corporate Information
- 2.1.3. Fujitsu
- i. Corporate Information
- ii. Geographical Spread
- iii. Key Clients & Strategic Partnerships
- iv. High-level View of Offerings
- v. Juniper Research's View: Key Strengths & Strategic Development Opportunities
- 2.1.4. Juniper Networks
- i. Corporate Information
- ii. Geographical Spread
- iii. Key Clients & Strategic Partnerships
- iv. High-level View of Offerings
- Figure 2.4: Juniper Networks' RIC
- v. Juniper Research's View: Key Strengths & Strategic Development Opportunities
- 2.1.5. Mavenir
- i. Corporate Information
- ii. Geographical Spread
- iii. Key Clients & Strategic Partnerships
- iv. High-level View of Offerings
- v. Juniper Research's View: Key Strengths & Strategic Development Opportunities
- 2.1.6. NEC
- i. Corporate Information
- ii. Geographical Spread
- iii. Key Clients & Strategic Partnerships
- v. Juniper Research's View: Key Strengths & Strategic Development Opportunities
- 2.1.3. Fujitsu
- i. Corporate Information
- ii. Geographical Spread
- iii. Key Clients & Strategic Partnerships
- iv. High-level View of Offerings
- v. Juniper Research's View: Key Strengths & Strategic Development Opportunities
- 2.1.4. Juniper Networks
- i. Corporate Information
- ii. Geographical Spread
- iii. Key Clients & Strategic Partnerships
- iv. High-level View of Offerings
- Figure 2.4: Juniper Networks' RIC
- v. Juniper Research's View: Key Strengths & Strategic Development Opportunities
- 2.1.5. Mavenir
- i. Corporate Information
- ii. Geographical Spread
- iii. Key Clients & Strategic Partnerships
- iv. High-level View of Offerings
- v. Juniper Research's View: Key Strengths & Strategic Development Opportunities
- 2.1.6. NEC
- i. Corporate Information
- ii. Geographical Spread
- iii. Key Clients & Strategic Partnerships
- iv. High-level View of Offerings
- Figure 2.5: NEC Open vRAN
- v. Juniper Research's View: Key Strengths & Strategic Development Opportunities
- 2.1.7. Nokia
- i. Corporate Information
- Table 2.6: Nokia Select Financial Information ($m), 2020-2023
- ii. Geographical Spread
- iii. Key Clients & Strategic Partnerships
- iv. High-level View of Offerings
- Figure 2.7: Nokia 5G AirScale Radio Product Offerings
- Figure 2.8: Nokia anyRAN
- v. Juniper Research's View: Key Strengths & Strategic Development Opportunities
- i. Corporate Information
- 2.1.8. Parallel Wireless
- i. Corporate Information
- ii. Geographical Spread
- iii. Key Clients & Strategic Partnerships
- iv. High-level View of Offerings
- Figure 2.9: Parallel Wireless O-RAN Solution
- Figure 2.10: Parallel Wireless Service Orchestration and Management
- v. Juniper Research's View: Key Strengths & Strategic Development Opportunities
- 2.1.9. Radisys
- i. Corporate Information
- ii. Geographical Spread
- iii. Key Clients & Strategic Partnerships
- iv. High-level View of Offerings
- v. Juniper Research's View: Key Strengths & Strategic Development Opportunities
- 2.1.10. Rakuten Symphony
- i. Corporate Information
- ii. Geographical Spread
- iii. Key Clients & Strategic Partnerships
- iv. High-level View of Offerings
- v. Juniper Research's View: Key Strengths & Strategic Development Opportunities
- 2.1.11. Samsung
- i. Corporate Information
- Table 2.11: Samsung's Financial Information ($b), 2019-2022
- ii. Geographical Spread
- iii. Key Clients & Strategic Partnerships
- iv. High-level View of Offerings
- Figure 2.12: Samsung vRAN Roadmap
- Figure 2.13: Samsung Network Radios
- v. Juniper Research's View: Key Strengths & Strategic Development Opportunities
- i. Corporate Information
- 2.1.12. SynaXG
- i. Corporate Information
- ii. Geographical Spread
- iii. Key Clients & Strategic Partnerships
- iv. High-Level View of Offerings
- Figure 2.14: SynaXG O-RAN Software
- Figure 2.15: SynaXG's RAN Offerings
- v. Juniper Research's View: Key Strengths & Strategic Development Opportunities
- 2.1.13. VMware
- i. Corporate Information
- ii. Geographical Spread
- iii. Key Clients & Strategic Partnerships
- iv. High-level View of Offerings
- Figure 2.16: VMware Telco Cloud Platform
- Figure 2.17: VMware Centralised RIC and Decentralised RIC
- v. Juniper Research's View: Key Strengths & Strategic Development Opportunities
- 2.1.1. Airspan Networks
- 2.2. Juniper Research Leaderboard Assessment Methodology
- 2.3. Limitations & Interpretations
- Table 2.18: Juniper Research Competitor Leaderboard: O-RAN
Data & Forecasting
1. Introduction and Methodology
- 1.1. Introduction to O-RAN
- Figure 1.1: Total Investment in O-RAN by Operators per year ($m), 2024-2029
- 1.2. Methodology
- Figure 1.2:O-RAN Market Methodology
2. Forecast Summary
- 2.1. Total Number of Consumer Subscriptions
- Figure & Table 2.1: Total Number of Consumer Subscriptions (), Split By 8 Key Regions, 2024-2029
- 2.2. Total Cellular Data Generated by Consumer Subscriptions
- Figure & Table 2.2: Total Cellular Data Generated by Consumer Subscriptions, Split By 8 Key Regions, 2024-2029
- 2.3. Total Operator Revenue From Consumer Subscriptions
- Figure & Table 2.3: Total Operator Revenue From Consumer Subscriptions ($m), Split by 8 Key Regions, 2024-2029
- 2.4. Total Number of Cellular IoT Devices
- Figure & Table 2.4:Total Number of Cellular IoT Devices (m), Split By 8 Key Regions, 2024-2029
- 2.5. Total Cellular Data Generated by Cellular IoT Devices
- Figure & Table 2.5: Total Cellular Data Generated by Cellular IoT Devices (PB), Split by 8 Key Regions, 2024-2029
- 2.6. Total Operator Revenue from Cellular IoT Devices
- Figure & Table 2.6: Total Operator Revenue from Cellular IoT Devices ($m), Split by 8 Key Regions, 2024-2029
- 2.7. Total Number of Base Stations
- Figure & Table 2.7: Total Number of Base Stations, Split by 8 Key Regions, 2024-2029
- 2.8. Total Number of O-RAN Compliant Base Stations
- Figure & Table 2.8: Total Number of O-RAN Compliant Base Stations, Split By 8 Key Regions, 2024-2029
- 2.9. Total Operator Investment in O-RAN
- Figure & Table 2.9: Total Operator Investment in O-RAN ($m), Split By 8 Key Regions, 2024-2029
- 2.10. Total Operator Savings From O-RAN
- Figure & Table 2.10: Total Operator Savings From O-RAN ($m), Split By 8 Key Regions, 2024-2029

