
PUBLISHER: Juniper Research Ltd | PRODUCT CODE: 1500643

PUBLISHER: Juniper Research Ltd | PRODUCT CODE: 1500643
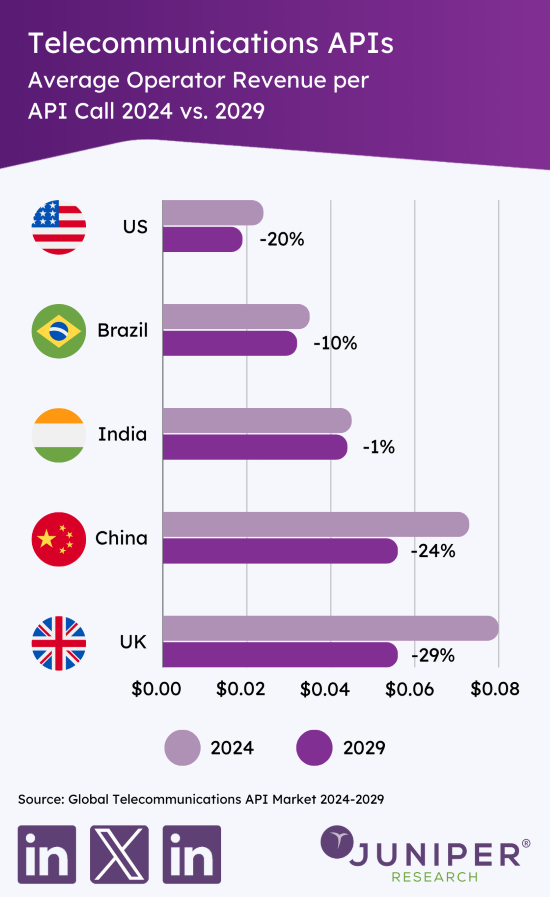
Global Telecommunications API Market: 2024-2029
| KEY STATISTICS | |
|---|---|
| Total operator revenue in 2024: | $50.9bn |
| Total operator revenue in 2029: | $159.5bn |
| 2024-2029 market growth: | 213% |
| Forecast period: | 2024-2029 |
Overview
Our "Telecommunications API" (Application Programming Interfaces) research suite is comprised of comprehensive and insightful impact analysis of key factors of this evolving market; enabling stakeholders from network operators, messaging service providers, enterprise developers and hyperscalers to understand major factors that include future growth, key trends and investment opportunities in the demand for telecom APIs.
The current telecom API market report includes several different options that can be purchased separately, including access to a market forecast of the adoption and future growth of the telco API market; a detailed study highlighting the latest trends and opportunities direct impact within the market, and two leaderboard documents containing an analysis of the major players in communications API provision and leading network management API vendors in the space. The coverage can also be purchased as a full research suite, containing all of these elements, and including a substantial discount.
The custom report in the telecom sector provides a critical tool for stakeholders in the telecoms industry for navigating this rapidly developing market and dynamic landscape; allowing vendors to shape their future strategy with telco API monetisation and capitalise on emerging opportunities as programmable networks become a reality. Its extensive coverage makes this telecom API market analysis research suite an incredibly valuable resource for examining the future of this changing market.
Key Features
- Market Dynamics: Provides detailed insight into the outlook of the telco API market; assessing the key drivers to future market growth, including the role of global initiatives such as the GSMA Open Gateway and CAMARA Project in providing access to network capabilities to app developers. It addresses market dynamics such as the key challenges that must be overcome for this market to experience significant growth, including scalability and ensuring quality of service is met. The research also explores the different APIs under the CAMARA Project; examining the benefits and market demand for these services, and the commercial models which will be used for monetisation.
- Key Takeaways & Strategic Recommendations: In-depth analysis of key development opportunities, industry trends and findings within the telco API market; accompanied by key strategic recommendations for stakeholders.
- Benchmark Industry Forecasts: The market size and forecasts for telco APIs include 5-year forecasts for total number of API calls, and total operator revenue for telecommunications APIs. The forecast breaks this down into different API categories: Device Identity & Status, Mobile Fraud Prevention, Mobile Payments, Network Connectivity and Communications.
- Juniper Research Competitor Leaderboard: Key industry player capability and capacity assessments for leading telecommunications API vendors, via the Juniper Research Competitor Leaderboard; which separates communications API and network management API vendors.
Market Data & Forecasting Report
The market-leading research suite for the "Telecommunications API" market includes access to the full set of market forecast data of 30 tables and over 13,500 datapoints. Metrics in the research suite include:
- Total Number of Telecommunications API Calls
- Total Operator Revenue from Telecommunications API Calls
These metrics are provided for the following API categories:
- Device Identity & Status
- Mobile Fraud Prevention
- Mobile Payments APIs
- Network Connectivity
- Communications
Juniper Research Interactive Forecast Excel contains the following functionality:
- Statistics Analysis: Users benefit from the ability to search for specific metrics, displayed for all regions and countries across the data period. Graphs are easily modified and can be exported to the clipboard.
- Country Data Tool: This tool lets users look at metrics for all key regions and countries in the forecast period. Users can refine the metrics displayed via a search bar.
- Country Comparison Tool: Users can select countries and compare each of them for specific countries. The ability to export graphs is included in this tool.
- What-if Analysis: Here, users can compare forecast metrics against their own assumptions, via 5 interactive scenarios.
Market Trends & Strategies Report
This market study examines the "Telecommunications API" landscape in detail; assessing the trends and factors shaping the evolution of this growing market. The report delivers an in-depth analysis of the strategic opportunities for vendors; addressing key concerns, and the crucial role of how stakeholders should overcome these to capitalise and gain competitive edge on the emerging telco API opportunity. It also evaluates key country-level opportunities for telco API growth.
Competitor Leaderboard Report
This telecom industry market players report includes two Competitor Leaderboard reports, which provide a wide range and detailed evaluation and market positioning of 16 leading Communications API and 15 Network Management API vendors. The vendors are positioned as established leaders, leading challengers or disruptors and challengers based on largest market share capacity and capability assessments.
Juniper Research Competitor Leaderboard for Communications APIs, including key players:
|
|
Juniper Research Competitor Leaderboard for Network Management APIs, including key players:
|
|
These documents are centred around the Juniper Research Competitor Leaderboard; a vendor positioning tool that provides an at-a-glance view of the competitive landscape in a market, backed by a robust methodology.
Table of Contents
Market Trends & Strategies
1. Key Takeaways & Strategic Recommendations
- 1.1. Key Takeaways
- 1.2. Strategic Recommendations
2. Future Market Outlook
- 2.1. Introduction
- Figure 2.1: Enterprise Adoption of APIs without Standardised APIs
- Figure 2.2: Revenue Flow Without Telco APIs vs With
- 2.1.1. Future Market Outlook
- Figure 2.3: Total Operator Revenue from Telecommunications API Calls ($m), Split by 8 Key Regions, 2024-2029
- Figure 2.4: Total Number of Telecommunications API Calls in 2024 (m), Split by Category
- 2.1.2. Monetisation of API Services
- Figure 2.5: Business Models for API Access
- 2.1.3. Challenges for Future Market Development
3. GSMA Open Gateway and CAMARA
- 3.1. GSMA Open Gateway
- Figure 3.1: Global Coverage of Operator Groups Supporting Open Gateway
- Figure 3.2: Mobile Operators Signed Up to Open Gateway
- 3.2. Introduction to CAMARA APIs
- 3.2.1. Scope of the CAMARA Project
- 3.3. CAMARA API Types
- 3.3.1. Communications APIs
- i. Click to Dial
- Figure 3.3: Click to Dial API
- ii. Short Message Service
- iii. WebRTC
- i. Click to Dial
- 3.3.2. Connectivity APIs
- i. Connectivity Insights
- Figure 3.4: Connectivity Insights API Flow
- ii. Home Devices QoD
- iii. Network Slice Booking (Slice on Demand)
- iv. Quality on Demand
- Figure 3.5: Overview of QoD API
- v. Site to Cloud VPN
- Figure 3.6: Site to Cloud VPN API Flow
- i. Connectivity Insights
- 3.3.3. Device Identify & Status
- i. Device Identifier
- Figure 3.7: Device Identifier API
- ii. Device Location
- iii. Device Status
- iv. Device Swap
- i. Device Identifier
- 3.3.4. Mobile Fraud Prevention
- i. Call Forwarding Signal
- ii. KYC (Know Your Customer)
- Figure 3.8: KYC Match API Work Flow
- iii. Number Verification
- Figure 3.9: Without Number Verification API
- Figure 3.10: With Number Verification API
- iv. SIM Swap
- v. OTP Validation API
- 3.3.5. Mobile Payments
- i. Carrier Billing Check Out
- ii. Blockchain Public Address
- 3.3.6. Other APIs
- i. Population Density Data
- ii. Edge Cloud
- iii. Region User Count
- 3.3.1. Communications APIs
- 3.4. Open Gateway APIs Launched in Different Regions
- Table 3.11: Operators in North America That Have Commercially Launched GSMA Open Gateway APIs as of May 2024
- Table 3.12: Operators in Latin America That Have Commercially Launched GSMA Open Gateway APIs as of May 2024
- Table 3.13: Operators in West Europe That Have Commercially Launched GSMA Open Gateway APIs as of May 2024
- Table 3.14: Operators in Far East & China That Have Commercially Launched GSMA Open Gateway APIs as of May 2024
- Table 3.15: Operators in Rest of Asia Pacific That Have Commercially Launched GSMA Open Gateway APIs as of May 2024
- Table 3.16: Operators in Africa & Middle East That Have Commercially Launched GSMA Open Gateway APIs as of May 2024
4. Country Readiness Index
- 4.1. Telco API Country Readiness Index
- Figure 4.1: Countries in Each Region
- Table 4.2: Juniper Research Telco API Country Readiness Index: Scoring Criteria
- Table 4.4: Telco APIs Country Readiness Index: Market Segments
- 4.1.1. Focus Markets
- i. Support for GSMA Open Gateway
- Figure 4.5: Total Number of Telecommunications API Calls ($m), Split by Brazil, Germany, Indonesia, and Spain, 2024-2025
- ii. Demand for Fraud Prevention Services
- Figure 4.6: Total Operator Revenue from Mobile Fraud Prevention API Calls in Select Countries in Far East & China ($m), 2024-2029
- i. Support for GSMA Open Gateway
- 4.1.2. Growth Markets
- i. Operators to Prioritise Investment into 5G Infrastructure
- Figure 4.7: Total Number of 5G Connections (m) vs Operator Revenue from Network Connectivity APIs in West Europe ($m), 2026
- ii. Lower Support for the GSMA Open Gateway
- iii. Cellular IoT Connections Will Create Demand for Connectivity APIs
- Figure 4.8: Total Number of Cellular IoT Connections in Select Countries in West Europe (m), 2024-2026
- iv. High Operator ARPU Will Encourage Investment into Telecommunications APIs
- i. Operators to Prioritise Investment into 5G Infrastructure
- 4.1.3. Saturated Markets
- i. Low Demand for Telecommunications APIs
- Figure 4.9: Proportion of the Population That Are Banked (%), Average for Focus Markets vs Average for Saturated Markets, 2024
- ii. Low Operator ARPU for Future Investment into Telecommunications APIs
- i. Low Demand for Telecommunications APIs
- 4.1.4. Developing Markets
- i. Limited 5G Infrastructure
- ii. Low Demand for the Fraud Prevention Use Case
- Table 4.10: Juniper Research Country Readiness Index Heatmap: North America
- Table 4.11: Juniper Research Country Readiness Index Heatmap: Latin America
- Table 4.12: Juniper Research Country Readiness Index Heatmap: West Europe
- Table 4.13: Juniper Research Country Readiness Index Heatmap: Central & East Europe
- Table 4.14: Juniper Research Country Readiness Index Heatmap: Far East & China
- Table 4.15: Juniper Research Country Readiness Index Heatmap: Indian Subcontinent
- Table 4.16: Juniper Research Country Readiness Index Heatmap: Rest of Asia Pacific
- Table 4.17: Juniper Research Country Readiness Index Heatmap: Africa & Middle East
Competitor Leaderboard
1. Juniper Research Competitor Leaderboard: Communications API Vendors
- Table 1.1: Juniper Research Competitor Leaderboard: Vendors & Product Portfolio
- Figure 1.2: Juniper Research Competitor Leaderboard: Telecommunications API Vendors (Communications)
- Source: Juniper ResearchTable 1.3: Juniper Research Competitor Leaderboard: Vendors & Positioning
- Table 1.4: Juniper Research Competitor Leaderboard Heatmap: Telecommunications API Vendors
2. Vendor Profiles: Communications API Vendors
- 2.1. Telecommunications APIs (Communications) Vendor Profiles
- 2.1.1. BICS
- i. Corporate Information
- Table 2.1: BICS' Select Financial Information (Eurom), 2022 & 2023
- ii. Geographical Spread
- iii. Key Clients & Strategic Partnerships
- iv. High-level View of Offerings
- v. Juniper Research's View: Key Strengths & Strategic Development Opportunities
- i. Corporate Information
- 2.1.2. CM.com
- i. Corporate Information
- Table 2.2: Acquisitions Made by CM.com, 2021-Present
- Table 2.3: CM.com's Select Financial Information (Eurom), 2022-2023
- ii. Geographical Spread
- iii. Key Clients & Strategic Partnerships
- iv. High-level View of Offerings
- v. Juniper Research's View: Key Strengths & Strategic Development Opportunities
- i. Corporate Information
- 2.1.3. Comviva
- i. Corporate Information
- ii. Geographical Spread
- iii. Key Clients & Strategic Partnerships
- iv. High-level View of Offerings
- v. Juniper Research's View: Key Strengths & Strategic Development Opportunities
- 2.1.4. Genesys
- i. Corporate Information
- ii. Geographical Spread
- iii. Key Clients & Strategic Partnerships
- iv. High-level View of Offerings
- v. Juniper Research's View: Key Strengths & Strategic Development Opportunities
- 2.1.5. Infobip
- i. Corporate Information
- Table 2.4: Infobip's Acquisitions - April 2021 to Present
- ii. Geographical Spread
- iii. Key Clients & Strategic Partnerships
- iv. High-level View of Offerings
- v. Juniper Research's View: Key Strengths & Strategic Development Opportunities
- 2.1.6. Microsoft
- i. Corporate Information
- ii. Geographical Spread
- iii. Key Clients & Strategic Partnerships
- iv. High-level View of Offerings
- v. Juniper Research's View: Key Strengths & Strategic Development Opportunities
- 2.1.7. Mitto
- i. Corporate Information
- ii. Geographical Spread
- iii. Key Clients & Strategic Partnerships
- iv. High-level View of Offerings
- v. Juniper Research's View: Key Strengths & Strategic Development Opportunities
- 2.1.8. Orange
- i. Corporate Information
- ii. Geographical Spread
- Figure 2.5: Orange Operations Map
- iii. Key Clients & Strategic Partnerships
- iv. High-level View of Offerings
- Figure 2.6: Orange Business Talk API - Overview
- Figure 2.7: Orange SMS API - Overview
- v. Juniper Research's View: Key Strengths & Strategic Development Opportunities
- 2.1.9. Route Mobile
- i. Corporate Information
- Table 2.8: Route Mobile's Annual Financial Information (Indian Rupee Cr), 2021-2023
- ii. Geographical Spread
- iii. Key Clients & Strategic Partnerships
- iv. High-level View of Offerings
- Figure 2.9: How Route Mobile's OTP Service Works
- v. Juniper Research's View: Key Strengths & Strategic Development Opportunities
- i. Corporate Information
- 2.1.10. Sinch
- i. Corporate Information
- Table 2.10: Sinch's Most Recent Acquisitions, 2020-2021
- Table 2.11: Sinch's Select Financial Information ($m), 2021-2023
- ii. Geographical Spread
- iii. Key Clients & Strategic Partnerships
- iv. High-level View of Offerings
- Figure 2.12: Sinch Conversation API - Overview
- Figure 2.13: Sinch Verification API - Overview
- v. Juniper Research's View: Key Strengths & Strategic Development Opportunities
- i. Corporate Information
- 2.1.11. Soprano Design
- i. Corporate Information
- ii. Geographical Spread
- iii. Key Clients & Strategic Partnerships
- iv. High-evel View of Offerings
- v. Juniper Research's View: Key Strengths & Strategic Development Opportunities
- 2.1.12. Syniverse
- i. Corporate Information
- ii. Geographical Spread
- iii. Key Clients & Strategic Partnerships
- iv. High-level View of Offerings
- v. Juniper Research's View: Key Strengths & Strategic Development Opportunities
- 2.1.13. Telesign
- i. Corporate Information
- ii. Geographical Spread
- iii. Key Clients & Strategic Partnerships
- iv. High-level View of Offerings
- Figure 2.15: Telesign Verify API - Overview
- v. Juniper Research's View: Key Strengths & Strategic Development Opportunities
- 2.1.14. Twilio
- i. Corporate Information
- Table 2.16: Twilio's Acquisitions, Nov 2019-Present
- Table 2.17: Twilio's Revenue Information ($m), 2021-2023
- ii. Geographical Spread
- iii. Key Clients & Strategic Partnerships
- iv. High-level View of Offerings
- v. Juniper Research's View: Key Strengths & Strategic Development Opportunities
- i. Corporate Information
- 2.1.15. Vodafone Business
- i. Corporate Information
- Table 2.18: Vodafone Business' Select Financial Information (Eurom), FY 2022-2023
- ii. Geographical Spread
- iii. Key Clients & Strategic Partnerships
- iv. High-level View of Offerings
- v. Juniper Research's View: Key Strengths & Strategic Development Opportunities
- i. Corporate Information
- 2.1.16. Vonage
- i. Corporate Information
- ii. Geographical Spread
- iii. Key Clients & Strategic Partnerships
- iv. High-level View of Offerings
- v. Juniper Research's View: Key Strengths & Strategic Development Opportunities
- 2.1.1. BICS
- 2.2. Juniper Research Leaderboard Assessment Methodology
3. Juniper Research Competitor Leaderboard: Network Management API Vendors
- Table 3.1: Juniper Research Competitor Leaderboard: Vendors & Product Portfolio
- Figure 3.2: Juniper Research Competitor Leaderboard: Telecommunications API Vendors (Network Management)
- Source: Juniper ResearchTable 3.3: Juniper Research Competitor Leaderboard: Vendors & Positioning
- Table 3.4: Juniper Research Competitor Leaderboard Heatmap: Telco API Vendors (Network Management)
4. Vendor Profiles: Network Management API Vendors
- 4.1. Telecommunications APIs (Network Management) Vendor Profiles
- 4.1.1. Amazon Web Services
- i. Corporate Information
- Table 4.1: AWS' Revenue in 2021 and 2022 ($bn), 2021-2022
- ii. Geographical Spread
- Figure 4.2: Amazon Web Service Infrastructure Deployments Map, 2023
- iii. Key Clients & Strategic Partnerships
- iv. High-level View of Offerings
- v. Juniper Research's View: Key Strengths & Strategic Development Opportunities
- i. Corporate Information
- 4.1.2. BICS
- i. Corporate Information
- Table 4.3: BICS' Select Financial Information (Eurom), 2022-2023
- ii. Geographical Spread
- iii. Key Clients & Strategic Partnerships
- iv. High-level View of Offerings
- v. Juniper Research's View: Key Strengths & Strategic Opportunities
- i. Corporate Information
- 4.1.3. Cisco
- i. Corporate Information
- ii. Geographical Spread
- iii. Key Clients & Strategic Partnerships
- iv. High-level View of Offerings
- v. Juniper Research's View: Key Strengths & Strategic Development Opportunities
- 4.1.4. Comviva
- i. Corporate Information
- ii. Geographical Spread
- iii. Key Clients & Strategic Partnerships
- iv. High-level View of Offerings
- v. Juniper Research's View: Key Strengths & Strategic Development Opportunities
- 4.1.5. Deutsche Telekom Global Carrier
- i. Corporate Information
- Table 4.5: Deutsche Telekom's Select Financial Information (Eurobn), 2021-2023
- ii. Geographical Spread
- iii. Key Clients & Strategic Partnerships
- iv. High-level View of Offerings
- Figure 4.6: Deutsche Telekom Cloud of Things Features and Services
- v. Juniper Research's View: Key Strengths & Strategic Development Opportunities
- i. Corporate Information
- 4.1.6. Ericsson
- i. Corporate Information
- Table 4.7: Ericsson窶- Financial Information ($m), 2019-2023
- ii. Geographical Spread
- iii. Key Clients & Strategic Partnerships
- iv. High-level View of Offerings
- Figure 4.8: Ericsson Cloud Core Exposure Server Including Edge Exposure Server
- v. Juniper Research's View: Key Strengths & Strategic Development Opportunities
- i. Corporate Information
- 4.1.7. Fujitsu
- i. Corporate Information
- ii. Geographical Spread
- v. Juniper Research's View: Key Strengths & Strategic Development Opportunities
- 4.1.4. Comviva
- i. Corporate Information
- ii. Geographical Spread
- iii. Key Clients & Strategic Partnerships
- iv. High-level View of Offerings
- v. Juniper Research's View: Key Strengths & Strategic Development Opportunities
- 4.1.5. Deutsche Telekom Global Carrier
- i. Corporate Information
- Table 4.5: Deutsche Telekom's Select Financial Information (Eurobn), 2021-2023
- ii. Geographical Spread
- iii. Key Clients & Strategic Partnerships
- iv. High-level View of Offerings
- Figure 4.6: Deutsche Telekom Cloud of Things Features and Services
- v. Juniper Research's View: Key Strengths & Strategic Development Opportunities
- i. Corporate Information
- 4.1.6. Ericsson
- i. Corporate Information
- Table 4.7: Ericsson窶- Financial Information ($m), 2019-2023
- ii. Geographical Spread
- iii. Key Clients & Strategic Partnerships
- iv. High-level View of Offerings
- Figure 4.8: Ericsson Cloud Core Exposure Server Including Edge Exposure Server
- v. Juniper Research's View: Key Strengths & Strategic Development Opportunities
- i. Corporate Information
- 4.1.7. Fujitsu
- i. Corporate Information
- ii. Geographical Spread
- iii. Key Clients & Strategic Partnerships
- iv. High Level View of Offerings
- v. Juniper Research's View: Key Strengths & Strategic Development Opportunities
- 4.1.8. Google Cloud
- i. Corporate Information
- ii. Geographical Spread
- Figure 4.9: Google Cloud Platform Regions
- iii. Key Clients & Strategic Partnerships
- iv. High-level View of Offerings
- Figure 4.10: Overview of Google Cloud API Management
- Figure 4.11: Preview Version of Google Cloud's SIM Swap Solution
- v. Juniper Research's View: Key Strengths & Strategic Development Opportunities
- 4.1.9. Huawei
- i. Corporate Information
- Table 4.12: Huawei's Select Financial Information ($m), 2020-2023
- ii. Geographical Spread
- iii. Key Clients & Strategic Partnerships
- iv. High-level View of Offerings
- v. Juniper Research's View: Key Strengths & Strategic Development Opportunities
- i. Corporate Information
- 4.1.10. Mavenir
- i. Corporate Information
- ii. Geographical Spread
- iii. Key Clients & Strategic Partnerships
- iv. High-level View of Offerings
- Figure 4.13: MDE Digital Marketplace Approach and Key Highlights
- v. Juniper Research's View: Key Strengths & Strategic Development Opportunities
- 4.1.11. Nokia
- i. Corporate Information
- Table 4.14: Nokia's Select Financial Information (Eurom), 2021-2023
- ii. Geographical Spread
- iii. Key Clients & Strategic Partnerships
- iv. High-level View of Offerings
- v. Juniper Research's View: Key Strengths & Strategic Development Opportunities
- i. Corporate Information
- 4.1.12. Orange
- i. Corporate Information
- ii. Geographical Spread
- Figure 4.15: Orange Operations Map
- iii. Key Clients & Strategic Partnerships
- iv. High-level View of Offerings
- Figure 4.16: High-level View of Orange's Location Verification API Architecture
- Figure 4.17: High-level View of Orange's Location Retrieval API Architecture
- Figure 4.18: High-level View of Orange's Device Status API Architecture
- v. Juniper Research's View: Key Strengths & Strategic Development Opportunities
- 4.1.13. Syniverse
- i. Corporate Information
- ii. Geographical Spread
- iii. Key Clients & Strategic Partnerships
- iv. High-level View of Offerings
- v. Juniper Research's View: Key Strengths & Strategic Development Opportunities
- 4.1.14. Verizon
- i. Corporate Information
- ii. Geographical Spread
- iii. Key Clients & Strategic Partnerships
- iv. High-level View of Offerings
- v. Juniper Research's View: Key Strengths & Strategic Development Opportunities
- 4.1.15. Vodafone Business
- i. Corporate Information
- Table 4.19: Vodafone Business' Select Financial Information (Eurom), FY 2022-2023
- ii. Geographical Spread
- iii. Key Clients & Strategic Partnerships
- iv. High-level View of Offerings
- v. Juniper Research's View: Key Strengths & Strategic Development Opportunities
- i. Corporate Information
- 4.1.1. Amazon Web Services
- 4.2. Juniper Research Leaderboard Assessment Methodology
- 4.3. Limitations & Interpretations
- Table 4.20: Juniper Research Competitor Leaderboard Scoring Criteria
Data & Forecasting
1. Market Summary & Future Outlook
- 1.1. Telecommunications API Market Summary & Future Outlook
- 1.1.1. Telecommunications APIs Market Summary Forecast Methodology
- Figure 1.1: Telecommunications APIs Market Summary Forecast Methodology
- 1.1.1. Telecommunications APIs Market Summary Forecast Methodology
- 1.2. Telecommunications APIs Summary Forecasts
- 1.2.1. Total Number of Telecommunications API Calls
- Figure & Table 1.2: Total Number of Telecommunications API Calls (m), Split by Key Regions, 2024-2029
- 1.2.2. Total Operator Revenue from Telecommunications API Calls
- Figure & Table 1.3: Total Operator Revenue from Telecommunications API Calls ($m), Split by 8 Key Regions, 2024-2029
- 1.2.1. Total Number of Telecommunications API Calls
2. Device Identity & Status APIs
- 2.1. Device Identity & Status Introduction
- 2.1.1. Device Identity & Status Forecast Methodology
- Figure 2.1: Device Identity & Status APIs Forecast Methodology
- 2.1.2. Total Number of Device Identity & Status API Calls
- Figure & Table 2.2: Total Number of Device Identity & Status API Calls (m), Split by 8 Key Regions, 2024-2029
- 2.1.3. Operator Revenue from Device Identity & Status API Calls
- Figure & Table 2.3: Total Operator Revenue from Device Identity & Status API Calls ($m), Split by 8 Key Regions, 2024-2029
- 2.1.1. Device Identity & Status Forecast Methodology
3. Mobile Fraud Prevention APIs
- 3.1. Mobile Fraud Prevention Introduction
- 3.1.1. Mobile Fraud Prevention Forecast Methodology
- Figure 3.1: Mobile Fraud Prevention APIs Forecast Methodology
- 3.1.2. Total Number of Mobile Fraud Prevention API Calls
- Figure & Table 3.2: Total Number of Mobile Fraud Prevention API Calls (m), Split by 8 Key Regions, 2024-2029
- 3.1.3. Operator Revenue from Mobile Fraud Prevention API Calls
- Figure & Table 3.3: Total Operator Revenue from Mobile Fraud Prevention API Calls ($m), Split by 8 Key Regions, 2024-2029
- 3.1.1. Mobile Fraud Prevention Forecast Methodology
4. Mobile Payments APIs
- 4.1. Mobile Payments Introduction
- 4.1.1. Mobile Payments Forecast Methodology
- Figure 4.1: Mobile Payments APIs Forecast Methodology
- 4.1.2. Total Number of Mobile Payments API Calls
- Figure & Table 4.2: Total Number of Mobile Payments API Calls (m), Split by 8 Key Regions, 2024-2029
- 4.1.3. Operator Revenue from Mobile Payments API Calls
- Figure & Table 4.3: Total Operator Revenue from Mobile Payments API Calls ($m), Split by 8 Key Regions, 2024-2029
- 4.1.1. Mobile Payments Forecast Methodology
5. Network Connectivity APIs
- 5.1. Network Connectivity Introduction
- 5.1.1. Network Connectivity Forecast Methodology
- Figure 5.1: Network Connectivity APIs Forecast Methodology
- Total Number of Network Connectivity API Calls
- Figure & Table 5.2: Total Number of Connectivity API Calls (m), Split by 8 Key Regions, 2024-2029
- Figure 5.1: Network Connectivity APIs Forecast Methodology
- 5.1.2. Operator Revenue from Network Connectivity API Calls
- Figure & Table 5.3: Total Operator Revenue from Connectivity API Calls ($m), Split by 8 Key Regions, 2024-2029
- 5.1.1. Network Connectivity Forecast Methodology
6. Communications APIs
- 6.1. Communications APIs Introduction
- 6.1.1. Communications APIs Forecast Methodology
- Figure 6.1: Communications APIs Forecast Methodology
- 6.1.2. Total Number of Communications API Calls
- Figure & Table 6.2: Total Number of Communications API Calls (m), Split by Key Regions, 2024-2029
- 6.1.3. Operator Revenue from Communications API Calls
- Figure & Table 6.3: Total Operator Revenue from Communications API Calls ($m), Split by 8 Key Regions, 2024-2029
- 6.1.1. Communications APIs Forecast Methodology
7. Other Telecommunications APIs
- 7.1. Other Telecommunications APIs Introduction
- 7.1.1. Other Telecommunications APIs Forecast Methodology
- Figure 7.1: Other API Calls Forecast Methodology
- 7.1.2. Total Number of Other API Calls
- Figure & Table 7.2: Total Number of Other API Calls (m), Split by 8 Key Regions, 2024-2029
- 7.1.3. Operator Revenue from Other API Calls
- Figure & Table 7.3: Total Operator Revenue from Mobile Fraud Prevention API Calls ($m), Split by 8 Key Regions, 2024-2029
- 7.1.1. Other Telecommunications APIs Forecast Methodology

