
PUBLISHER: Global Market Insights Inc. | PRODUCT CODE: 1699429

PUBLISHER: Global Market Insights Inc. | PRODUCT CODE: 1699429
VR Headsets Market Opportunity, Growth Drivers, Industry Trend Analysis, and Forecast 2025-2034
The Global VR Headsets Market reached USD 9.1 billion in 2024 and is projected to witness a robust growth rate of 19.7% CAGR from 2025 to 2034. The increasing integration of artificial intelligence (AI) with VR technology has significantly transformed user experiences, making virtual environments smarter and more interactive. AI is enhancing VR applications by creating responsive virtual settings that adapt to user behavior in real time. Along with AI integration, advancements in manufacturing processes and scaling production are driving down the cost of VR headsets, allowing companies to offer these devices at more affordable prices. As production expenses decline, VR headsets are becoming more accessible to a broader consumer segment, encouraging widespread adoption. The growing affordability, combined with a rising demand for immersive content in gaming, education, and other industries, is expected to sustain the market's growth trajectory over the next decade.
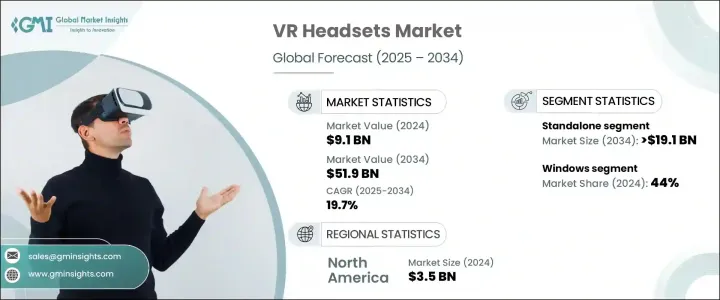
Based on product type, the VR headsets market is segmented into standalone, tethered, and smartphone-enabled devices. Among these, standalone VR headsets are rapidly becoming the preferred choice for consumers. In 2024, the standalone segment generated around USD 3.4 billion and is anticipated to exceed USD 19.1 billion by 2034. These devices are gaining popularity as they offer an all-in-one solution without the need for additional hardware such as PCs or gaming consoles. Standalone headsets come with built-in processors, sensors, and displays, making them easier to set up and use. Their wireless functionality adds to user convenience and improves mobility, making them attractive to a wide range of users seeking hassle-free VR experiences.
| Market Scope | |
|---|---|
| Start Year | 2024 |
| Forecast Year | 2025-2034 |
| Start Value | $9.1 Billion |
| Forecast Value | $51.9 Billion |
| CAGR | 19.7% |
When analyzed by operating system, the VR headsets market is segmented into Windows, iOS, and Android. The Windows segment dominated the market in 2024, generating approximately USD 4 billion and holding nearly 44% of the overall market share. This leadership position is supported by Windows' extensive compatibility with VR hardware and its robust software development ecosystem. Windows-based systems are known for offering high-performance capabilities necessary for running advanced VR applications across multiple industries. The operating system's strong foothold in the gaming community has also contributed to its dominant market share, as users seek seamless VR experiences with powerful graphics and processing support.
Regionally, North America held a significant position in the VR headsets market, with a value of around USD 3.5 billion in 2024. The region is expected to register a CAGR of 19.7% between 2025 and 2034. The rapid growth of VR adoption across industries such as entertainment, healthcare, and education, along with increasing investments in emerging VR technologies, continues to fuel demand across the region.
Table of Contents
Chapter 1 Methodology & Scope
- 1.1 Market scope & definition
- 1.2 Base estimates & calculations
- 1.3 Forecast parameters
- 1.4 Data sources
- 1.4.1 Primary
- 1.4.2 Secondary
- 1.4.2.1 Paid sources
- 1.4.2.2 Public sources
Chapter 2 Executive Summary
- 2.1 Industry 3600 synopsis, 2021 - 2034
Chapter 3 Industry Insights
- 3.1 Industry ecosystem analysis
- 3.1.1 Factor affecting the value chain
- 3.1.2 Profit margin analysis
- 3.1.3 Disruptions
- 3.1.4 Future outlook
- 3.1.5 Manufacturers
- 3.1.6 Distributors
- 3.1.7 Retailers
- 3.2 Impact forces
- 3.2.1 Growth drivers
- 3.2.1.1 Advancements in immersive technology
- 3.2.1.2 Expanding 5G network expansion
- 3.2.1.3 Increasing disposable income
- 3.2.2 Industry pitfalls & challenges
- 3.2.2.1 High initial investment
- 3.2.2.2 Health and Safety Concerns
- 3.2.1 Growth drivers
- 3.3 Consumer buying behavior analysis
- 3.3.1 Demographic trends
- 3.3.2 Factors affecting buying decisions
- 3.3.3 Consumer product adoption
- 3.3.4 Preferred distribution channel
- 3.4 Growth potential analysis
- 3.5 Regulatory landscape
- 3.6 Pricing analysis
- 3.7 Porter's analysis
- 3.8 PESTEL analysis
Chapter 4 Competitive Landscape, 2024
- 4.1 Introduction
- 4.2 Company market share analysis
- 4.3 Competitive positioning matrix
- 4.4 Strategic outlook matrix
Chapter 5 Market Estimates & Forecast, By Type, 2021-2034 (USD Billion) (Million Units)
- 5.1 Key Trends
- 5.2 Tethered
- 5.3 Standalone
- 5.4 Smartphone enabled
Chapter 6 Market Estimates & Forecast, By Component, 2021-2034 (USD Billion) (Million Units)
- 6.1 Key trends
- 6.2 Hardware
- 6.3 Software
Chapter 7 Market Estimates & Forecast, By Operating System, 2021 – 2034, (USD Billion) (Million Units)
- 7.1 Key trends
- 7.2 Windows
- 7.3 iOS
- 7.4 Android
Chapter 8 Market Estimates & Forecast, By Connectivity Technology, 2021 – 2034, (USD Billion) (Million Units)
- 8.1 Key trends
- 8.2 Bluetooth
- 8.3 HDMI
- 8.4 Wi-Fi
- 8.5 Others (NFC, etc.)
Chapter 9 Market Estimates & Forecast, By Application, 2021 – 2034, (USD Billion) (Million Units)
- 9.1 Key trends
- 9.2 Gaming & entertainment
- 9.3 Education
- 9.4 Healthcare
- 9.5 Retail & ecommerce
- 9.6 Military & defense
- 9.7 Engineering & design
- 9.8 Others
Chapter 10 Market Estimates & Forecast, By Distribution Channel, 2021 – 2034, (USD Billion) (Million Units)
- 10.1 Key trends
- 10.2 Online
- 10.2.1 E-commerce
- 10.2.2 Company websites
- 10.3 Offline
- 10.3.1 Supermarkets & department stores
- 10.3.2 Specialty stores
- 10.3.3 Gaming stores
- 10.3.4. Others (B2B channels, subscription services, etc.)
Chapter 11 Market Estimates & Forecast, By Region, 2021 – 2034, (USD Billion) (Million Units)
- 11.1 Key trends
- 11.2 North America
- 11.2.1 U.S.
- 11.2.2 Canada
- 11.3 Europe
- 11.3.1 Germany
- 11.3.2 U.K.
- 11.3.3 France
- 11.3.4 Italy
- 11.3.5 Spain
- 11.3.6 Rest of Europe
- 11.4 Asia Pacific
- 11.4.1 China
- 11.4.2 India
- 11.4.3 Japan
- 11.4.4 South Korea
- 11.4.5 Rest of Asia Pacific
- 11.5 Latin America
- 11.5.1 Brazil
- 11.5.2 Mexico
- 11.5.3 Rest of Latin America
- 11.6 MEA
- 11.6.1 UAE
- 11.6.2 Saudi Arabia
- 11.6.3 South Africa
- 11.6.4 Rest of MEA
Chapter 12 Company Profiles (Business Overview, Financial Data, Product Landscape, Strategic Outlook, SWOT Analysis)
- 12.1 Google LLC
- 12.2 HP Inc.
- 12.3 HTC Corporation
- 12.4 Lenovo Group Limited
- 12.5 Magic Leap, Inc.
- 12.6 Meta Platforms, Inc.
- 12.7 Microsoft Corporation
- 12.8 Pico Interactive, Inc.
- 12.9 Pimax Technology (Shanghai) Co., Ltd.
- 12.10 Razer Inc.
- 12.11 Samsung Electronics Co., Ltd.
- 12.12 Shenzhen Baofeng Mojing Technology Co., Ltd.
- 12.13 Sony Group Corporation
- 12.14 Valve Corporation
- 12.15 Xiaomi Corporation

