
PUBLISHER: Global Market Insights Inc. | PRODUCT CODE: 1698549

PUBLISHER: Global Market Insights Inc. | PRODUCT CODE: 1698549
Agrivoltaic Market Opportunity, Growth Drivers, Industry Trend Analysis, and Forecast 2025-2034
The Global Agrivoltaic Market, valued at USD 6.3 billion in 2024, is projected to grow at a 5.6% CAGR from 2025 to 2034. The increasing adoption of large-scale solar installations integrated with agricultural activities is driving this expansion. By providing partial shade, solar panels protect crops and livestock from extreme heat and drought, enhancing productivity in agrarian economies. Governments and private enterprises continue to introduce funding initiatives that encourage cost-effective co-location models, reshaping the industry landscape. Additionally, regulatory frameworks are being established worldwide to standardize installations and ensure sustainable deployment. Developed economies, including France, Germany, and Italy, are actively incorporating agrivoltaic systems to optimize land use and improve energy efficiency. The rising need for agricultural land optimization, particularly in land-scarce regions, is fueling adoption, while extensive agricultural landscapes and abundant sunlight in various regions further boost the industry's expansion.
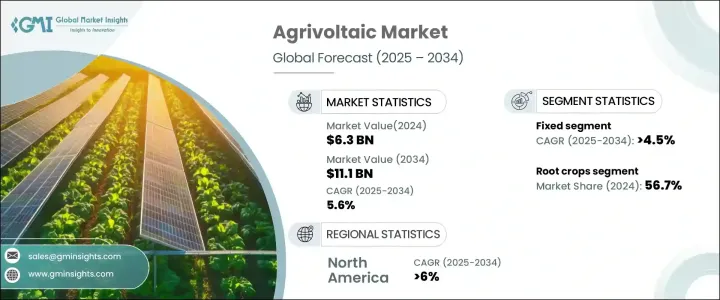
Agrivoltaic systems facilitate the efficient production of food and electricity, contributing to economic growth. The panels installed over vegetation operate at lower temperatures, improving efficiency and enhancing overall energy output. Market segmentation by system design includes fixed and dynamic structures, each contributing to land optimization without disrupting farming activities. Fixed agrivoltaic systems, valued at USD 5.5 billion in 2022, USD 5.9 billion in 2023, and USD 6.3 billion in 2024, are expected to grow at a 4.5% CAGR through 2034. The demand for reliable and cost-effective solar energy solutions is accelerating adoption, while the need for simplified installation processes is further driving market penetration. The push for higher energy yields and improved crop productivity is increasing the deployment of dynamic systems, with innovations in tracking mechanisms enhancing overall performance.
| Market Scope | |
|---|---|
| Start Year | 2024 |
| Forecast Year | 2025-2034 |
| Start Value | $6.3 Billion |
| Forecast Value | $11.1 Billion |
| CAGR | 5.6% |
By harvest type, the market includes root crops, vegetables, and fruits. Root crops represented 56.7% of the market in 2024 and are projected to grow at over 6% CAGR through 2032. The ability of solar panels to minimize water evaporation while maintaining stable soil moisture is a key advantage, with ongoing research identifying additional crop varieties suited for agrivoltaic farming. Vegetables accounted for nearly 20% of the market, as farmers seek additional revenue streams and focus on sustainable farming methods. The agrivoltaic fruit sector is gaining traction due to reduced evaporation rates, improved microclimates, and enhanced income potential for farmers. Pilot projects exploring diverse applications continue to increase interest in the technology.
In the U.S., the agrivoltaic market reached USD 680 million in 2022, USD 720 million in 2023, and USD 770 million in 2024. North America's market is forecasted to expand at a CAGR exceeding 6% through 2034, driven by growing solar energy demand and limited land availability. Smart agrivoltaic systems, designed for monitoring crop health and optimizing energy production, are contributing to this growth, positioning the region as a key market for advanced solar-agriculture integration.
Table of Contents
Chapter 1 Methodology & Scope
- 1.1 Market definitions
- 1.2 Base estimates & calculations
- 1.3 Forecast calculation
- 1.4 Data sources
- 1.4.1 Primary
- 1.4.2 Secondary
- 1.4.2.1 Paid sources
- 1.4.2.2 Unpaid sources
Chapter 2 Executive Summary
- 2.1 Industry 360° synopsis, 2021 – 2034
Chapter 3 Industry Insights
- 3.1 Industry ecosystem analysis
- 3.1.1 Vendor Matrix
- 3.2 Regulatory landscape
- 3.3 Industry impact forces
- 3.3.1 Growth drivers
- 3.3.2 Industry pitfalls & challenges
- 3.4 COVID- 19 impact on the industry outlook
- 3.5 Growth potential analysis
- 3.6 Porter's Analysis
- 3.6.1 Bargaining power of suppliers
- 3.6.2 Bargaining power of buyers
- 3.6.3 Threat of new entrants
- 3.6.4 Threat of substitutes
- 3.7 PESTEL Analysis
Chapter 4 Competitive landscape, 2024
- 4.1 Strategic dashboard
- 4.2 Innovation & sustainability landscape
Chapter 5 Market Size and Forecast, By System Design, 2021 – 2034 (USD Million)
- 5.1 Key trends
- 5.2 Fixed
- 5.3 Dynamic
Chapter 6 Market Size and Forecast, By Harvest Type, 2021 – 2034 (USD Million)
- 6.1 Key trends
- 6.2 Root crops
- 6.3 Vegetables
- 6.4 Fruits
Chapter 7 Market Size and Forecast, By Placement, 2021 – 2034 (USD Million)
- 7.1 Key trends
- 7.2 Standalone
- 7.3 Shading nets
- 7.4 Greenhouses
- 7.5 Others
Chapter 8 Market Size and Forecast, By Region, 2021 – 2034 (USD million)
- 8.1 Key trends
- 8.2 North America
- 8.2.1 U.S.
- 8.2.2 Canada
- 8.2.3 Mexico
- 8.3 Europe
- 8.3.1 Austria
- 8.3.2 Norway
- 8.3.3 Denmark
- 8.3.4 Finland
- 8.3.5 France
- 8.4 Asia Pacific
- 8.4.1 China
- 8.4.2 Australia
- 8.4.3 India
- 8.4.4 South Korea
- 8.5 Rest of World
Chapter 9 Company Profiles
- 9.1 TotalEnergies
- 9.2 Agrivoltaic Solution LLC
- 9.3 Cero Generation Limited
- 9.4 Sun’Agr
- 9.5 iSun, Inc.
- 9.6 REM TEC
- 9.7 Trina Solar
- 9.8 Jinko Solar
- 9.9 VALOREM
- 9.10 SunPower Corporation
- 9.11 Next2Sun
- 9.12 Enel Spa
- 9.13 Solaria
- 9.14 Waaree Energies Ltd.
- 9.15 Insolight
- 9.16 Vattenfall AB
- 9.17 Chint New Energy Technology Co., Ltd.

