
PUBLISHER: Global Market Insights Inc. | PRODUCT CODE: 1698249

PUBLISHER: Global Market Insights Inc. | PRODUCT CODE: 1698249
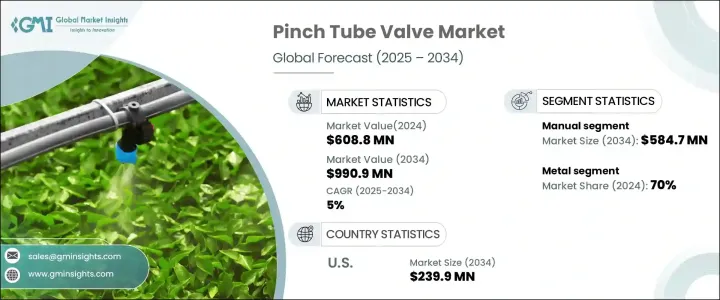
Pinch Tube Valve Market Opportunity, Growth Drivers, Industry Trend Analysis, and Forecast 2025 - 2034
The Global Pinch Tube Valve Market was valued at USD 608.8 million in 2024 and is projected to grow at a CAGR of 5% between 2025 and 2034. The increasing need for precise fluid control and hygienic automation across key industries such as pharmaceuticals, food and beverage, chemicals, and biotechnology is driving significant market expansion. These industries rely heavily on advanced fluid management solutions to enhance efficiency, maintain stringent hygiene standards, and meet regulatory compliance.
As automation becomes a cornerstone of industrial growth, demand for pinch tube valves continues to rise, ensuring contamination-free, efficient fluid handling. Additionally, technological advancements in valve design and materials are improving durability, performance, and adaptability, further fueling market penetration across various sectors. The growing focus on sustainability and energy efficiency is also prompting industries to adopt pinch tube valves, which offer minimal maintenance, reduced operational costs, and superior fluid control. With increasing investments in automation and process optimization, the market is poised for steady growth in the coming years.
| Market Scope | |
|---|---|
| Start Year | 2024 |
| Forecast Year | 2025-2034 |
| Start Value | $608.8 Million |
| Forecast Value | $990.9 Million |
| CAGR | 5% |
The pinch tube valve market is segmented based on operating type, primarily into manual and automatic valves. In 2024, manual pinch tube valves held the largest market share, reaching USD 364 million. Their widespread adoption is attributed to their simplicity, cost-effectiveness, and ease of maintenance. Small and medium-sized enterprises, as well as industries in the early stages of automation, prefer manual pinch valves for reliable fluid control without the complexity or cost of automated systems. These valves are widely used in applications where constant, high-volume automation is not a necessity, but precise fluid handling remains essential.
By material type, the pinch tube valve market is categorized into metal, plastic, and other materials. Metal valves dominated the market in 2024, accounting for a 70% share. Stainless steel, brass, and aluminum pinch valves are preferred for their superior durability, resistance to harsh operating conditions, and ability to withstand high pressure. Industries such as pharmaceuticals, chemical processing, and oil and gas opt for metal valves due to their reliability in extreme environments involving aggressive chemicals, elevated temperatures, and stringent safety requirements. The demand for corrosion-resistant and high-performance valve solutions continues to propel the adoption of metal pinch tube valves across industrial applications.
The U.S. pinch tube valve market was valued at USD 141.4 million in 2024, driven by the growing adoption of automation and process control technologies. Industries such as food processing, pharmaceuticals, and water treatment increasingly implement automated systems that require precise, contamination-free fluid flow control. Pinch tube valves play a critical role in ensuring operational efficiency, reliability, and compliance with hygiene standards in these sectors. As the need for accurate, maintenance-friendly, and durable valve solutions intensifies, the U.S. market is expected to witness consistent growth.
Table of Contents
Chapter 1 Methodology & Scope
- 1.1 Market scope & definition
- 1.2 Base estimates & calculations
- 1.3 Forecast calculations
- 1.4 Data sources
- 1.4.1 Primary
- 1.4.2 Secondary
- 1.4.2.1 Paid sources
- 1.4.2.2 Public sources
Chapter 2 Executive Summary
- 2.1 Industry 3600 synopsis, 2018 - 2032
Chapter 3 Industry Insights
- 3.1 Industry ecosystem analysis
- 3.1.1 Factor affecting the value chain
- 3.1.2 Profit margin analysis
- 3.1.3 Disruptions
- 3.1.4 Future outlook
- 3.1.5 Manufacturers
- 3.1.6 Distributors
- 3.2 Technology advancement analysis
- 3.3 Regulatory landscape
- 3.4 Impact forces
- 3.4.1 Growth drivers
- 3.4.1.1 Growing chemical market
- 3.4.1.2 Increasing demand for high performance applications
- 3.4.1.3 Expanding oil and gas market
- 3.4.2 Industry pitfalls & challenges
- 3.4.2.1 Market saturation
- 3.4.2.2 Sustainability concerns
- 3.4.1 Growth drivers
- 3.5 Consumer buying behavior analysis
- 3.5.1 Demographic trends
- 3.5.2 Factors affecting buying decision
- 3.5.3 Consumer product adoption
- 3.5.4 Preferred distribution channel
- 3.6 Growth potential analysis
- 3.7 Porter’s analysis
- 3.8 PESTEL analysis
Chapter 4 Competitive Landscape, 2023
- 4.1 Introduction
- 4.2 Company market share, 2023
- 4.3 Competitive analysis of major market players, 2023
- 4.4 Competitive positioning matrix, 2023
- 4.5 Strategic outlook matrix, 2023
Chapter 5 Market Estimates & Forecast, By Type, 2018 - 2032, (USD Million; Million Units)
- 5.1 Key trends
- 5.2 Manual
- 5.3 Automatic
Chapter 6 Market Estimates & Forecast, By Material, 2018 - 2032, (USD Million; Million Units)
- 6.1 Key trends
- 6.2 Metal
- 6.3 Plastic
- 6.4 Others (ceramic, etc.)
Chapter 7 Market Estimates & Forecast, By Function, 2018 - 2032, (USD Million; Million Units)
- 7.1 Key trends
- 7.2 Flow control
- 7.3 Shut-off
- 7.4 Other (regulation, etc.)
Chapter 8 Market Estimates & Forecast, By End Use, 2018 - 2032, (USD Million; Million Units)
- 8.1 Key trends
- 8.2 Chemical
- 8.3 Food and beverage
- 8.4 Pharmaceutical
- 8.5 Water treatment
- 8.6 Oil and gas
- 8.7 Others (mining, etc.)
Chapter 9 Market Estimates & Forecast, By Distribution Channel, 2018 - 2032, (USD Million; Million Units)
- 9.1 Key trends
- 9.2 Direct
- 9.3 Indirect
Chapter 10 Market Estimates & Forecast, By Region, 2018 - 2032, (USD Million; Million Units)
- 10.1 Key trends
- 10.2 North America
- 10.2.1 U.S.
- 10.2.2 Canada
- 10.3 Europe
- 10.3.1 UK
- 10.3.2 Germany
- 10.3.3 France
- 10.3.4 Italy
- 10.3.5 Spain
- 10.4 Asia Pacific
- 10.4.1 China
- 10.4.2 India
- 10.4.3 Japan
- 10.4.4 South Korea
- 10.4.5 Australia
- 10.4.6 Malaysia
- 10.4.7 Indonesia
- 10.5 Latin America
- 10.5.1 Brazil
- 10.5.2 Mexico
- 10.6 MEA
- 10.6.1 Saudi Arabia
- 10.6.2 UAE
- 10.6.3 South Africa
Chapter 11 Company Profiles
- 11.1 Badger Meter
- 11.2 Bürkert Fluid Control Systems
- 11.3 ControlAir
- 11.4 Crane
- 11.5 Emerson Electric
- 11.6 Festo
- 11.7 Gore
- 11.8 Graco
- 11.9 Kitz Corporation
- 11.10 Nordson Corporation
- 11.11 Omega Engineering
- 11.12 Parker Hannifin Corporation
- 11.13 Pentair
- 11.14 Schneider Electric
- 11.15 Swagelok Company

