
PUBLISHER: Global Market Insights Inc. | PRODUCT CODE: 1667189

PUBLISHER: Global Market Insights Inc. | PRODUCT CODE: 1667189
Hyperspectral Imaging Systems Market Opportunity, Growth Drivers, Industry Trend Analysis, and Forecast 2025 - 2034
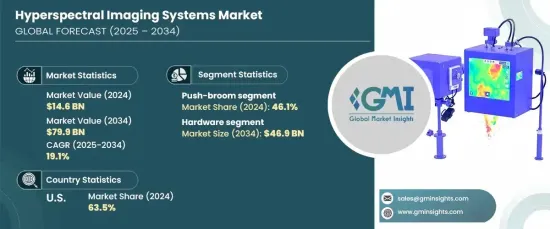
The Global Hyperspectral Imaging Systems Market was valued at USD 14.6 billion in 2024 and is expected to expand at a CAGR of 19.1% from 2025 to 2034. The market growth is driven by continuous advancements in hyperspectral imaging technology, such as sensor miniaturization, enhanced spectral resolution, and cost-effective solutions. These innovations have led to the development of compact hyperspectral cameras and lightweight sensors that can be integrated into drones, unmanned aerial vehicles (UAVs), and portable devices, making the technology more accessible. Hyperspectral imaging is increasingly used for remote sensing and field surveys, expanding its presence in sectors like geology, forestry, and disaster management. Additionally, the adoption of advanced scanning technologies like snapshot hyperspectral cameras and push-broom scanners has simplified operations and made the systems easier to use for smaller industries. These technological breakthroughs are opening new doors for hyperspectral imaging in various fields.
The demand for hyperspectral imaging systems is particularly high in industries that require precise quality control, such as food and beverages. These systems are becoming vital tools for detecting contaminants, ensuring food safety, and monitoring product quality. Hyperspectral imaging can effectively identify foreign materials, spoilage, and inconsistencies in food items, supporting stricter food safety regulations and the growing consumer demand for high-quality products.
| Market Scope | |
|---|---|
| Start Year | 2024 |
| Forecast Year | 2025-2034 |
| Start Value | $14.6 billion |
| Forecast Value | $79.9 billion |
| CAGR | 19.1% |
The market can be categorized by technology into push-broom, snapshot, and whiskbroom hyperspectral imaging. The push-broom hyperspectral imaging segment was the largest in 2024, accounting for 46.1% of the market. Push-broom technology is widely favored due to its high spatial and spectral resolution, allowing for detailed spectral data capture, especially in applications like agriculture, environmental monitoring, and defense surveillance. However, while this technology provides excellent performance, its need for precise motion control and alignment during scanning makes deployment more complex and costly.
The hyperspectral imaging systems market is also divided into hardware and software components. The hardware segment is expected to generate USD 46.9 billion by 2034. This segment includes key components such as hyperspectral sensors, cameras, light sources, and data acquisition systems. With advancements in sensor technology and miniaturization, the demand for compact and portable hyperspectral imaging solutions has surged. These improvements make it possible to deploy hyperspectral imaging systems in drone, UAV, and handheld formats, expanding their use in fields like agriculture, defense, and healthcare.
In 2024, the U.S. held the dominant share of the North American market at 63.5%, driven by substantial investments in defense, aerospace, and healthcare. The U.S. Department of Defense utilizes hyperspectral imaging for military surveillance, target detection, and border security. Additionally, the healthcare industry benefits from these systems for non-invasive diagnostics, disease detection, and surgical guidance. The U.S. market's growth is also supported by the increasing adoption of hyperspectral imaging in precision agriculture and food safety, along with a strong presence of research institutions and government initiatives.
Table of Contents
Chapter 1 Methodology & Scope
- 1.1 Market scope & definitions
- 1.2 Base estimates & calculations
- 1.3 Forecast calculations
- 1.4 Data sources
- 1.4.1 Primary
- 1.4.2 Secondary
- 1.4.2.1 Paid sources
- 1.4.2.2 Public sources
Chapter 2 Executive Summary
- 2.1 Industry synopsis, 2021-2034
Chapter 3 Industry Insights
- 3.1 Industry ecosystem analysis
- 3.1.1 Factor affecting the value chain
- 3.1.2 Profit margin analysis
- 3.1.3 Disruptions
- 3.1.4 Future outlook
- 3.1.5 Manufacturers
- 3.1.6 Distributors
- 3.2 Supplier landscape
- 3.3 Profit margin analysis
- 3.4 Key news & initiatives
- 3.5 Regulatory landscape
- 3.6 Impact forces
- 3.6.1 Growth drivers
- 3.6.1.1 Technological advancements in sensors and miniaturization
- 3.6.1.2 Increased demand in food and beverage quality control
- 3.6.1.3 Adoption in agriculture and environmental monitoring
- 3.6.1.4 Rising demand in defense and surveillance applications
- 3.6.2 Industry pitfalls & challenges
- 3.6.2.1 High implementation costs and complexity
- 3.6.2.2 Lack of standardized data processing and skilled workforce
- 3.6.1 Growth drivers
- 3.7 Growth potential analysis
- 3.8 Porter’s analysis
- 3.9 PESTEL analysis
Chapter 4 Competitive Landscape, 2024
- 4.1 Introduction
- 4.2 Company market share analysis
- 4.3 Competitive positioning matrix
- 4.4 Strategic outlook matrix
Chapter 5 Market Estimates & Forecast, By Component, 2021-2034 (USD Billion)
- 5.1 Key trends
- 5.2 Hardware
- 5.2.1 Cameras
- 5.2.2 Sensors
- 5.2.3 Lenses
- 5.2.4 Detectors
- 5.3 Software
- 5.3.1 Image processing software
- 5.3.2 Data analysis software:
- 5.3.3 Visualization software
- 5.3.4 Calibration software
- 5.3.5 Spectral analysis software
- 5.3.6 Machine learning and AI software
Chapter 6 Market Estimates & Forecast, By Technology, 2021-2034 (USD Billion)
- 6.1 Key trends
- 6.2 Push-broom hyperspectral imaging
- 6.3 Snapshot hyperspectral imaging
- 6.4 Whiskbroom hyperspectral imaging
- 6.5 Others
Chapter 7 Market Estimates & Forecast, By Spectrum Range, 2021-2034 (USD Billion)
- 7.1 Key trends
- 7.2 Visible/Near-Infrared (VNIR)
- 7.3 Shortwave Infrared (SWIR)
- 7.4 Longwave Infrared (LWIR)
Chapter 8 Market Estimates & Forecast, By Application, 2021-2034 (USD Billion)
- 8.1 Key trends
- 8.2 Agriculture
- 8.3 Medical diagnostics
- 8.4 Environmental monitoring
- 8.5 Food and beverages
- 8.6 Industrial inspection
- 8.7 Others
Chapter 9 Market Estimates & Forecast, By Region, 2021-2034 (USD Billion)
- 9.1 Key trends
- 9.2 North America
- 9.2.1 U.S.
- 9.2.2 Canada
- 9.3 Europe
- 9.3.1 UK
- 9.3.2 Germany
- 9.3.3 France
- 9.3.4 Italy
- 9.3.5 Spain
- 9.3.6 Russia
- 9.4 Asia Pacific
- 9.4.1 China
- 9.4.2 India
- 9.4.3 Japan
- 9.4.4 South Korea
- 9.4.5 Australia
- 9.5 Latin America
- 9.5.1 Brazil
- 9.5.2 Mexico
- 9.6 MEA
- 9.6.1 South Africa
- 9.6.2 Saudi Arabia
- 9.6.3 UAE
Chapter 10 Company Profiles
- 10.1 Applied Spectral Imaging
- 10.2 BaySpec, Inc.
- 10.3 ClydeHSI
- 10.4 Corning Incorporated
- 10.5 Cubert GmbH
- 10.6 Diaspective Vision
- 10.7 Gamaya
- 10.8 Headwall Photonics, Inc.
- 10.9 Hinalea Imaging Corp.
- 10.10 HyperMed Imaging, Inc.
- 10.11 imec
- 10.12 Malvern Panalytical Ltd
- 10.13 Norsk Elektro Optikk AS
- 10.14 Orbital Sidekick
- 10.15 Photon Etc
- 10.16 Resonon
- 10.17 Specim, Spectral Imaging Ltd.
- 10.18 Surface Optics Corporation
- 10.19 Telops Inc.
- 10.20 XIMEA GmbH

