
PUBLISHER: Global Market Insights Inc. | PRODUCT CODE: 1667003

PUBLISHER: Global Market Insights Inc. | PRODUCT CODE: 1667003
Electric Vans Market Opportunity, Growth Drivers, Industry Trend Analysis, and Forecast 2025 - 2034
The Global Electric Vans Market, valued at USD 16.3 billion in 2024, is projected to expand at a CAGR of 15.5% between 2025 and 2034. This growth stems from increasing global efforts to combat climate change and reduce air pollution, alongside stricter government regulations on emissions. Governments worldwide are introducing incentives to promote electric vehicle adoption, encouraging businesses to transition to eco-friendly fleets. Electric vans, offering zero-emission alternatives to conventional diesel-powered vehicles, align with these regulatory frameworks and corporate sustainability goals. Improvements in battery technology are also enhancing the viability of electric vans by increasing range and decreasing production costs. These advancements, combined with environmental awareness and regulatory support, are driving demand across industries, particularly in the delivery and logistics sectors.
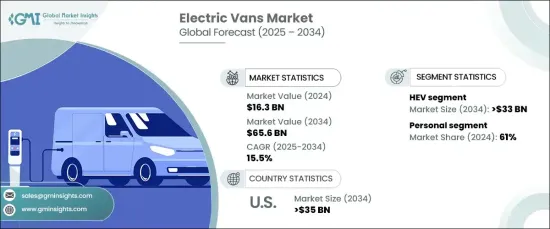
The electric vans market is segmented by vehicle type into commercial and personal categories. The personal segment, which held a significant share in 2024, is driven by consumer preferences for eco-friendly and cost-efficient vehicles. However, the commercial segment is anticipated to outpace it in growth as businesses adopt electric vans to reduce operating costs and meet sustainability targets. Factors such as expanded charging infrastructure and government incentives further bolster the commercial adoption of electric vans, making them a practical solution for logistics and delivery fleets.
| Market Scope | |
|---|---|
| Start Year | 2024 |
| Forecast Year | 2025-2034 |
| Start Value | $16.3 Billion |
| Forecast Value | $65.6 Billion |
| CAGR | 15.5% |
By propulsion, the market is divided into battery electric vehicles (BEVs) and hybrid electric vehicles (HEVs). In 2024, HEVs held a dominant share of the market due to their balance of fuel efficiency and convenience, as they do not solely rely on electric charging infrastructure. Despite this, BEVs are gaining traction due to advancements in battery technology, which improve range and decrease charging times. Increasing affordability and expanding charging networks are making BEVs a more attractive choice for both individual consumers and businesses. As these improvements continue, BEVs are expected to experience significant growth and capture more market share in the future.
The US is a key player in the electric vans market, accounting for a substantial share of revenue in 2024, and is projected to exceed USD 35 billion by 2034. This growth is supported by favorable government policies, tax incentives, and grants aimed at promoting electric vehicle adoption. The presence of major EV manufacturers and investments in advanced technologies further drive innovation and production. Additionally, the expansion of the country's charging infrastructure enhances the feasibility of widespread EV adoption, meeting the rising demand for sustainable transportation solutions. The US market is well-positioned to lead the transition toward cleaner commercial transportation, reflecting the broader global shift toward electric mobility.
Table of Contents
Chapter 1 Methodology & Scope
- 1.1 Research design
- 1.1.1 Research approach
- 1.1.2 Data collection methods
- 1.2 Base estimates and calculations
- 1.2.1 Base year calculation
- 1.2.2 Key trends for market estimates
- 1.3 Forecast model
- 1.4 Primary research & validation
- 1.4.1 Primary sources
- 1.4.2 Data mining sources
- 1.5 Market definitions
Chapter 2 Executive Summary
- 2.1 Industry 3600 synopsis, 2021 - 2034
Chapter 3 Industry Insights
- 3.1 Industry ecosystem analysis
- 3.2 Supplier landscape
- 3.2.1 Electric van manufacturers
- 3.2.2 Distributors
- 3.2.3 End use
- 3.3 Profit margin analysis
- 3.4 Pricing analysis
- 3.5 Patent Landscape
- 3.6 Cost Breakdown
- 3.7 Patent Landscape
- 3.8 Technology & innovation landscape
- 3.9 Key news & initiatives
- 3.10 Regulatory landscape
- 3.11 Impact forces
- 3.11.1 Growth drivers
- 3.11.1.1 Increasing awareness about environmental issues and the need to reduce greenhouse gas emissions
- 3.11.1.2 Government initiatives towards electrification of vehicles
- 3.11.1.3 Businesses and fleet operators are setting sustainability goals and incorporating electric vehicles
- 3.11.1.4 Integration of smart technologies for enhanced efficiency
- 3.11.2 Industry pitfalls & challenges
- 3.11.2.1 High initial upfront costs
- 3.11.2.2 Limited charging infrastructure
- 3.11.1 Growth drivers
- 3.12 Growth potential analysis
- 3.13 Porter’s analysis
- 3.14 PESTEL analysis
Chapter 4 Competitive Landscape, 2024
- 4.1 Introduction
- 4.2 Company market share analysis
- 4.3 Competitive positioning matrix
- 4.4 Strategic outlook matrix
Chapter 5 Market Estimates & Forecast, By Propulsion, 2021 - 2034 ($Bn, Units)
- 5.1 Key trends
- 5.2 BEV
- 5.3 HEV
- 5.3.1 FCEV
- 5.3.2 PHEV
Chapter 6 Market Estimates & Forecast, By Range, 2021 - 2034 ($Bn, Units)
- 6.1 Key trends
- 6.2 Upto 100 miles
- 6.3 100 to 200 miles
- 6.4 Above 200 miles
Chapter 7 Market Estimates & Forecast, By Vehicle, 2021 - 2034 ($Bn, Units)
- 7.1 Key trends
- 7.2 Passenger vehicle
- 7.3 Commercial vehicle
Chapter 8 Market Estimates & Forecast, By Battery, 2021 - 2034 ($Bn, Units)
- 8.1 Key trends
- 8.2 Sealed lead acid
- 8.3 Nickel Metal Hydride (NiMH)
- 8.4 Lithium Ion
Chapter 9 Market Estimates & Forecast, By Region, 2021 - 2034 ($Bn, Units)
- 9.1 Key trends
- 9.2 North America
- 9.2.1 U.S.
- 9.2.2 Canada
- 9.3 Europe
- 9.3.1 UK
- 9.3.2 Germany
- 9.3.3 France
- 9.3.4 Spain
- 9.3.5 Italy
- 9.3.6 Russia
- 9.3.7 Nordics
- 9.4 Asia Pacific
- 9.4.1 China
- 9.4.2 India
- 9.4.3 Japan
- 9.4.4 South Korea
- 9.4.5 ANZ
- 9.4.6 Southeast Asia
- 9.5 Latin America
- 9.5.1 Brazil
- 9.5.2 Mexico
- 9.5.3 Argentina
- 9.6 MEA
- 9.6.1 UAE
- 9.6.2 South Africa
- 9.6.3 Saudi Arabia
Chapter 10 Company Profiles
- 10.1 Ashok Leyland
- 10.2 Ford Motor
- 10.3 General Motors
- 10.4 Hyundai
- 10.5 Isuzu
- 10.6 IVECO
- 10.7 JAC Motors
- 10.8 Mahindra
- 10.9 Maxus
- 10.10 Mercedes-Benz Group
- 10.11 Nissan Motor
- 10.12 Renault
- 10.13 Stellantis
- 10.14 TOYOTA MOTOR
- 10.15 Volkswagen
- 10.16 Arrival
- 10.17 Canoo
- 10.18 Bollinger Motors
- 10.19 Rivian Automotive
- 10.20 Workhorse Group

