
PUBLISHER: Global Market Insights Inc. | PRODUCT CODE: 1666913

PUBLISHER: Global Market Insights Inc. | PRODUCT CODE: 1666913
Mining Flotation Chemicals Market Opportunity, Growth Drivers, Industry Trend Analysis, and Forecast 2025 - 2034
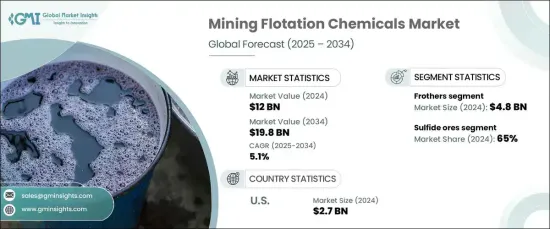
The Global Mining Flotation Chemicals Market, valued at USD 12 billion in 2024, is expected to grow at a robust CAGR of 5.1% from 2025 to 2034. These chemicals play an indispensable role in mineral separation, acting as critical agents in the flotation process. By forming a stable froth layer on the surface of the slurry, they enable mineral particles to adhere to air bubbles, facilitating efficient extraction. This technology remains at the forefront of advancements in the mining sector, supporting industries ranging from construction to technology.
The demand for mining flotation chemicals is fueled by the growing need for base metals and minerals worldwide, driven by rapid industrialization and infrastructure development. As nations continue to invest in large-scale projects, the emphasis on efficient and sustainable extraction methods intensifies. Flotation chemicals are integral to optimizing mineral recovery, reducing waste, and improving overall processing efficiency. With ongoing innovations in mineral processing technologies, the market is poised to capitalize on opportunities stemming from increasing mining activities across the globe.
| Market Scope | |
|---|---|
| Start Year | 2024 |
| Forecast Year | 2025-2034 |
| Start Value | $12 Billion |
| Forecast Value | $19.8 Billion |
| CAGR | 5.1% |
The market is segmented by chemical types, including frothers, collectors, activators, dispersants, and specialty chemicals. Frothers command the largest share of the market, contributing significantly to revenue. Their role in creating froth that facilitates mineral separation makes them indispensable. Collectors, another key category, are experiencing rising demand as they enhance the attachment of minerals to air bubbles, ensuring higher efficiency during the flotation process. Other specialty chemicals also play pivotal roles in addressing unique mining challenges, further boosting their adoption across the sector.
When categorized by ore type, the market includes sulfide ores and non-sulfide ores. Sulfide ores currently dominate, thanks to their prevalence in mining operations. However, non-sulfide ores are witnessing a surge in demand due to their diverse industrial applications. Minerals like phosphate and potash, found in non-sulfide ores, are increasingly used in agriculture for fertilizers and in other industrial processes. Mining companies are diversifying resource extraction to capitalize on these economically viable alternatives, further driving growth in this segment.
In the United States, the mining flotation chemicals market is valued at USD 2.7 billion as of 2024, with steady growth bolstered by a strong domestic mining sector. The nation's push to reduce reliance on imported minerals and support domestic extraction has been a significant driver. Advancements in mineral processing technologies, coupled with substantial investments in mining infrastructure, are fostering the adoption of flotation chemicals. Critical minerals, essential for high-tech industries, are a focal point, with policies promoting sustainable mining practices further accelerating market expansion.
Table of Contents
Chapter 1 Methodology & Scope
- 1.1 Market scope & definitions
- 1.2 Base estimates & calculations
- 1.3 Forecast calculations
- 1.4 Data sources
- 1.4.1 Primary
- 1.4.2 Secondary
- 1.4.2.1 Paid sources
- 1.4.2.2 Public sources
Chapter 2 Executive Summary
- 2.1 Industry synopsis, 2021-2034
Chapter 3 Industry Insights
- 3.1 Industry ecosystem analysis
- 3.1.1 Factor affecting the value chain
- 3.1.2 Profit margin analysis
- 3.1.3 Disruptions
- 3.1.4 Future outlook
- 3.1.5 Manufacturers
- 3.1.6 Distributors
- 3.2 Supplier landscape
- 3.3 Profit margin analysis
- 3.4 Key news & initiatives
- 3.5 Regulatory landscape
- 3.6 Impact forces
- 3.6.1 Growth drivers
- 3.6.1.1 Increasing demand for base and precious metals
- 3.6.1.2 Declining ore grades
- 3.6.1.3 Advancements in flotation technologies
- 3.6.2 Industry pitfalls & challenges
- 3.6.2.1 Price volatility of raw material
- 3.6.2.2 Competition from substitute
- 3.6.1 Growth drivers
- 3.7 Growth potential analysis
- 3.8 Porter’s analysis
- 3.9 PESTEL analysis
Chapter 4 Competitive Landscape, 2024
- 4.1 Introduction
- 4.2 Company market share analysis
- 4.3 Competitive positioning matrix
- 4.4 Strategic outlook matrix
Chapter 5 Market Estimates & Forecast, By Chemical Type, 2021-2034 (USD Billion) (Kilo Tons)
- 5.1 Key trends
- 5.2 Frothers
- 5.3 Collectors
- 5.4 Activators
- 5.5 Dispersants
- 5.6 Others (depressants, surface modifiers)
Chapter 6 Market Estimates & Forecast, By Ore Type, 2021-2034 (USD Billion) (Kilo Tons)
- 6.1 Key trends
- 6.2 Sulfide ores
- 6.3 Non-sulfide ores
Chapter 7 Market Estimates & Forecast, By Application, 2021-2034 (USD Billion) (Kilo Tons)
- 7.1 Key trends
- 7.2 Base metal mining
- 7.3 Precious metal mining
- 7.4 Industrial minerals mining
Chapter 8 Market Estimates & Forecast, By End Use, 2021-2034 (USD Billion) (Kilo Tons)
- 8.1 Key trends
- 8.2 Copper mining
- 8.3 Gold and silver mining
- 8.4 Nickel and platinum group metals mining
- 8.5 Zinc mining
- 8.6 Others (iron ore, coal mining)
Chapter 9 Market Estimates & Forecast, By Region, 2021-2034 (USD Billion) (Kilo Tons)
- 9.1 Key trends
- 9.2 North America
- 9.2.1 U.S.
- 9.2.2 Canada
- 9.3 Europe
- 9.3.1 UK
- 9.3.2 Germany
- 9.3.3 France
- 9.3.4 Italy
- 9.3.5 Spain
- 9.3.6 Russia
- 9.4 Asia Pacific
- 9.4.1 China
- 9.4.2 India
- 9.4.3 Japan
- 9.4.4 South Korea
- 9.4.5 Australia
- 9.5 Latin America
- 9.5.1 Brazil
- 9.5.2 Mexico
- 9.6 MEA
- 9.6.1 South Africa
- 9.6.2 Saudi Arabia
- 9.6.3 UAE
Chapter 10 Company Profiles
- 10.1 Arkema
- 10.2 BASF SE
- 10.3 Beijing Hengju
- 10.4 Cheminova
- 10.5 Chevron Phillips Chemical
- 10.6 Clariant
- 10.7 Cytec Industries
- 10.8 Dow
- 10.9 Huntsman
- 10.10 Kemira
- 10.11 NASACO
- 10.12 Nouryon
- 10.13 Rhodia
- 10.14 Solvay
- 10.15 Wacker Chemie

